| Param | Original file | Final file |
|---|---|---|
| Filename | modeM0/AS1A14_066T07_9000006522_54607cztM0_level2.fits | modeM0/AS1A14_066T07_9000006522_54607cztM0_level2_quad_clean.evt |
| Size (bytes) | 829,704,960 | 112,599,360 |
| Size | 791.3 MB | 107.4 MB |
| Events in quadrant A | 11,530,801 | 640,485 |
| Events in quadrant B | 4,021,388 | 854,572 |
| Events in quadrant C | 9,671,912 | 633,234 |
| Events in quadrant D | 4,843,199 | 701,282 |
| Mode M9 | |||
|---|---|---|---|
| Quadrant | BADHDUFLAG | Total packets | Discarded packets |
| A | 0 | 7 | 0 |
| B | 0 | 7 | 0 |
| C | 0 | 7 | 0 |
| D | 0 | 7 | 0 |
| Mode M0 | |||
|---|---|---|---|
| Quadrant | BADHDUFLAG | Total packets | Discarded packets |
| A | 0 | 40049 | 1 |
| B | 0 | 18227 | 1 |
| C | 0 | 34679 | 1 |
| D | 0 | 20526 | 1 |
| Mode SS | |||
|---|---|---|---|
| Quadrant | BADHDUFLAG | Total packets | Discarded packets |
| A | 0 | 168 | 0 |
| B | 0 | 168 | 0 |
| C | 0 | 168 | 0 |
| D | 0 | 168 | 0 |
| Quadrant | Total seconds | Saturated seconds | Saturation percentage |
|---|---|---|---|
| A | 8343 | 2211 | 26.501259% |
| B | 8343 | 108 | 1.294498% |
| C | 8344 | 1565 | 18.755992% |
| D | 8344 | 205 | 2.456855% |
Noise dominated data is calculated using 1-second bins in cleaned event files. If a bin has >2000 counts, and if more than 50% of those come from <1% of pixels, then it is considered to be noise-dominated and hence unusable.
| Quadrant | # 1 sec bins | Bins with >0 counts | Bins with >2000 counts | High rate bins dominated by noise | Noise dominated (total time) | Noise dominated (detector-on time) | Marked lightcurve |
|---|---|---|---|---|---|---|---|
| A | 9033 | 8344 | 1860 | 1860 | 20.59% | 22.29% | 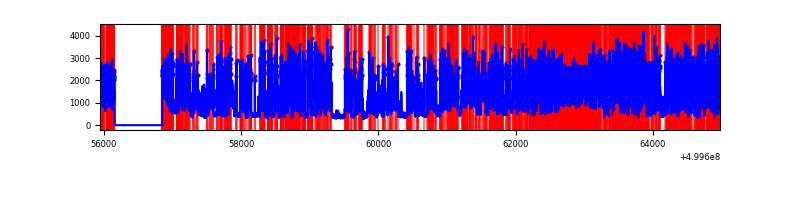 |
| B | 9033 | 8344 | 27 | 27 | 0.30% | 0.32% | 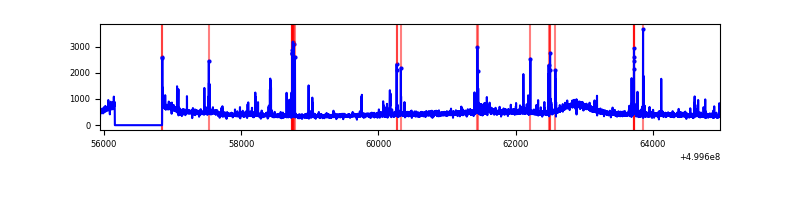 |
| C | 9034 | 8345 | 1321 | 1321 | 14.62% | 15.83% | 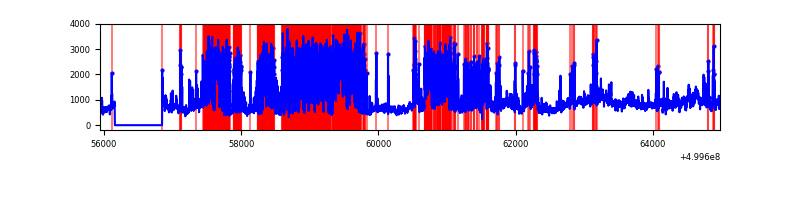 |
| D | 9034 | 8345 | 155 | 155 | 1.72% | 1.86% | 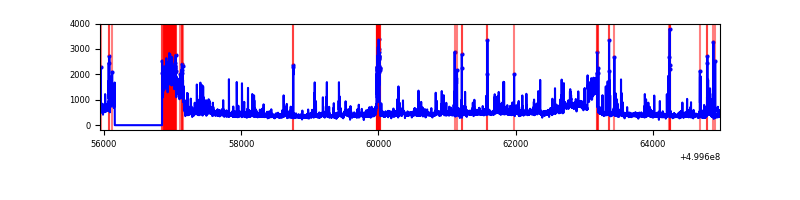 |
Top three noisy pixels from each quadrant. If the there are fewer than three noisy pixels in the level2.evt file, extra rows are filled as -1
| Pixel properties | Quadrant properties | ||||||
|---|---|---|---|---|---|---|---|
| Quadrant | DetID | PixID | Counts | Sigma | Mean | Median | Sigma |
| A | 3 | 14 | 7634838 | 36806.35 | 841 | 821 | 207.4 |
| A | 11 | 3 | 165906 | 795.93 | 841 | 821 | 207.4 |
| A | 8 | 62 | 136581 | 654.55 | 841 | 821 | 207.4 |
| B | 10 | 247 | 115982 | 573.88 | 923 | 888 | 200.6 |
| B | 5 | 172 | 99087 | 489.64 | 923 | 888 | 200.6 |
| B | 1 | 207 | 67509 | 332.18 | 923 | 888 | 200.6 |
| C | 6 | 223 | 3703838 | 15957.52 | 843 | 837 | 232.1 |
| C | 4 | 5 | 2144677 | 9238.55 | 843 | 837 | 232.1 |
| C | 13 | 3 | 159010 | 681.62 | 843 | 837 | 232.1 |
| D | 12 | 33 | 417995 | 1645.78 | 891 | 854 | 253.5 |
| D | 8 | 240 | 395761 | 1558.06 | 891 | 854 | 253.5 |
| D | 2 | 207 | 84346 | 329.41 | 891 | 854 | 253.5 |
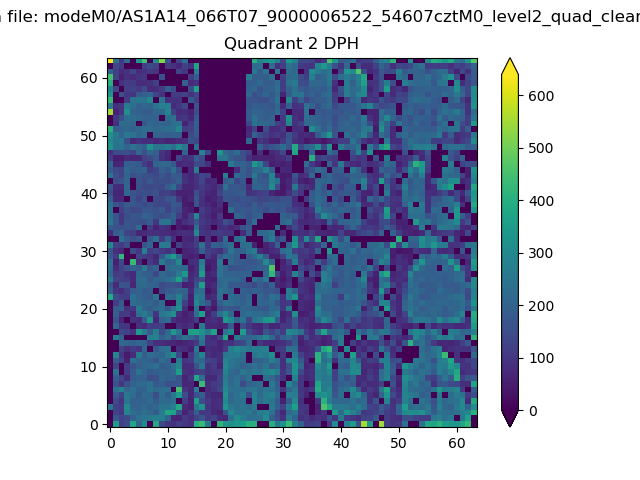
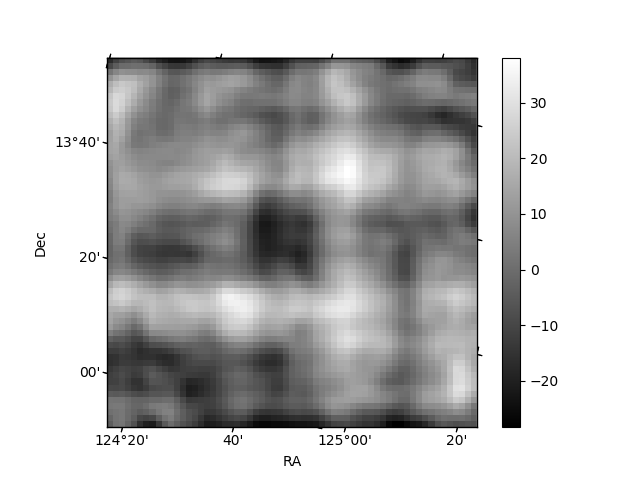
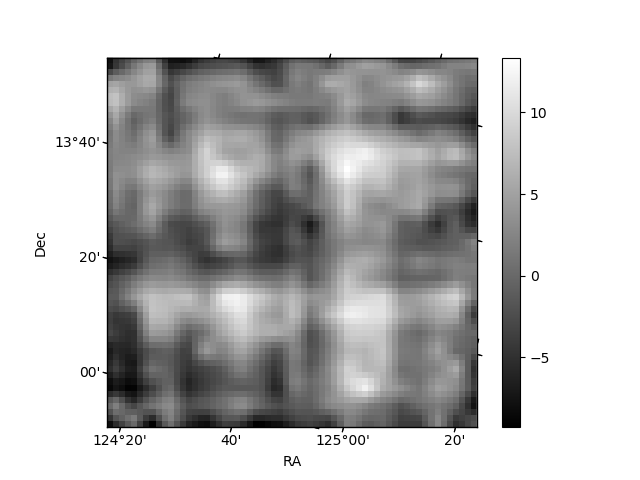
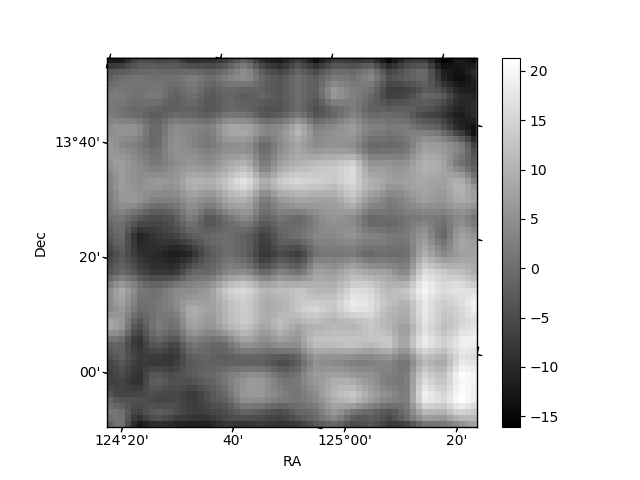
Histogram calculated using DETX and DETY for each event in the final _common_clean file
| Quadrant A | 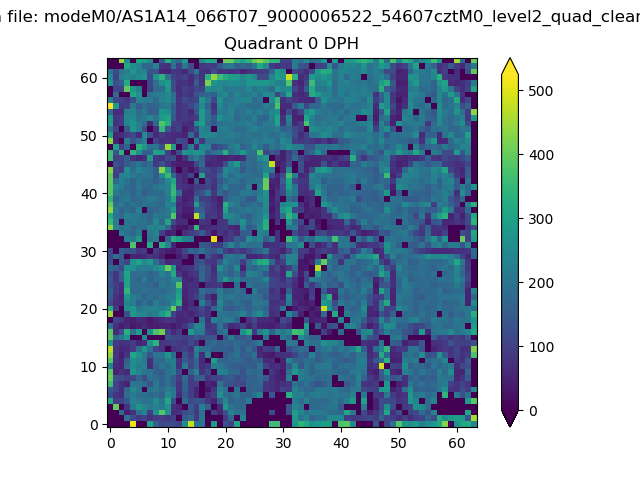 |
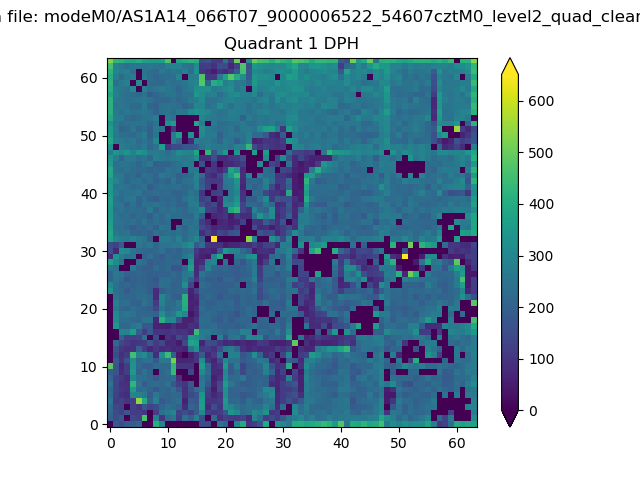 |
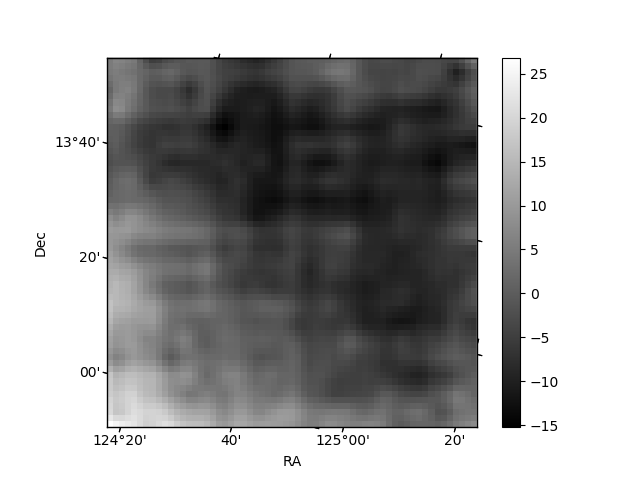
Quadrant B |
|---|---|---|---|
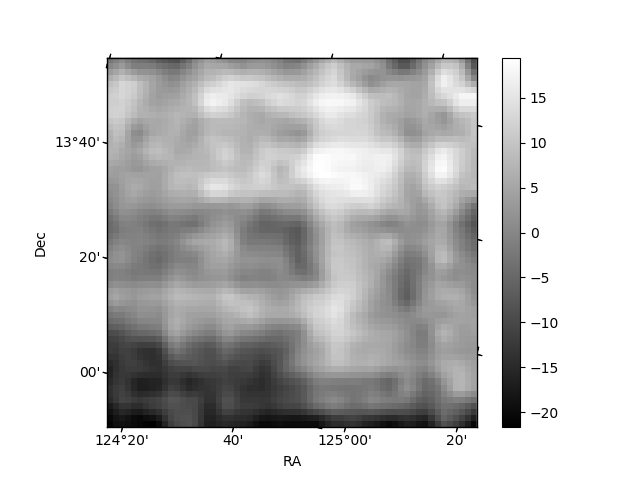
| Quadrant D | 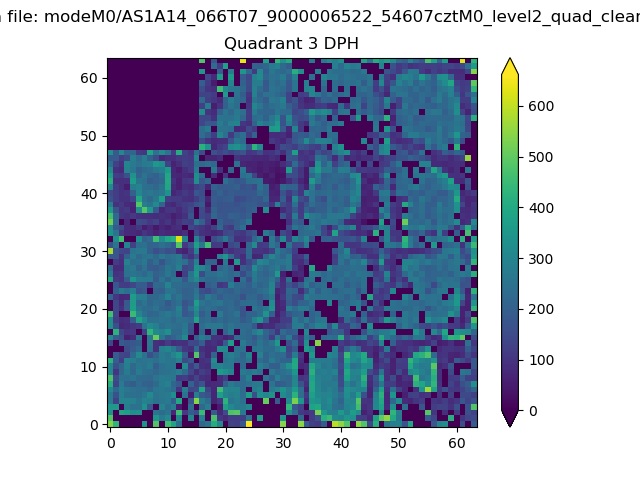 |
 |
Quadrant C |
| Plot type | Count rate plots | Images |
|---|---|---|
| Comparison with Poisson distribution Blue bars denote a histogram of data divided into 1 sec bins. Red curve is a Poisson curve with rate = median count rate of data. |
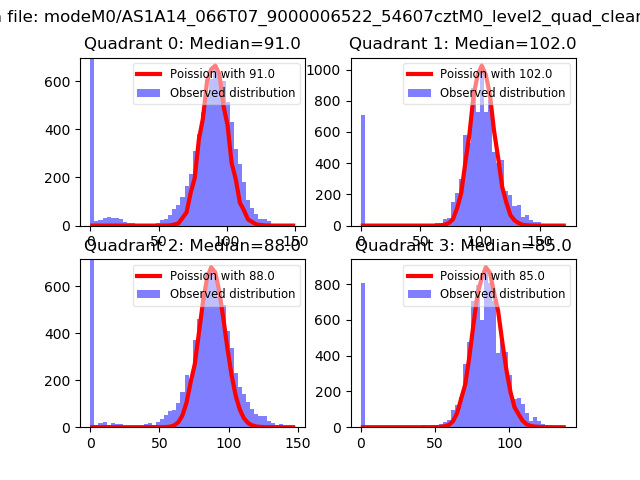 |
 |
| Quadrant-wise count rates Data is divided into 100 sec bins |
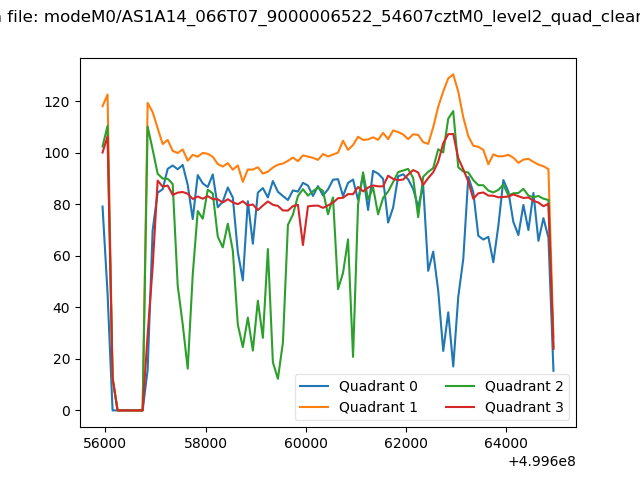 |
|
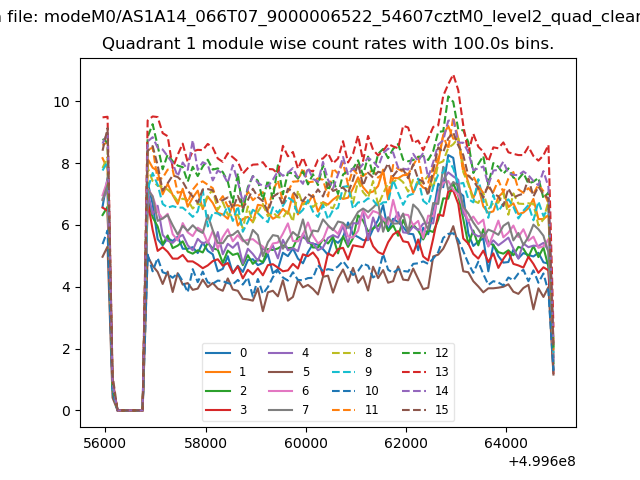
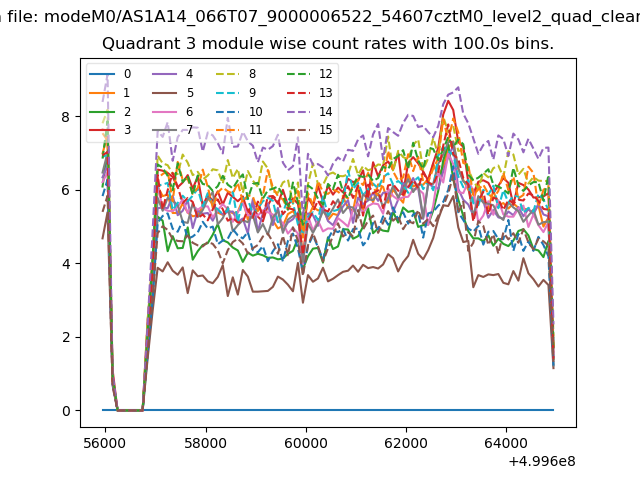
| Module-wise count rates for Quadrant A Data is divided into 100 sec bins |
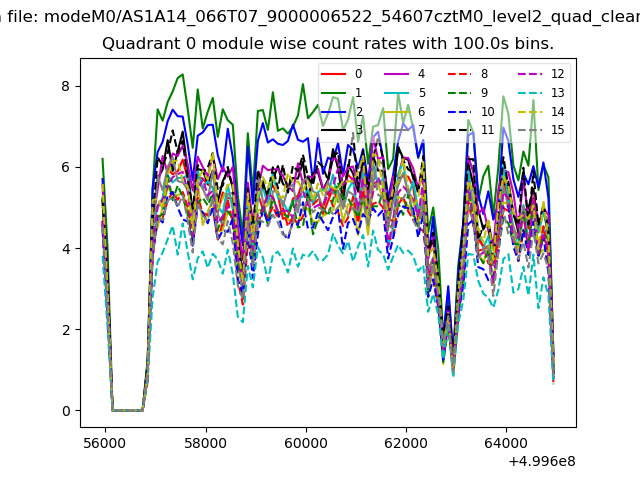 |
 |
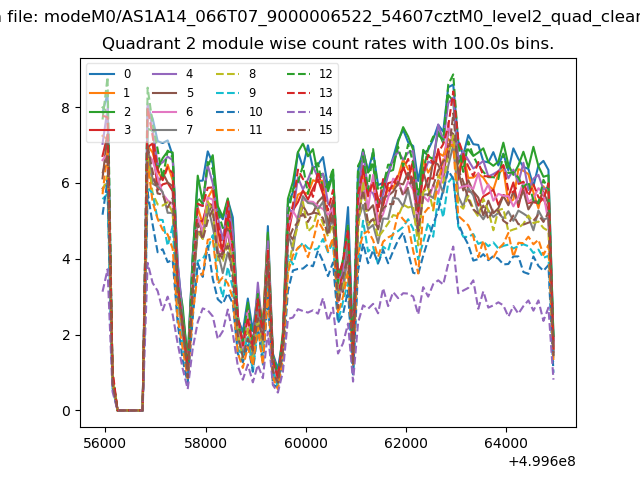
| Module-wise count rates for Quadrant B Data is divided into 100 sec bins |
 |
 |
| Module-wise count rates for Quadrant C Data is divided into 100 sec bins |
 |
 |
| Module-wise count rates for Quadrant D Data is divided into 100 sec bins |
 |
 |
| Parameter | Plot |
|---|---|
| CZT HV Monitor | 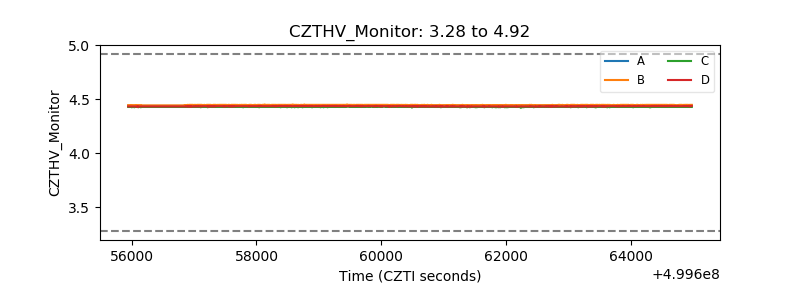 |
| D_VDD | 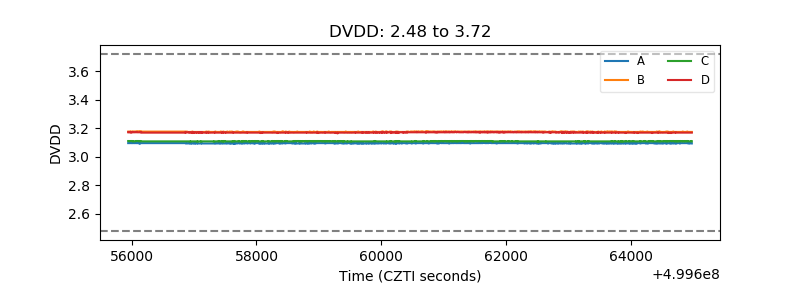 |
| Temperature 1 | 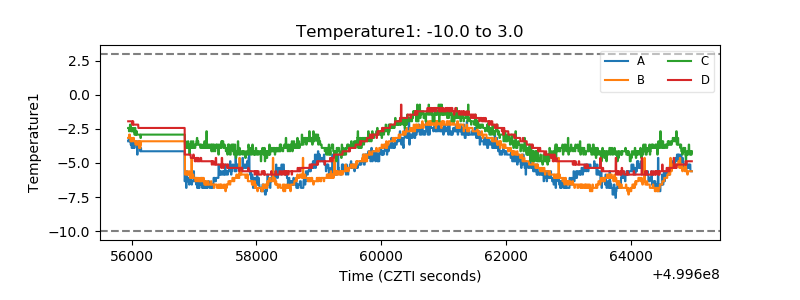 |
| Veto HV Monitor | 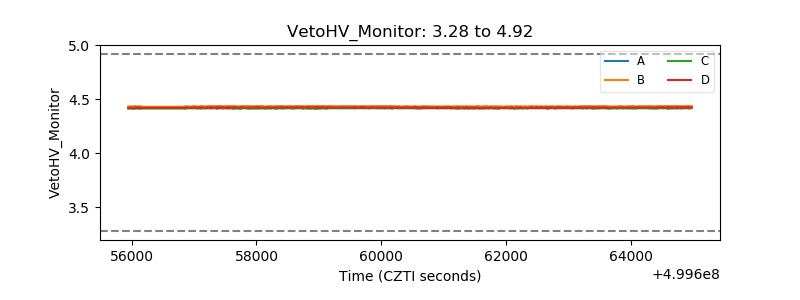 |
| Veto LLD | 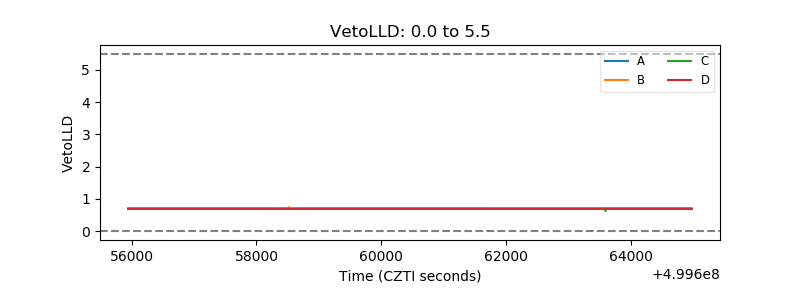 |
| Alpha Counter | 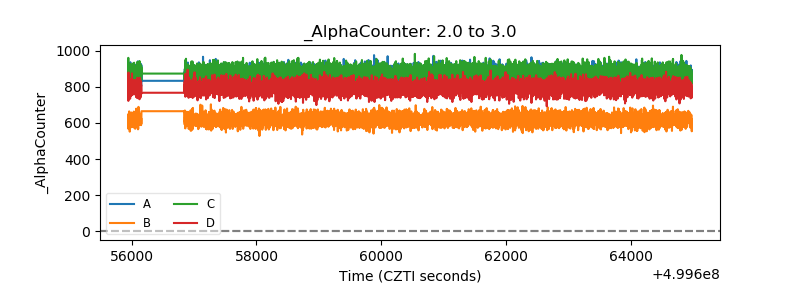 |
| _CPM_Rate | 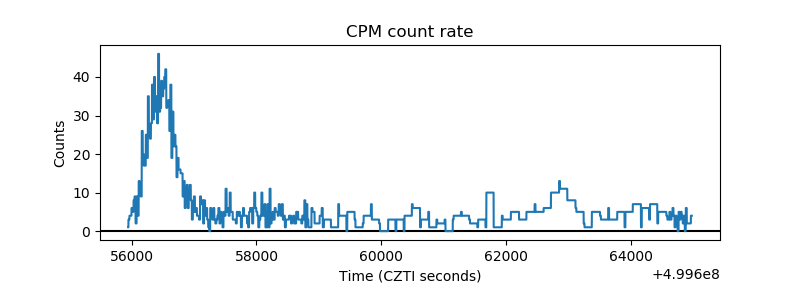 |
| CZT Counter | 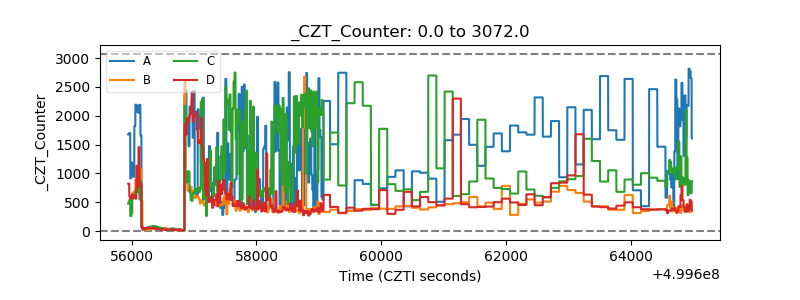 |
| +2.5 Volts monitor | 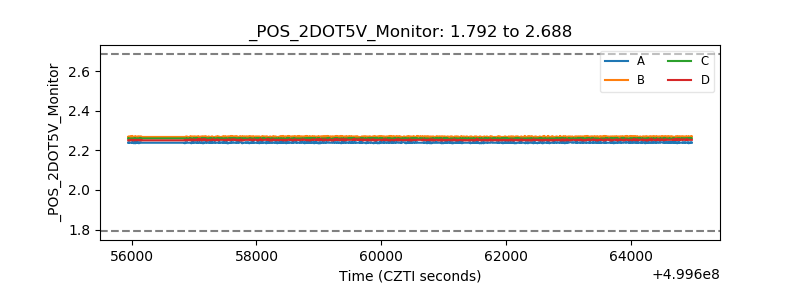 |
| +5 Volts monitor |  |
| _ROLL_ROT | 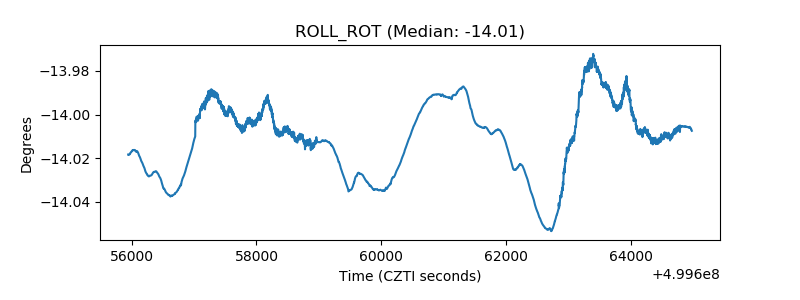 |
| _Roll_DEC | 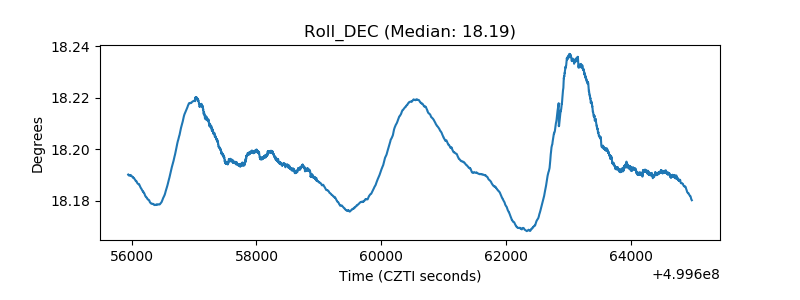 |
| _Roll_RA | 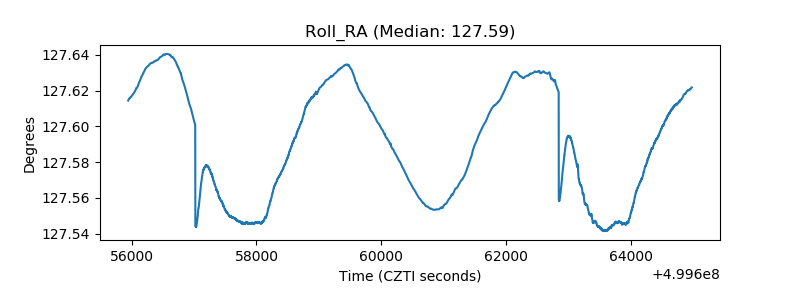 |
| Veto Counter | 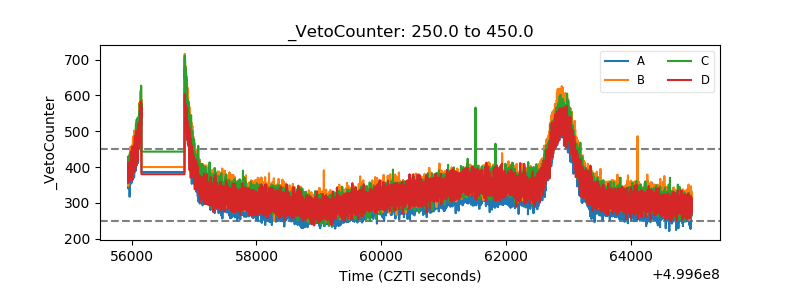 |