| Param | Original file | Final file |
|---|---|---|
| Filename | modeM0/AS1A14_066T07_9000006522_54608cztM0_level2.fits | modeM0/AS1A14_066T07_9000006522_54608cztM0_level2_quad_clean.evt |
| Size (bytes) | 841,167,360 | 112,178,880 |
| Size | 802.2 MB | 107.0 MB |
| Events in quadrant A | 13,648,909 | 570,583 |
| Events in quadrant B | 4,686,343 | 823,544 |
| Events in quadrant C | 7,458,543 | 731,009 |
| Events in quadrant D | 4,700,541 | 693,184 |
| Mode M0 | |||
|---|---|---|---|
| Quadrant | BADHDUFLAG | Total packets | Discarded packets |
| A | 0 | 46282 | 0 |
| B | 0 | 20103 | 0 |
| C | 0 | 28055 | 0 |
| D | 0 | 19969 | 0 |
| Mode SS | |||
|---|---|---|---|
| Quadrant | BADHDUFLAG | Total packets | Discarded packets |
| A | 0 | 166 | 0 |
| B | 0 | 166 | 0 |
| C | 0 | 166 | 0 |
| D | 0 | 166 | 0 |
| Quadrant | Total seconds | Saturated seconds | Saturation percentage |
|---|---|---|---|
| A | 8318 | 3080 | 37.028132% |
| B | 8318 | 252 | 3.029574% |
| C | 8319 | 240 | 2.884962% |
| D | 8319 | 162 | 1.947349% |
Noise dominated data is calculated using 1-second bins in cleaned event files. If a bin has >2000 counts, and if more than 50% of those come from <1% of pixels, then it is considered to be noise-dominated and hence unusable.
| Quadrant | # 1 sec bins | Bins with >0 counts | Bins with >2000 counts | High rate bins dominated by noise | Noise dominated (total time) | Noise dominated (detector-on time) | Marked lightcurve |
|---|---|---|---|---|---|---|---|
| A | 8317 | 8317 | 2780 | 2780 | 33.43% | 33.43% | 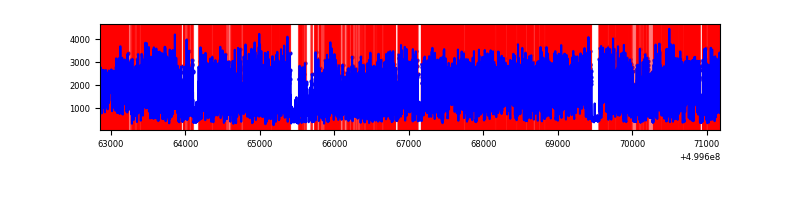 |
| B | 8318 | 8318 | 130 | 130 | 1.56% | 1.56% | 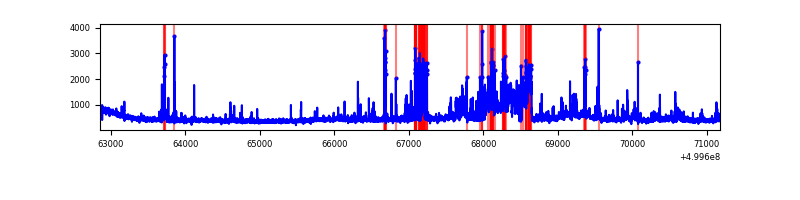 |
| C | 8319 | 8319 | 193 | 193 | 2.32% | 2.32% | 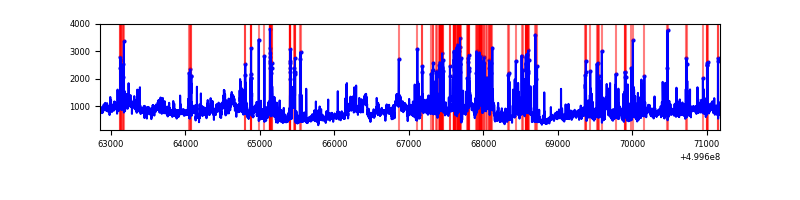 |
| D | 8319 | 8319 | 159 | 159 | 1.91% | 1.91% | 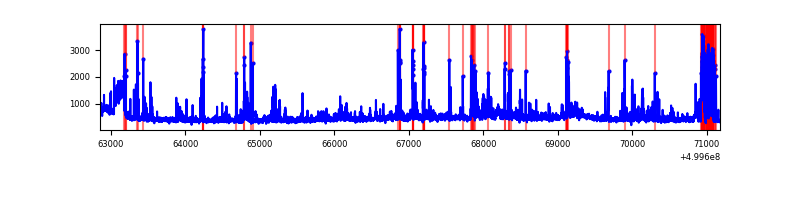 |
Top three noisy pixels from each quadrant. If the there are fewer than three noisy pixels in the level2.evt file, extra rows are filled as -1
| Pixel properties | Quadrant properties | ||||||
|---|---|---|---|---|---|---|---|
| Quadrant | DetID | PixID | Counts | Sigma | Mean | Median | Sigma |
| A | 3 | 14 | 10084380 | 52128.17 | 781 | 762 | 193.4 |
| A | 8 | 62 | 188482 | 970.44 | 781 | 762 | 193.4 |
| A | 11 | 3 | 131116 | 673.88 | 781 | 762 | 193.4 |
| B | 5 | 172 | 826908 | 4319.32 | 884 | 849 | 191.2 |
| B | 1 | 207 | 128103 | 665.39 | 884 | 849 | 191.2 |
| B | 10 | 247 | 127163 | 660.47 | 884 | 849 | 191.2 |
| C | 4 | 5 | 2883685 | 12136.57 | 862 | 856 | 237.5 |
| C | 15 | 147 | 630681 | 2651.53 | 862 | 856 | 237.5 |
| C | 6 | 223 | 141511 | 592.15 | 862 | 856 | 237.5 |
| D | 2 | 172 | 426868 | 1745.3 | 859 | 820 | 244.1 |
| D | 2 | 252 | 308845 | 1261.82 | 859 | 820 | 244.1 |
| D | 8 | 240 | 242490 | 990.0 | 859 | 820 | 244.1 |
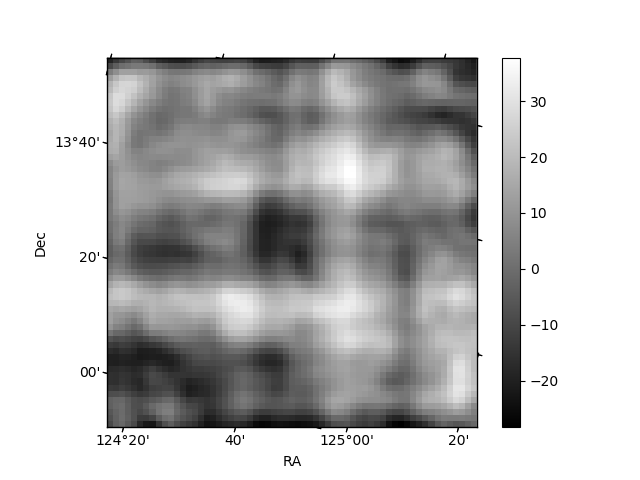
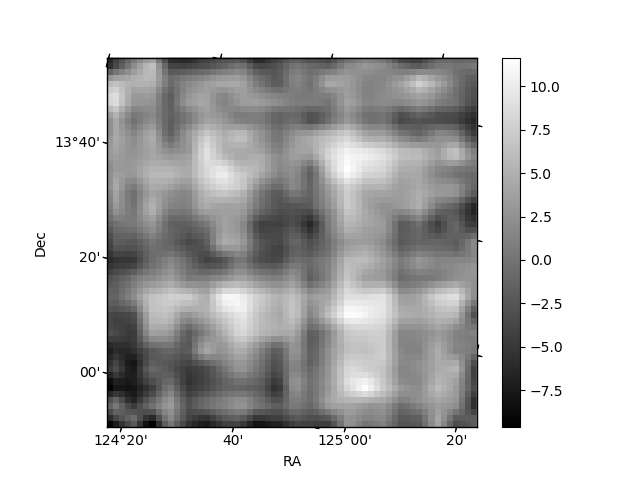
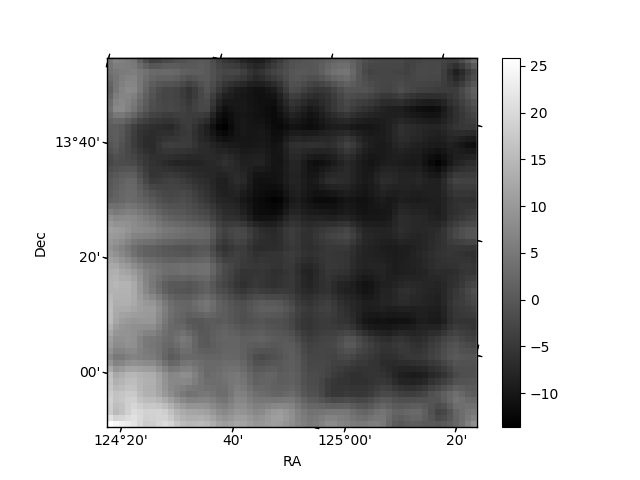
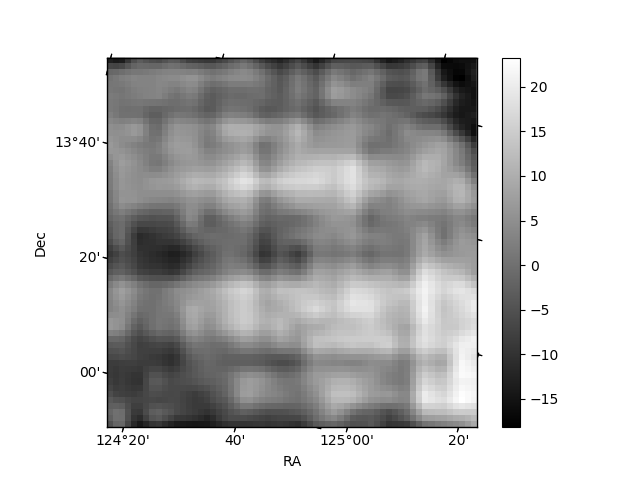
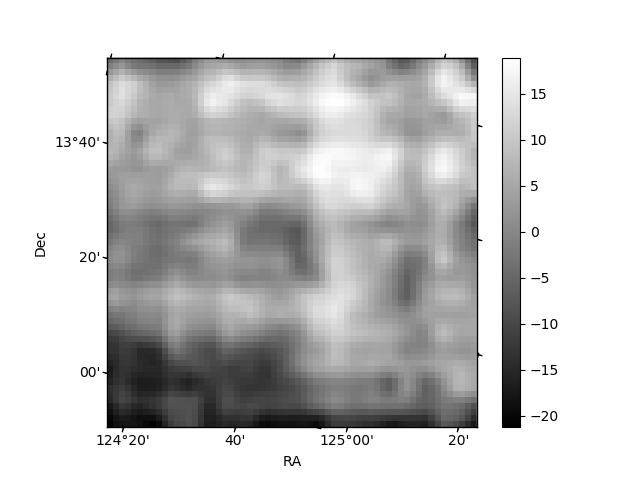
Histogram calculated using DETX and DETY for each event in the final _common_clean file
| Quadrant A | 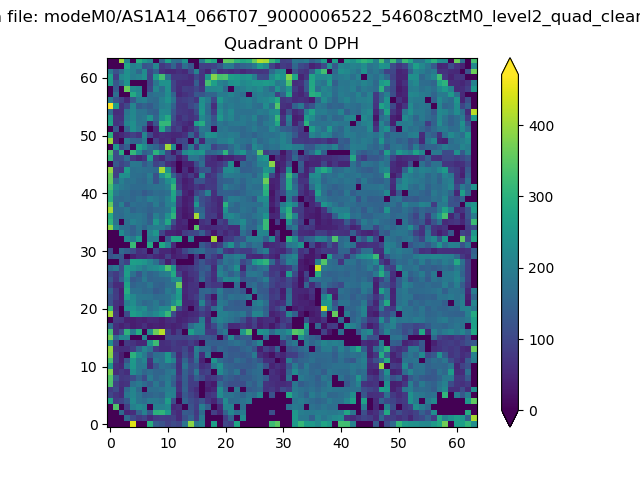 |
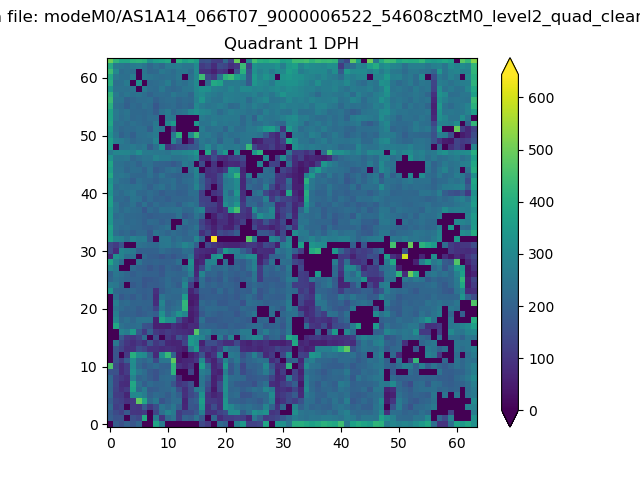 |
Quadrant B |
|---|---|---|---|
| Quadrant D | 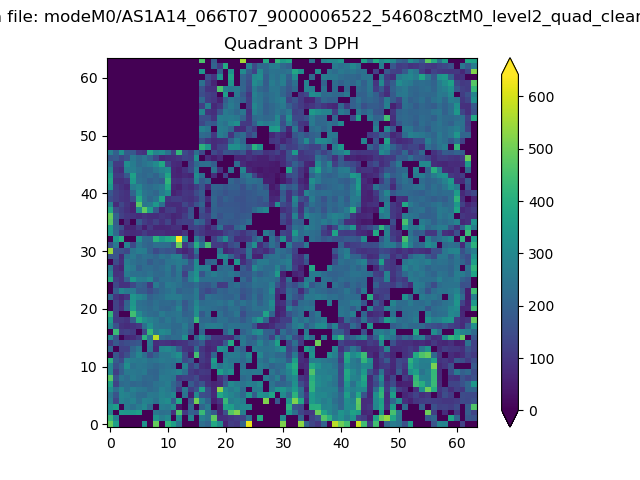 |
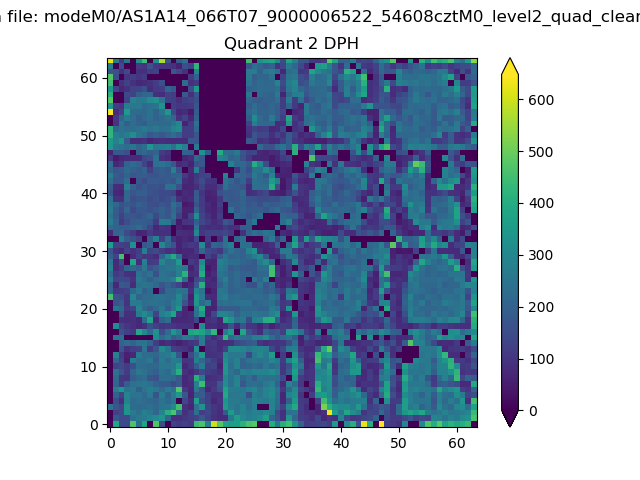 |
Quadrant C |
| Plot type | Count rate plots | Images |
|---|---|---|
| Comparison with Poisson distribution Blue bars denote a histogram of data divided into 1 sec bins. Red curve is a Poisson curve with rate = median count rate of data. |
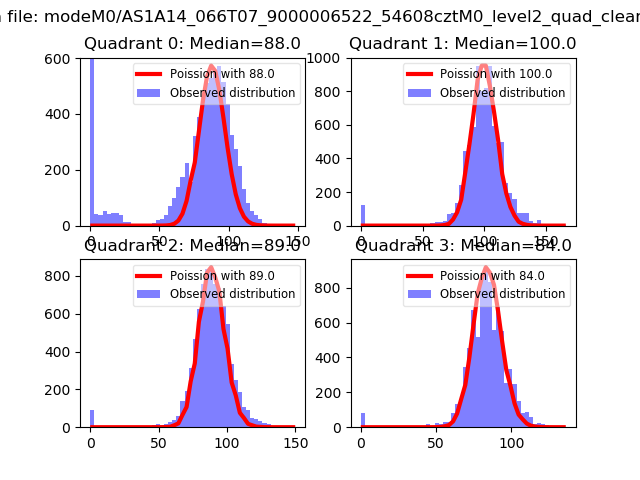 |
 |
| Quadrant-wise count rates Data is divided into 100 sec bins |
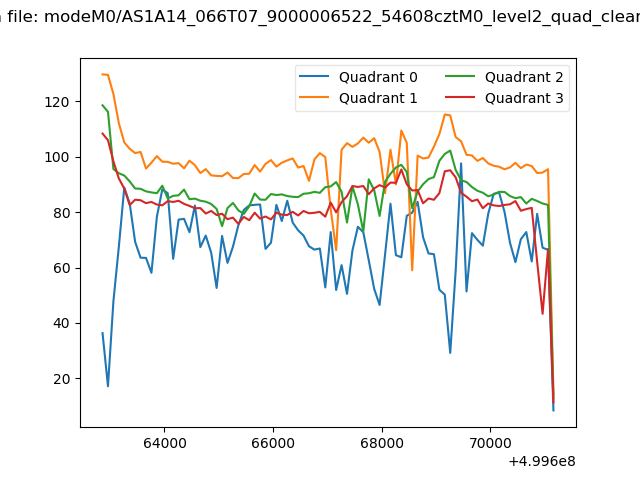 |
|
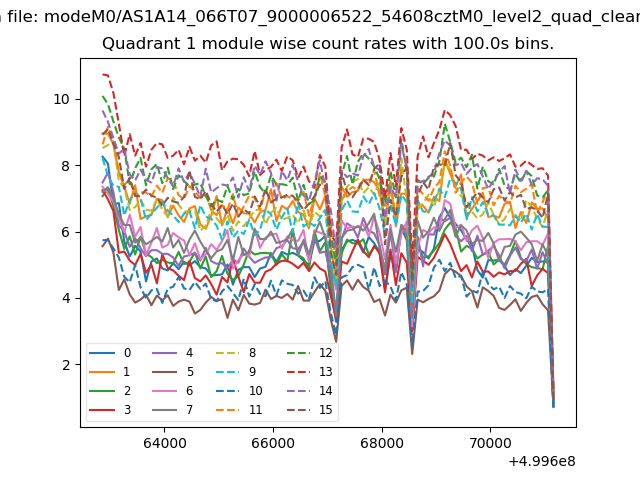
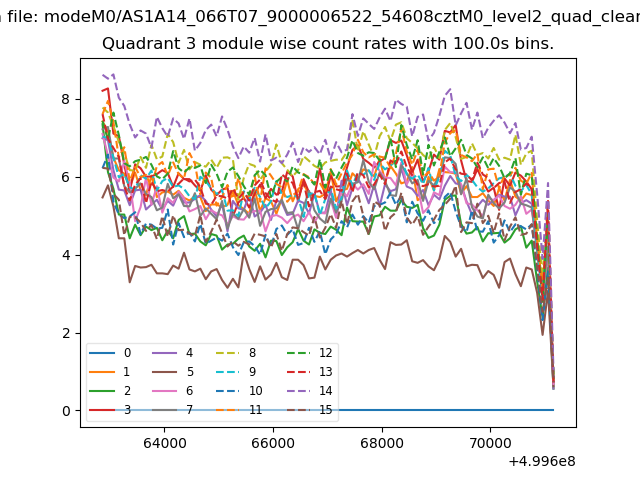
| Module-wise count rates for Quadrant A Data is divided into 100 sec bins |
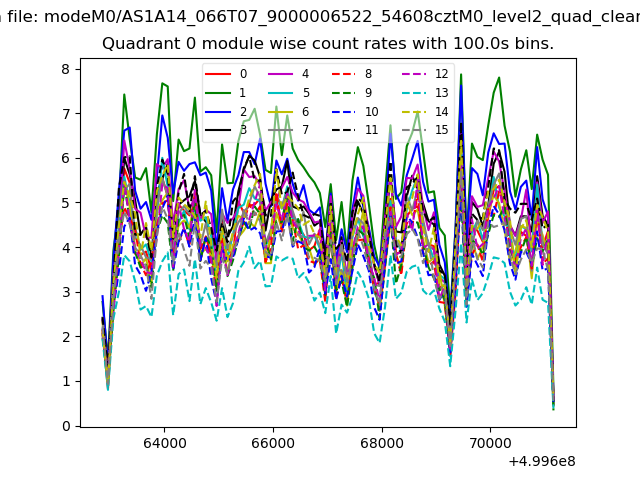 |
 |
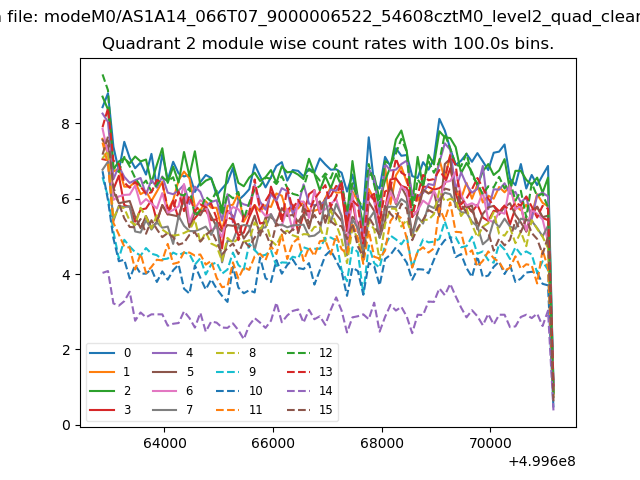
| Module-wise count rates for Quadrant B Data is divided into 100 sec bins |
 |
 |
| Module-wise count rates for Quadrant C Data is divided into 100 sec bins |
 |
 |
| Module-wise count rates for Quadrant D Data is divided into 100 sec bins |
 |
 |
| Parameter | Plot |
|---|---|
| CZT HV Monitor | 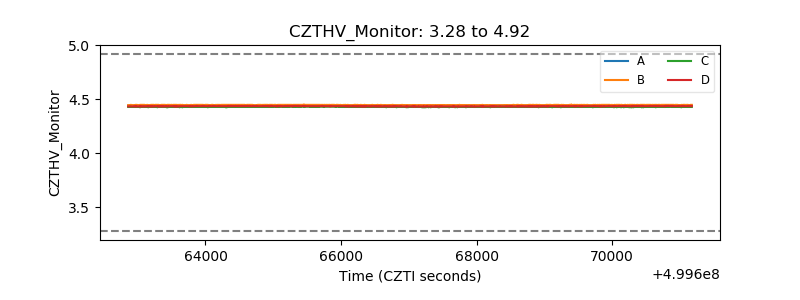 |
| D_VDD | 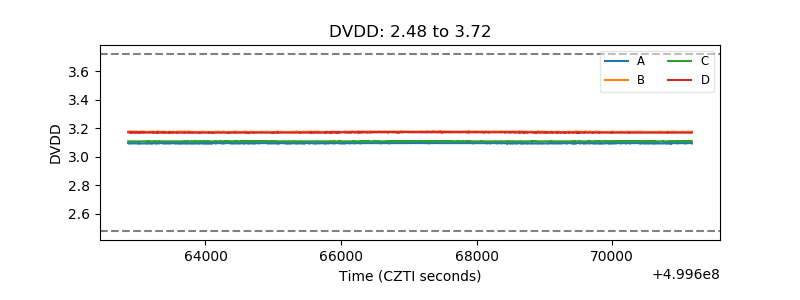 |
| Temperature 1 | 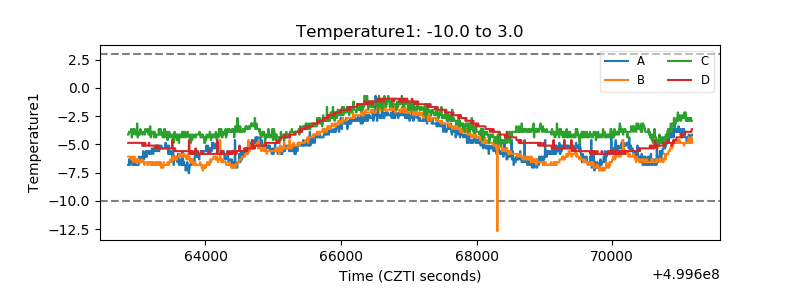 |
| Veto HV Monitor | 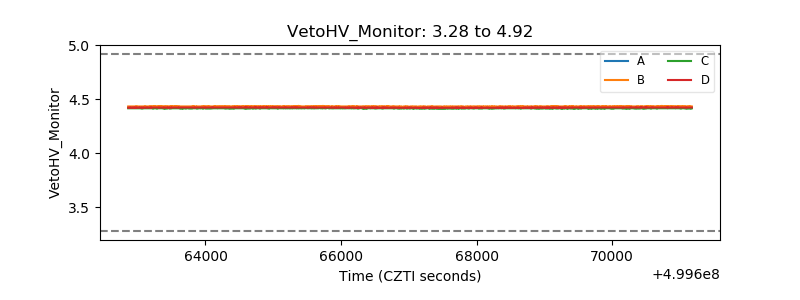 |
| Veto LLD | 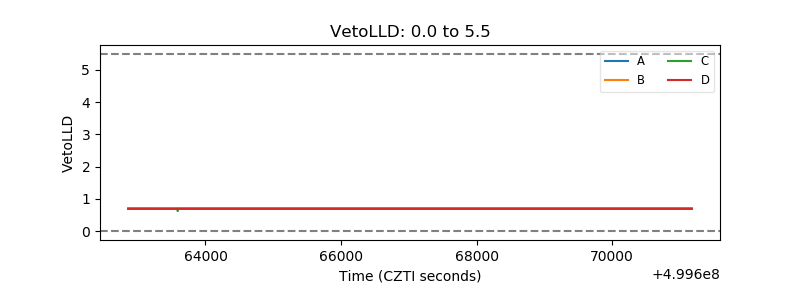 |
| Alpha Counter | 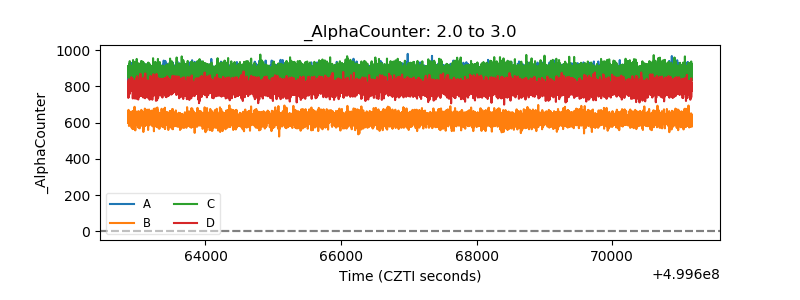 |
| _CPM_Rate | 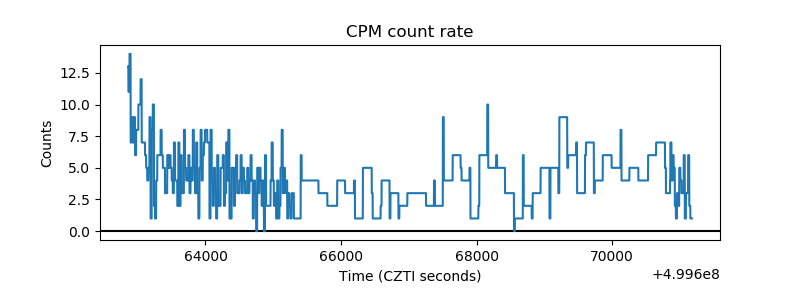 |
| CZT Counter | 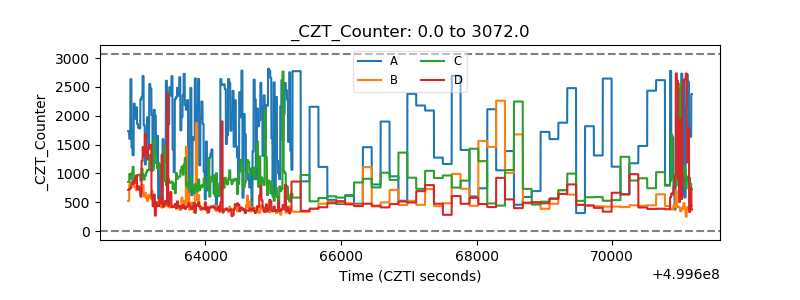 |
| +2.5 Volts monitor |  |
| +5 Volts monitor |  |
| _ROLL_ROT | 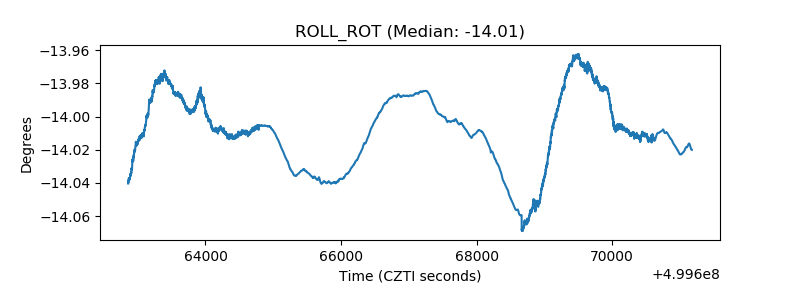 |
| _Roll_DEC | 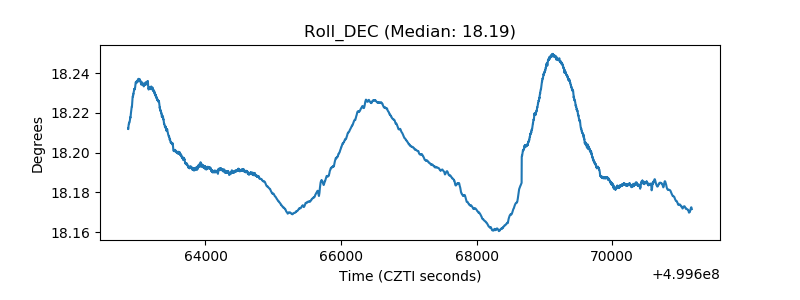 |
| _Roll_RA | 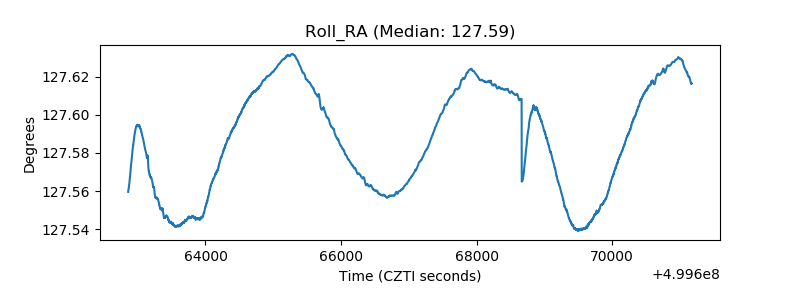 |
| Veto Counter | 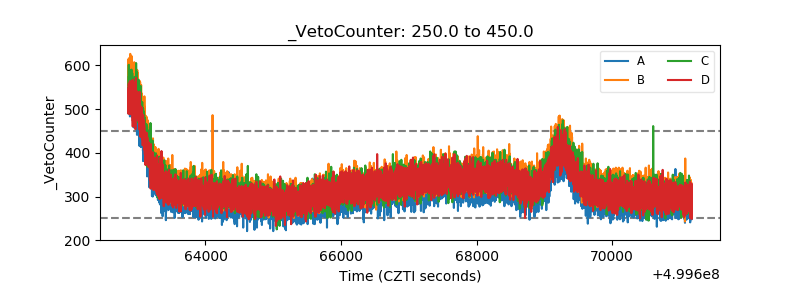 |