| Param | Original file | Final file |
|---|---|---|
| Filename | modeM0/AS1A14_066T07_9000006522_54609cztM0_level2.fits | modeM0/AS1A14_066T07_9000006522_54609cztM0_level2_quad_clean.evt |
| Size (bytes) | 586,074,240 | 96,396,480 |
| Size | 558.9 MB | 91.9 MB |
| Events in quadrant A | 7,437,599 | 595,001 |
| Events in quadrant B | 5,383,865 | 642,789 |
| Events in quadrant C | 4,697,350 | 612,329 |
| Events in quadrant D | 3,632,761 | 580,636 |
| Mode M0 | |||
|---|---|---|---|
| Quadrant | BADHDUFLAG | Total packets | Discarded packets |
| A | 0 | 26902 | 0 |
| B | 0 | 20930 | 0 |
| C | 0 | 18872 | 0 |
| D | 0 | 15681 | 0 |
| Mode SS | |||
|---|---|---|---|
| Quadrant | BADHDUFLAG | Total packets | Discarded packets |
| A | 0 | 140 | 0 |
| B | 0 | 140 | 0 |
| C | 0 | 140 | 0 |
| D | 0 | 140 | 0 |
| Quadrant | Total seconds | Saturated seconds | Saturation percentage |
|---|---|---|---|
| A | 7004 | 996 | 14.220445% |
| B | 7004 | 644 | 9.194746% |
| C | 7004 | 137 | 1.956025% |
| D | 7004 | 108 | 1.541976% |
Noise dominated data is calculated using 1-second bins in cleaned event files. If a bin has >2000 counts, and if more than 50% of those come from <1% of pixels, then it is considered to be noise-dominated and hence unusable.
| Quadrant | # 1 sec bins | Bins with >0 counts | Bins with >2000 counts | High rate bins dominated by noise | Noise dominated (total time) | Noise dominated (detector-on time) | Marked lightcurve |
|---|---|---|---|---|---|---|---|
| A | 7004 | 7004 | 965 | 965 | 13.78% | 13.78% | 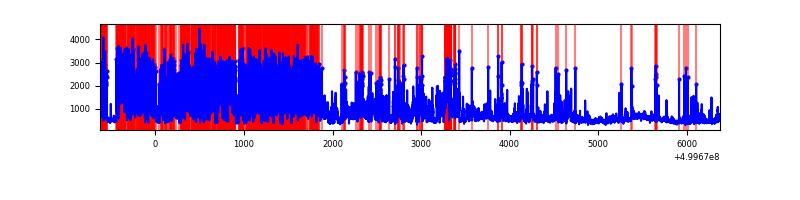 |
| B | 7003 | 7003 | 505 | 505 | 7.21% | 7.21% | 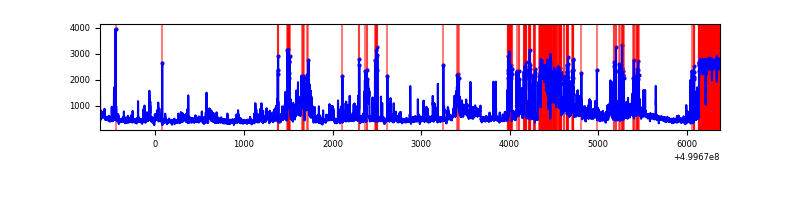 |
| C | 7004 | 7004 | 122 | 122 | 1.74% | 1.74% | 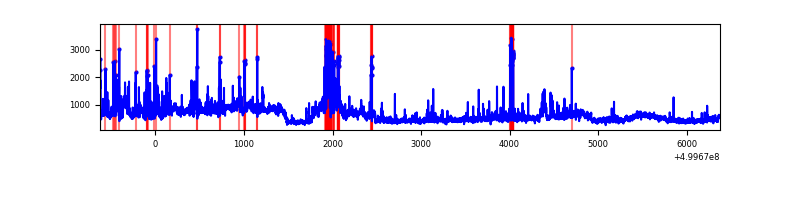 |
| D | 7004 | 7004 | 113 | 113 | 1.61% | 1.61% | 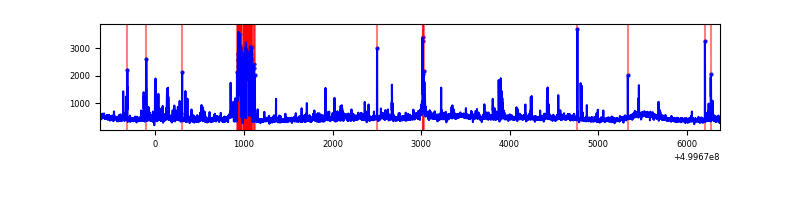 |
Top three noisy pixels from each quadrant. If the there are fewer than three noisy pixels in the level2.evt file, extra rows are filled as -1
| Pixel properties | Quadrant properties | ||||||
|---|---|---|---|---|---|---|---|
| Quadrant | DetID | PixID | Counts | Sigma | Mean | Median | Sigma |
| A | 3 | 14 | 3936707 | 22078.75 | 713 | 693 | 178.3 |
| A | 0 | 8 | 249252 | 1394.27 | 713 | 693 | 178.3 |
| A | 11 | 3 | 247262 | 1383.11 | 713 | 693 | 178.3 |
| B | 5 | 172 | 1908462 | 12402.16 | 709 | 682 | 153.8 |
| B | 1 | 207 | 226165 | 1465.83 | 709 | 682 | 153.8 |
| B | 10 | 28 | 140029 | 905.87 | 709 | 682 | 153.8 |
| C | 4 | 5 | 1152087 | 5899.28 | 715 | 709 | 195.2 |
| C | 6 | 223 | 294308 | 1504.3 | 715 | 709 | 195.2 |
| C | 15 | 147 | 159476 | 813.47 | 715 | 709 | 195.2 |
| D | 2 | 252 | 301941 | 1487.74 | 715 | 683 | 202.5 |
| D | 2 | 172 | 207276 | 1020.24 | 715 | 683 | 202.5 |
| D | 5 | 173 | 60865 | 297.2 | 715 | 683 | 202.5 |
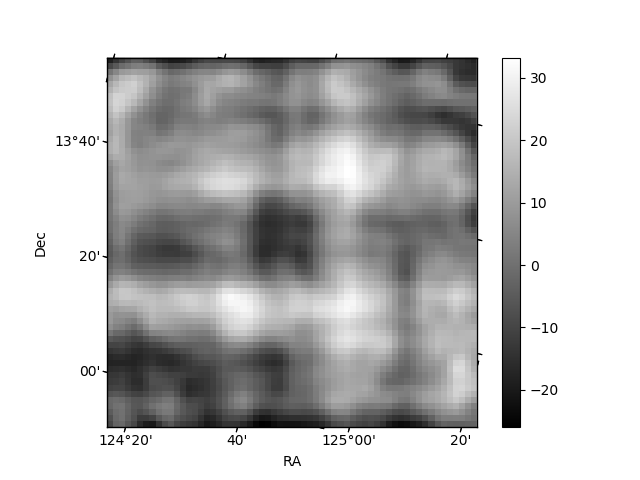
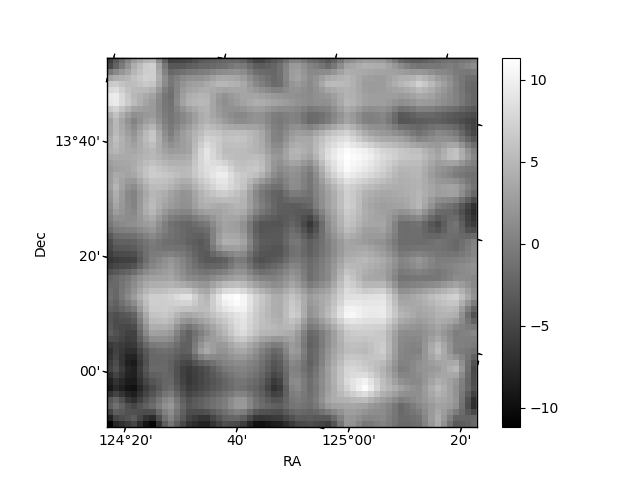
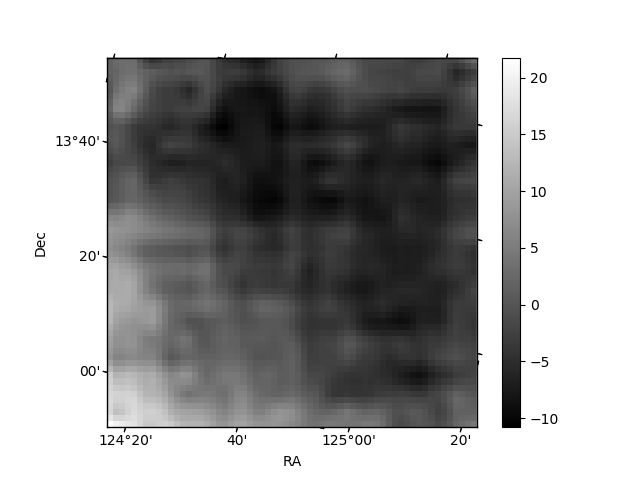
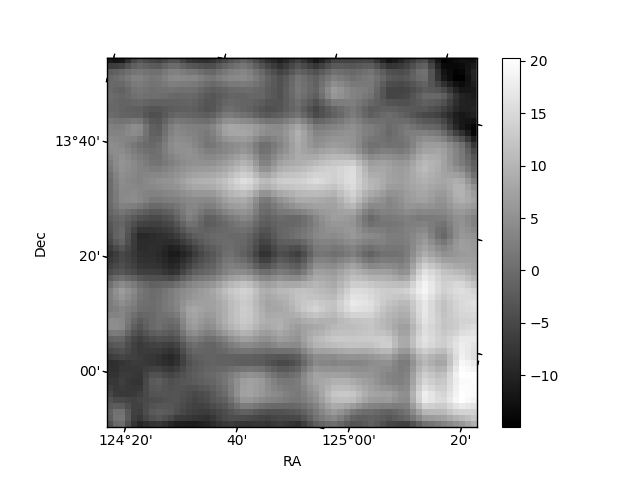
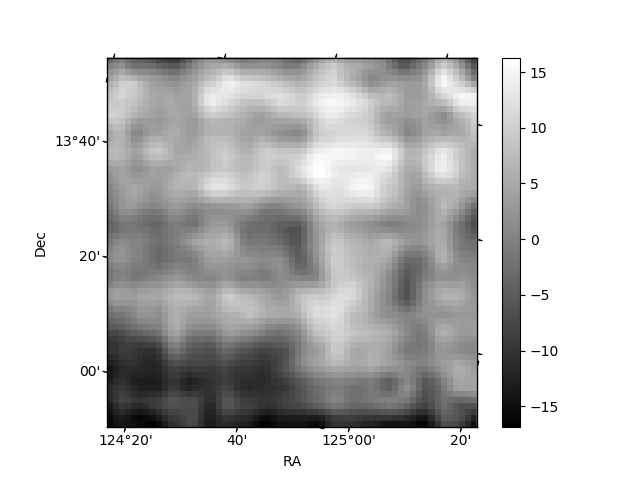
Histogram calculated using DETX and DETY for each event in the final _common_clean file
| Quadrant A | 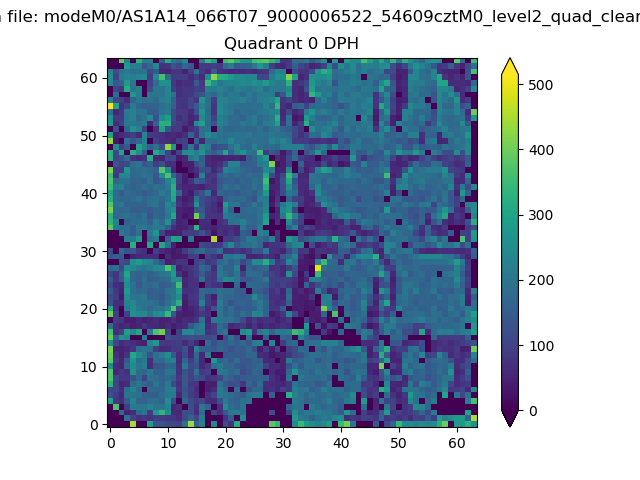 |
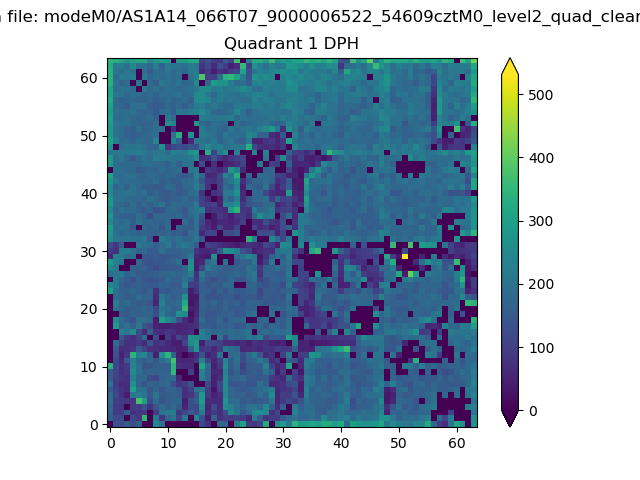 |
Quadrant B |
|---|---|---|---|
| Quadrant D | 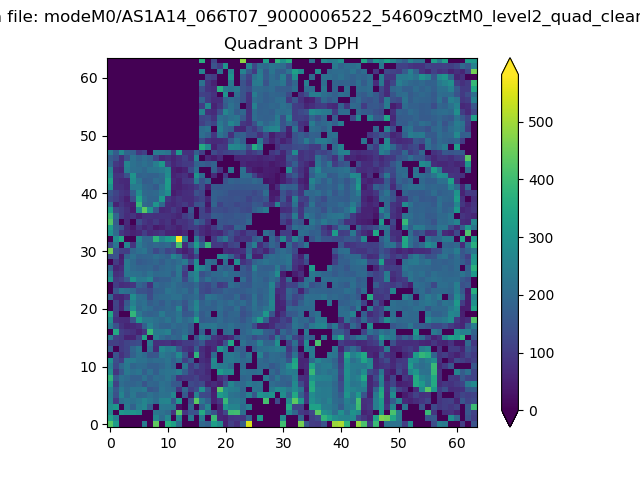 |
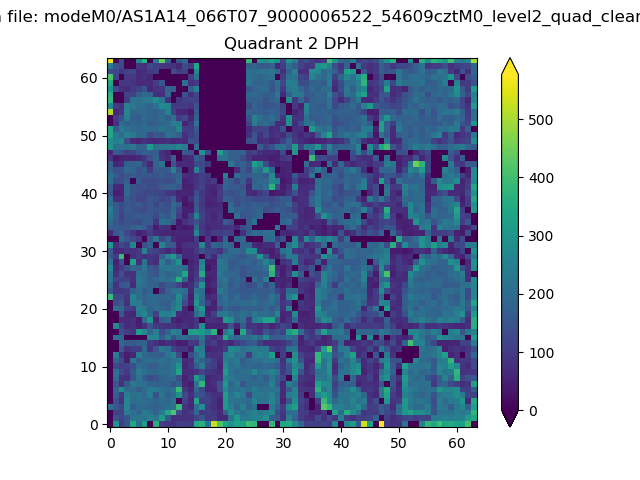 |
Quadrant C |
| Plot type | Count rate plots | Images |
|---|---|---|
| Comparison with Poisson distribution Blue bars denote a histogram of data divided into 1 sec bins. Red curve is a Poisson curve with rate = median count rate of data. |
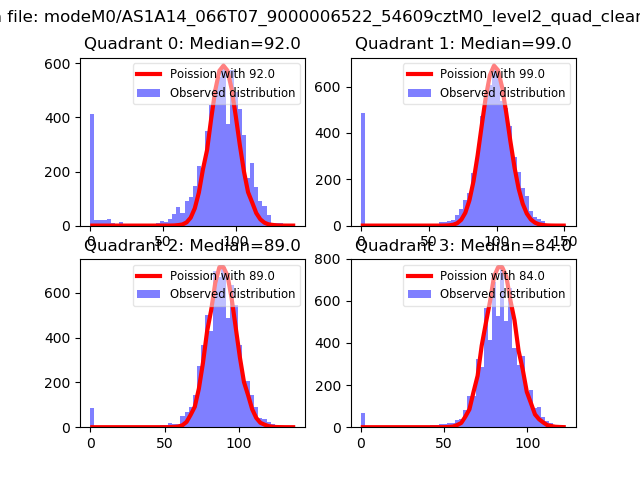 |
 |
| Quadrant-wise count rates Data is divided into 100 sec bins |
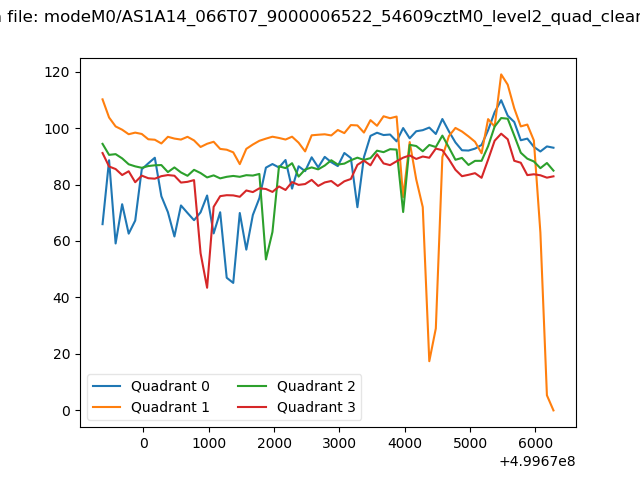 |
|
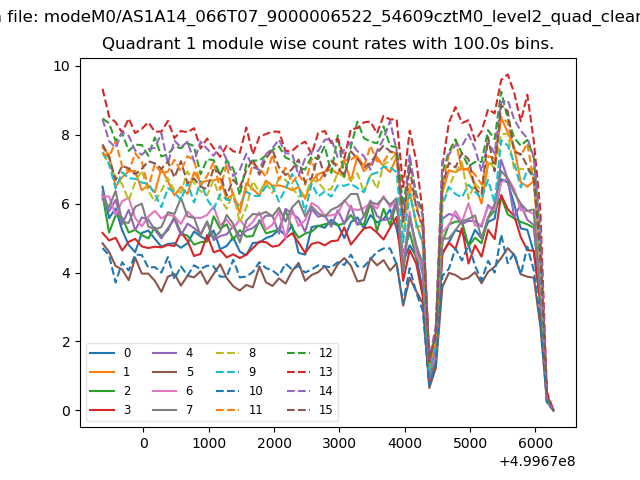
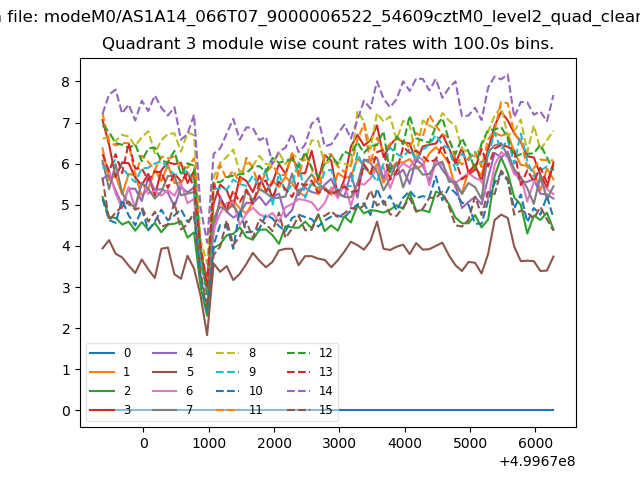
| Module-wise count rates for Quadrant A Data is divided into 100 sec bins |
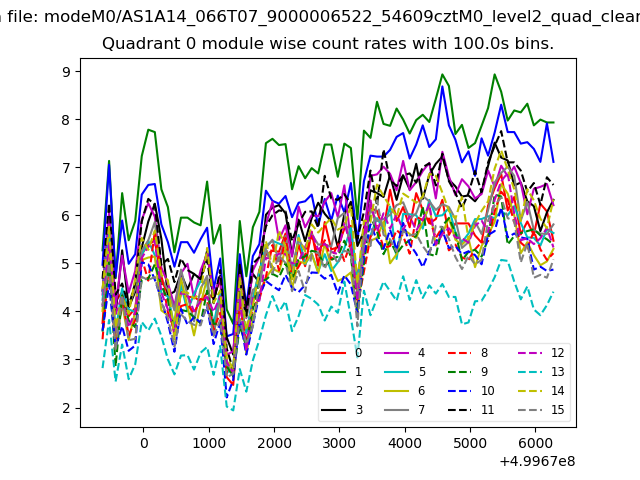 |
 |
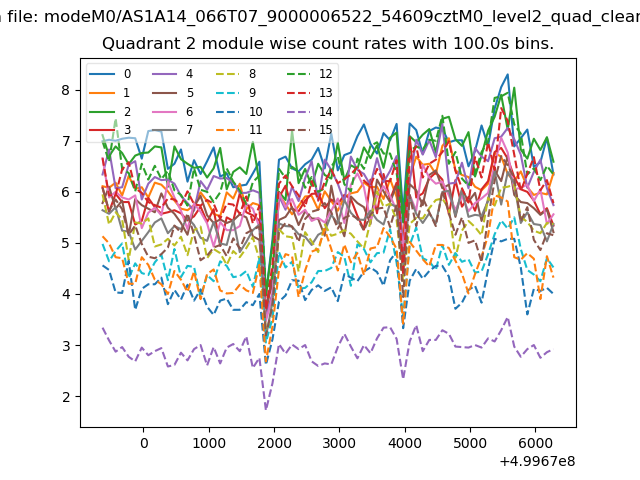
| Module-wise count rates for Quadrant B Data is divided into 100 sec bins |
 |
 |
| Module-wise count rates for Quadrant C Data is divided into 100 sec bins |
 |
 |
| Module-wise count rates for Quadrant D Data is divided into 100 sec bins |
 |
 |
| Parameter | Plot |
|---|---|
| CZT HV Monitor | 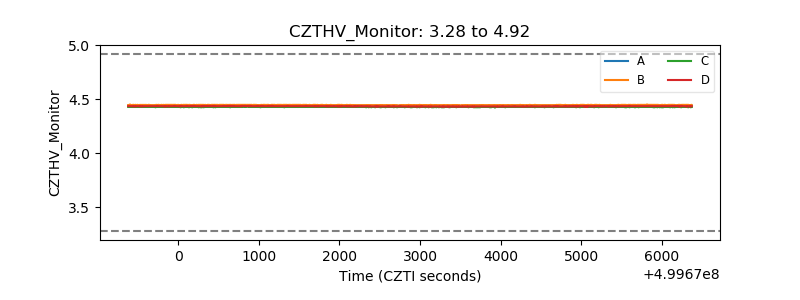 |
| D_VDD | 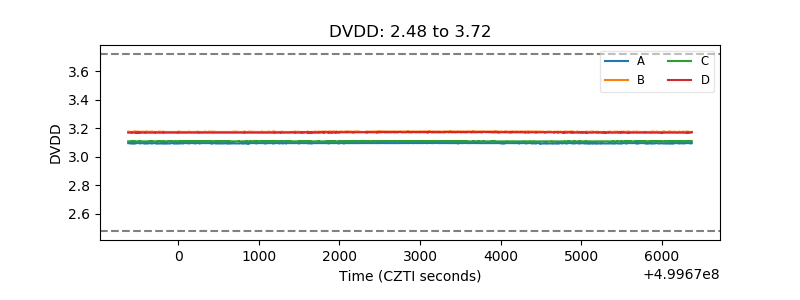 |
| Temperature 1 |  |
| Veto HV Monitor | 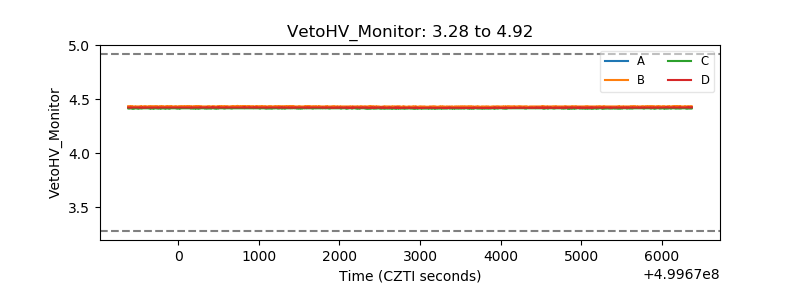 |
| Veto LLD | 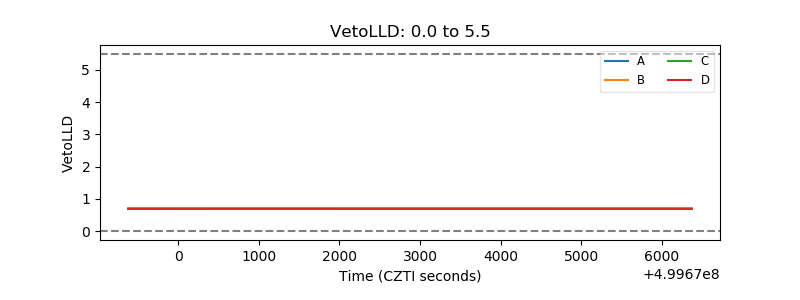 |
| Alpha Counter | 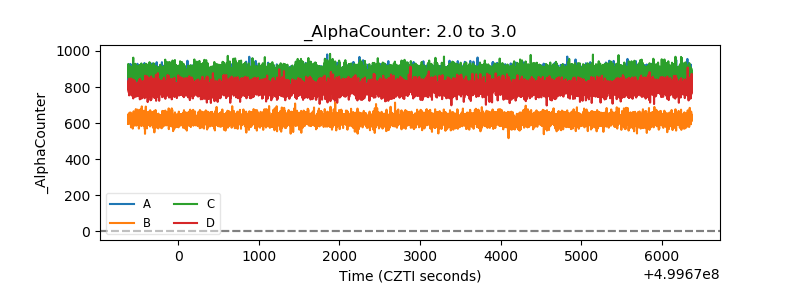 |
| _CPM_Rate | 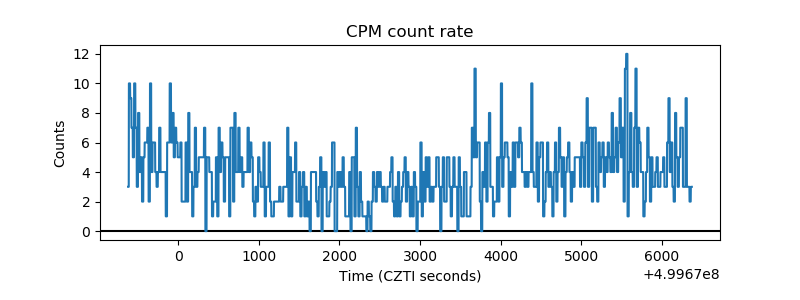 |
| CZT Counter | 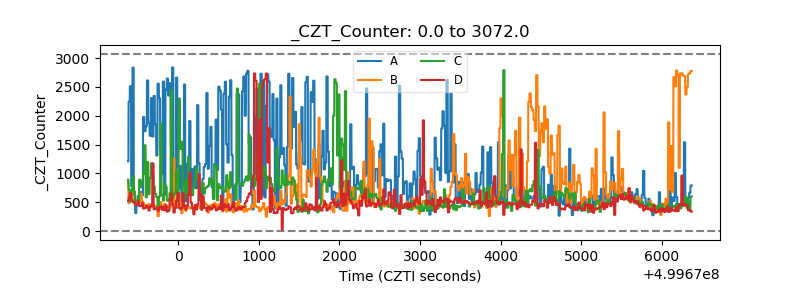 |
| +2.5 Volts monitor | 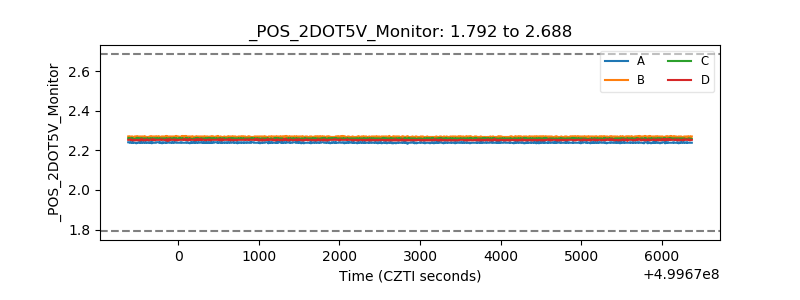 |
| +5 Volts monitor |  |
| _ROLL_ROT | 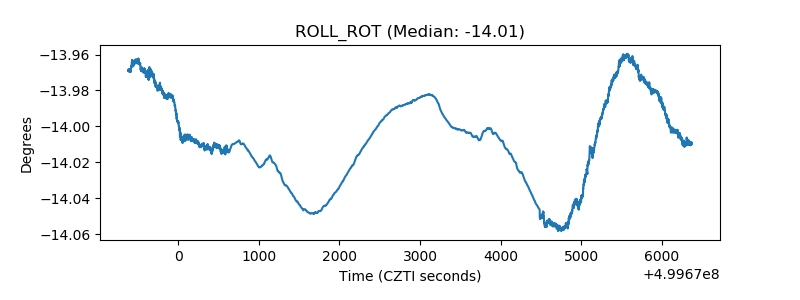 |
| _Roll_DEC | 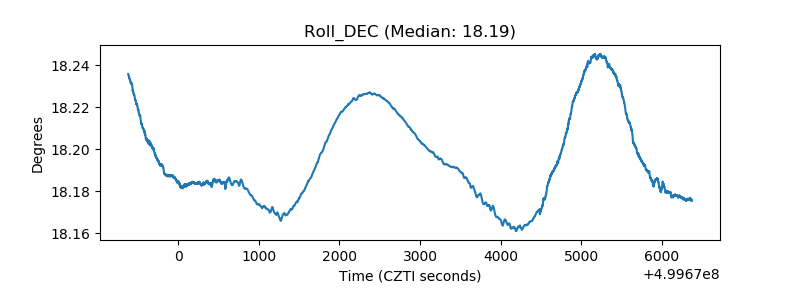 |
| _Roll_RA | 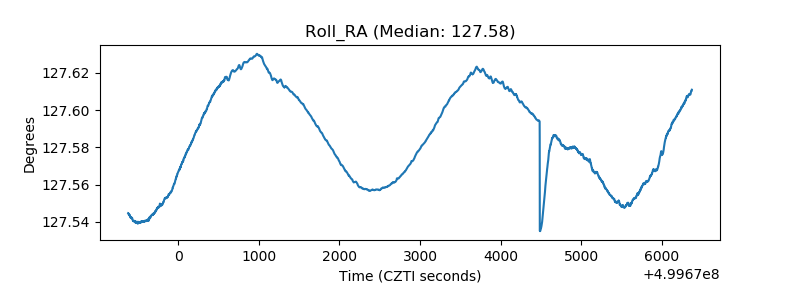 |
| Veto Counter | 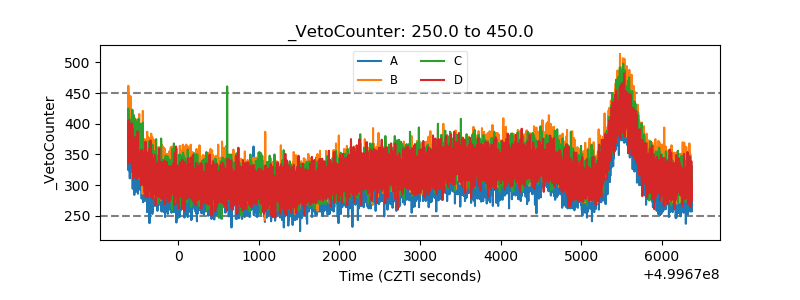 |