| Param | Original file | Final file |
|---|---|---|
| Filename | modeM0/AS1A14_066T07_9000006522_54612cztM0_level2.fits | modeM0/AS1A14_066T07_9000006522_54612cztM0_level2_quad_clean.evt |
| Size (bytes) | 1,482,793,920 | 271,961,280 |
| Size | 1.4 GB | 259.4 MB |
| Events in quadrant A | 15,195,213 | 1,778,840 |
| Events in quadrant B | 17,015,224 | 1,675,017 |
| Events in quadrant C | 10,185,710 | 1,753,247 |
| Events in quadrant D | 10,935,728 | 1,640,786 |
| Mode M9 | |||
|---|---|---|---|
| Quadrant | BADHDUFLAG | Total packets | Discarded packets |
| A | 0 | 10 | 0 |
| B | 0 | 10 | 0 |
| C | 0 | 10 | 0 |
| D | 0 | 10 | 0 |
| Mode M0 | |||
|---|---|---|---|
| Quadrant | BADHDUFLAG | Total packets | Discarded packets |
| A | 0 | 59062 | 3 |
| B | 0 | 64699 | 4 |
| C | 0 | 44417 | 3 |
| D | 0 | 47077 | 3 |
| Mode SS | |||
|---|---|---|---|
| Quadrant | BADHDUFLAG | Total packets | Discarded packets |
| A | 0 | 408 | 0 |
| B | 0 | 408 | 0 |
| C | 0 | 408 | 0 |
| D | 0 | 408 | 0 |
| Quadrant | Total seconds | Saturated seconds | Saturation percentage |
|---|---|---|---|
| A | 20118 | 1232 | 6.123869% |
| B | 20117 | 3163 | 15.723020% |
| C | 20117 | 368 | 1.829299% |
| D | 20117 | 485 | 2.410896% |
Noise dominated data is calculated using 1-second bins in cleaned event files. If a bin has >2000 counts, and if more than 50% of those come from <1% of pixels, then it is considered to be noise-dominated and hence unusable.
| Quadrant | # 1 sec bins | Bins with >0 counts | Bins with >2000 counts | High rate bins dominated by noise | Noise dominated (total time) | Noise dominated (detector-on time) | Marked lightcurve |
|---|---|---|---|---|---|---|---|
| A | 21193 | 20119 | 699 | 699 | 3.30% | 3.47% | 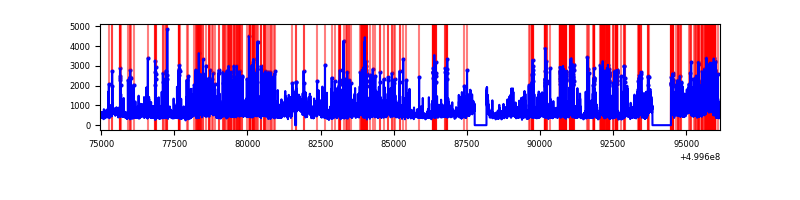 |
| B | 21192 | 20118 | 2343 | 2343 | 11.06% | 11.65% | 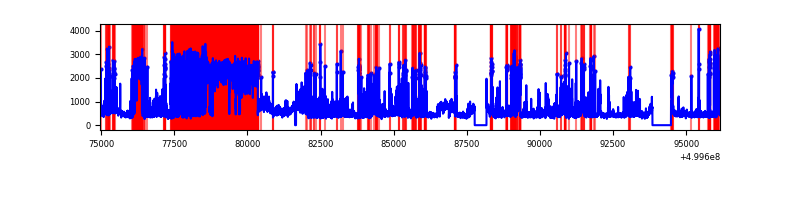 |
| C | 21192 | 20118 | 80 | 80 | 0.38% | 0.40% | 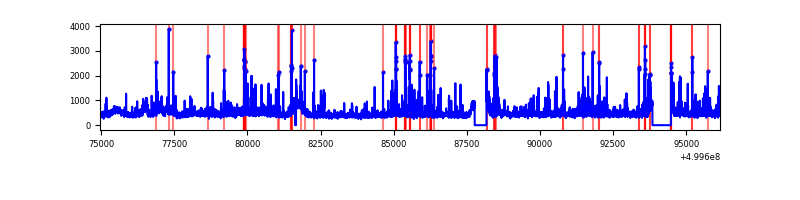 |
| D | 21192 | 20118 | 220 | 220 | 1.04% | 1.09% | 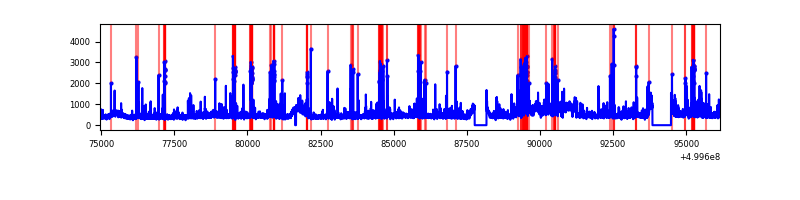 |
Top three noisy pixels from each quadrant. If the there are fewer than three noisy pixels in the level2.evt file, extra rows are filled as -1
| Pixel properties | Quadrant properties | ||||||
|---|---|---|---|---|---|---|---|
| Quadrant | DetID | PixID | Counts | Sigma | Mean | Median | Sigma |
| A | 3 | 14 | 4611074 | 8632.19 | 2162 | 2107 | 533.9 |
| A | 11 | 3 | 777193 | 1451.67 | 2162 | 2107 | 533.9 |
| A | 0 | 8 | 572278 | 1067.88 | 2162 | 2107 | 533.9 |
| B | 5 | 172 | 7555753 | 17476.63 | 2014 | 1940 | 432.2 |
| B | 10 | 28 | 691703 | 1595.85 | 2014 | 1940 | 432.2 |
| B | 1 | 207 | 412104 | 948.96 | 2014 | 1940 | 432.2 |
| C | 4 | 5 | 559793 | 962.31 | 2134 | 2120 | 579.5 |
| C | 6 | 223 | 252306 | 431.72 | 2134 | 2120 | 579.5 |
| C | 12 | 252 | 194636 | 332.2 | 2134 | 2120 | 579.5 |
| D | 2 | 62 | 734751 | 1213.64 | 2139 | 2048 | 603.7 |
| D | 2 | 207 | 239843 | 393.88 | 2139 | 2048 | 603.7 |
| D | 3 | 144 | 239813 | 393.83 | 2139 | 2048 | 603.7 |
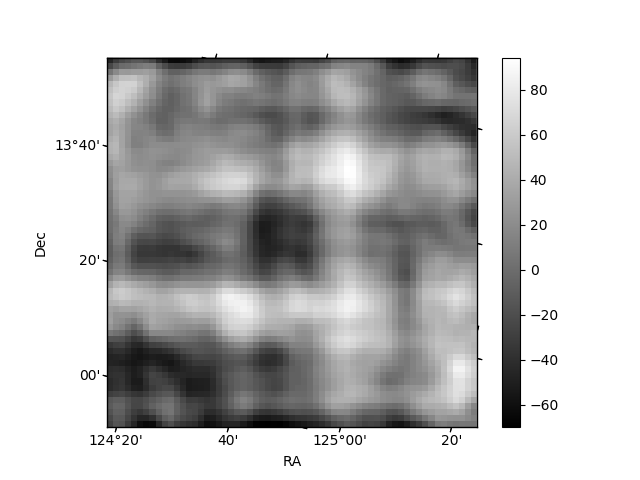
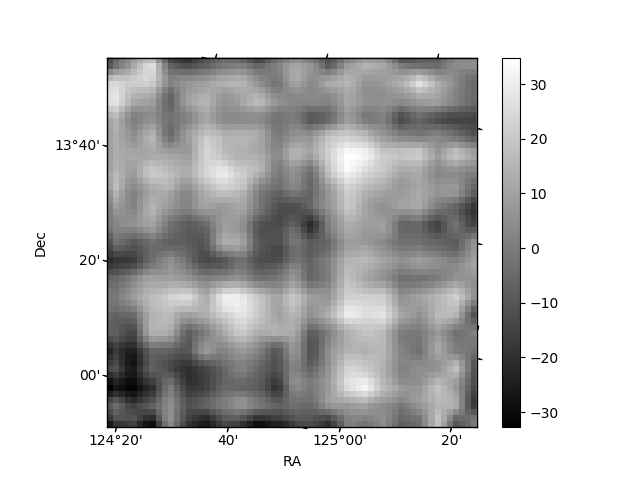
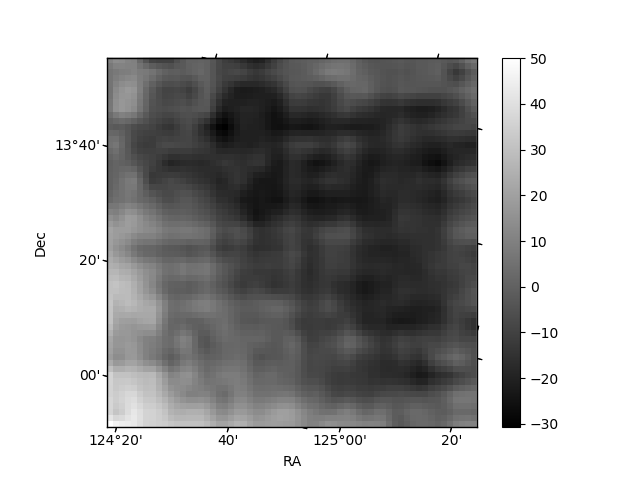
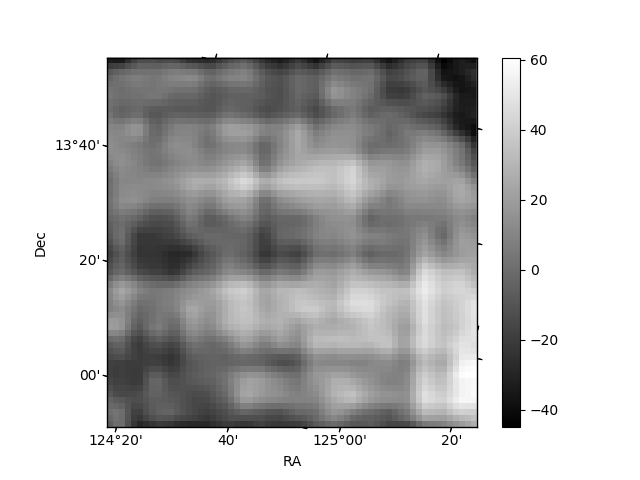
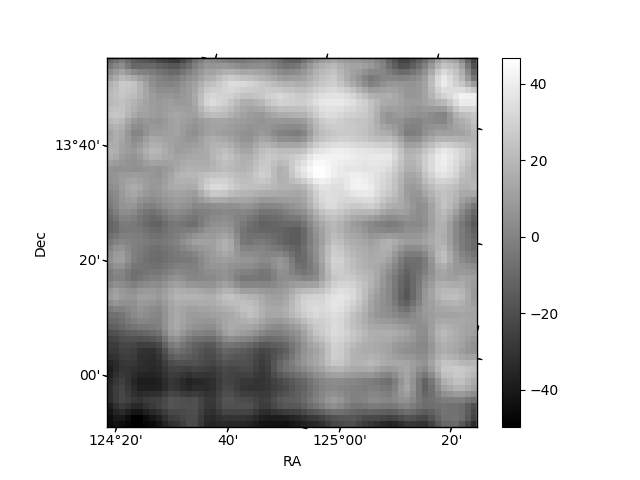
Histogram calculated using DETX and DETY for each event in the final _common_clean file
| Quadrant A | 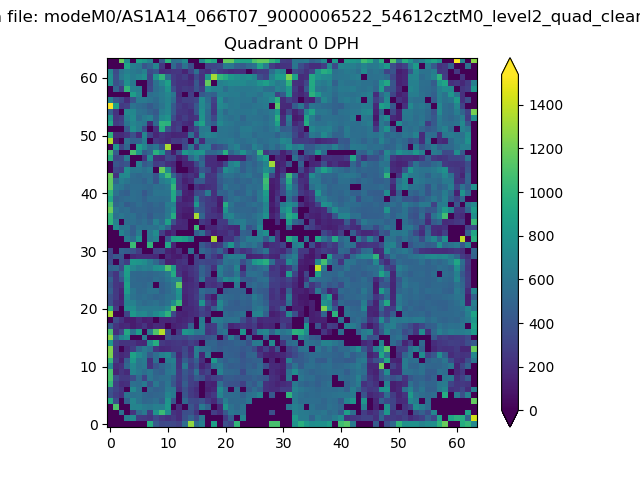 |
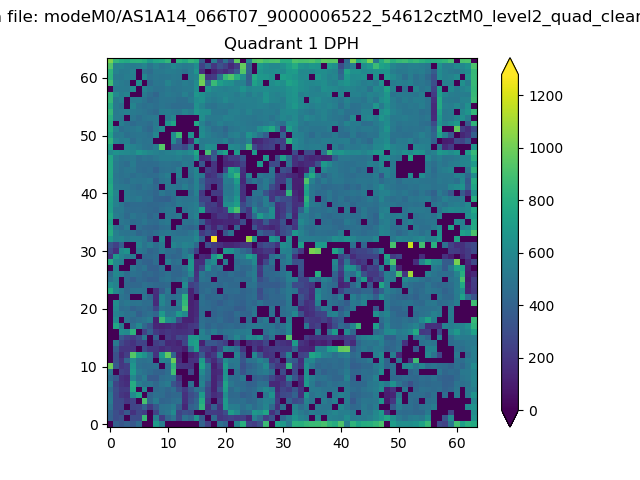 |
Quadrant B |
|---|---|---|---|
| Quadrant D | 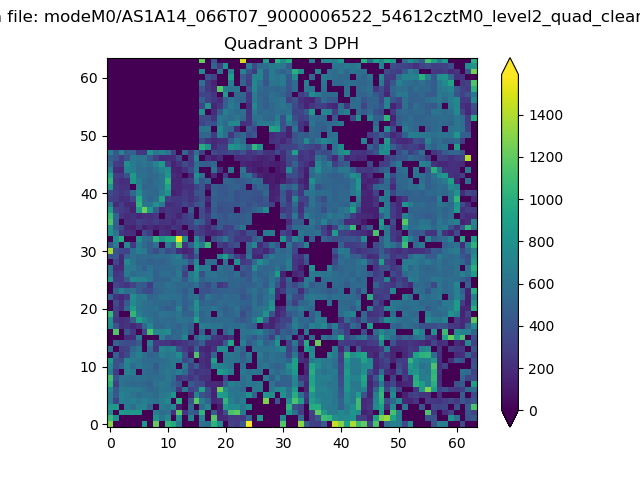 |
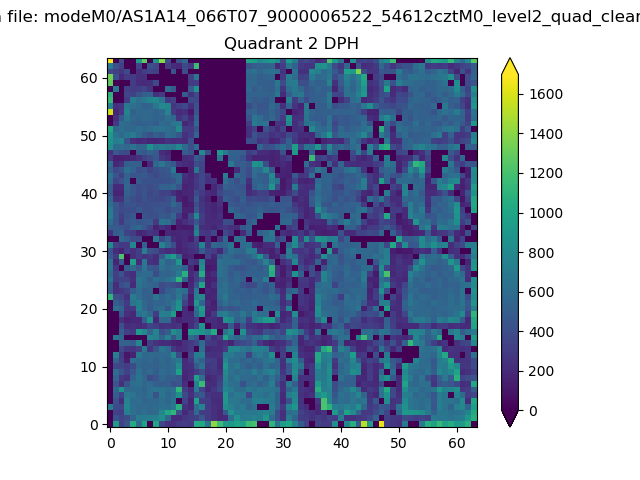 |
Quadrant C |
| Plot type | Count rate plots | Images |
|---|---|---|
| Comparison with Poisson distribution Blue bars denote a histogram of data divided into 1 sec bins. Red curve is a Poisson curve with rate = median count rate of data. |
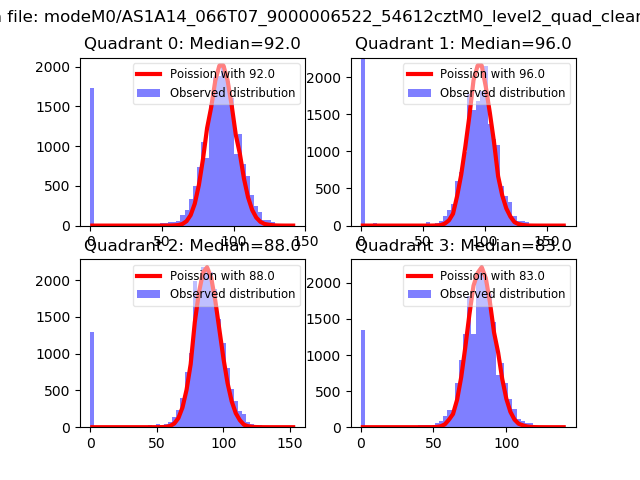 |
 |
| Quadrant-wise count rates Data is divided into 100 sec bins |
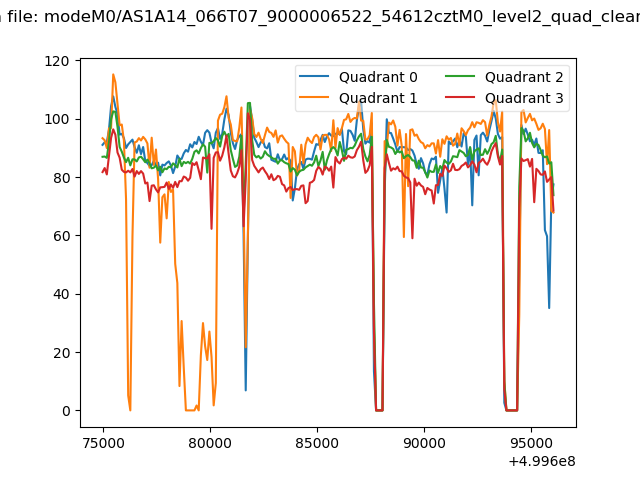 |
|
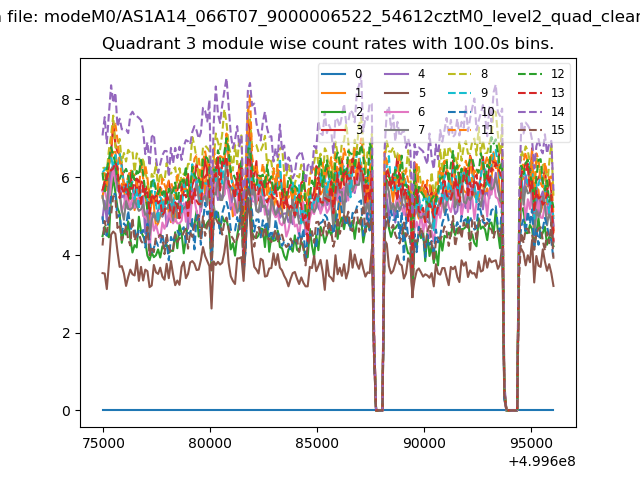
| Module-wise count rates for Quadrant A Data is divided into 100 sec bins |
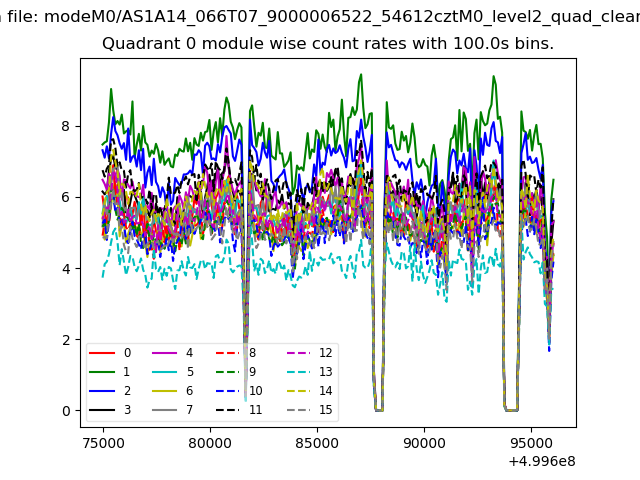 |
 |
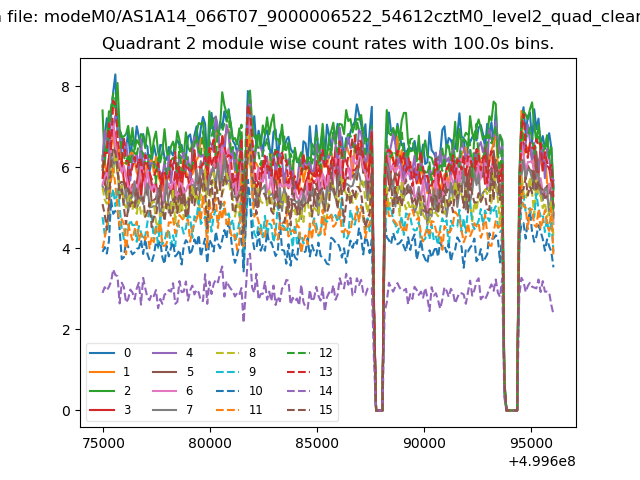
| Module-wise count rates for Quadrant B Data is divided into 100 sec bins |
 |
 |
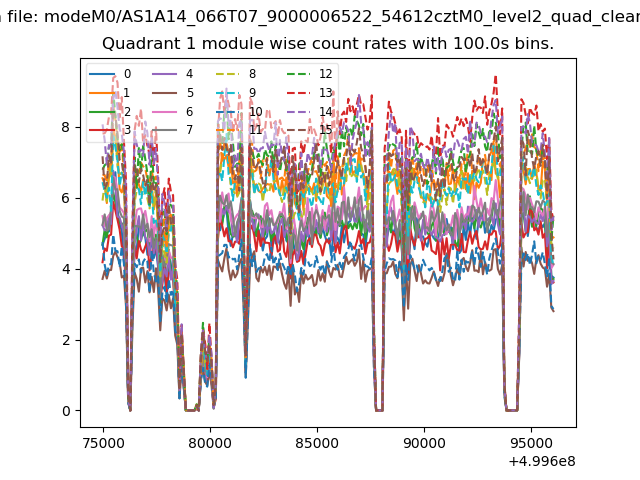
| Module-wise count rates for Quadrant C Data is divided into 100 sec bins |
 |
 |
| Module-wise count rates for Quadrant D Data is divided into 100 sec bins |
 |
 |
| Parameter | Plot |
|---|---|
| CZT HV Monitor |  |
| D_VDD | 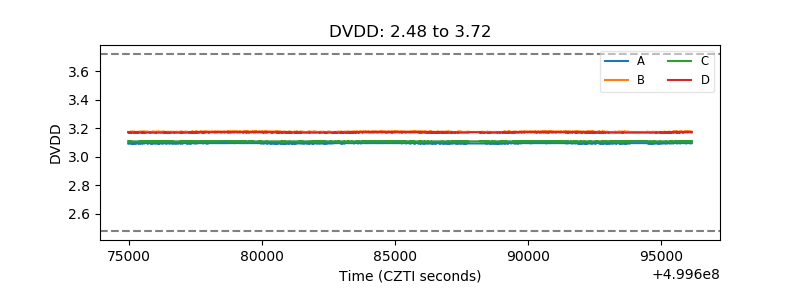 |
| Temperature 1 | 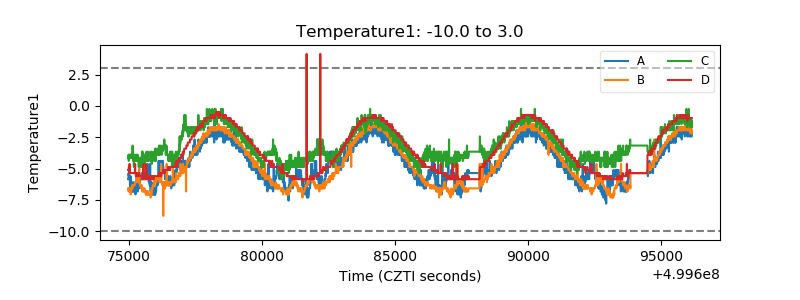 |
| Veto HV Monitor | 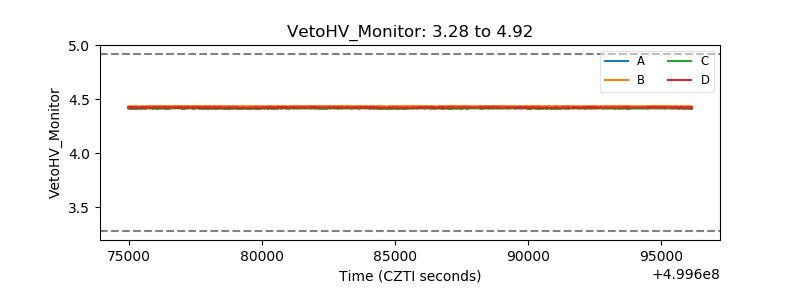 |
| Veto LLD | 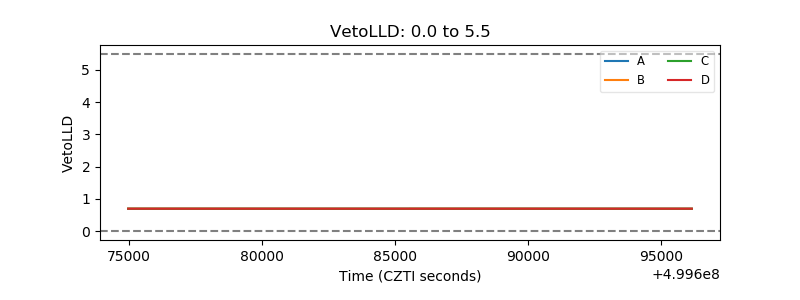 |
| Alpha Counter | 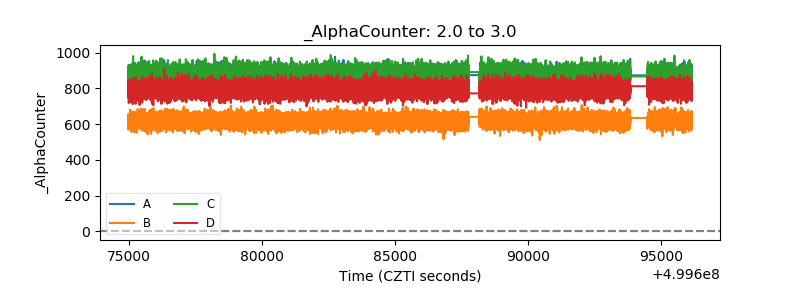 |
| _CPM_Rate | 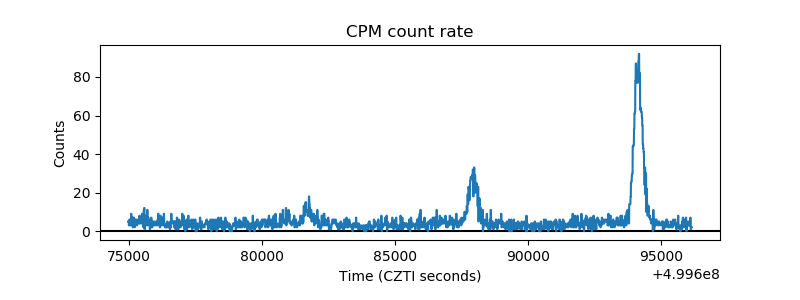 |
| CZT Counter | 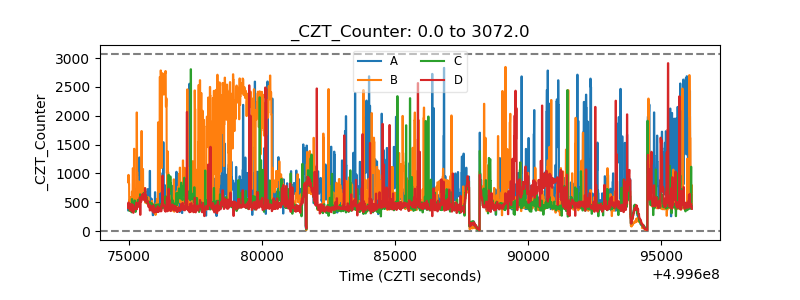 |
| +2.5 Volts monitor | 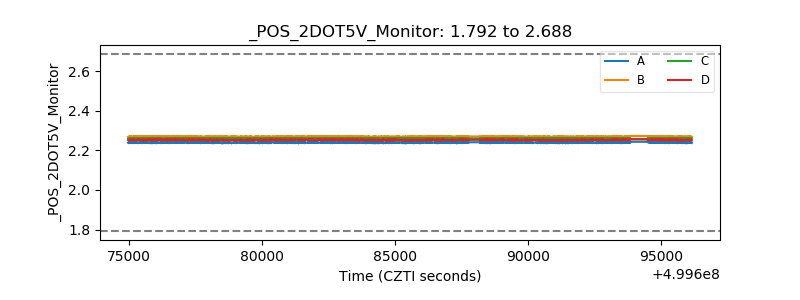 |
| +5 Volts monitor | 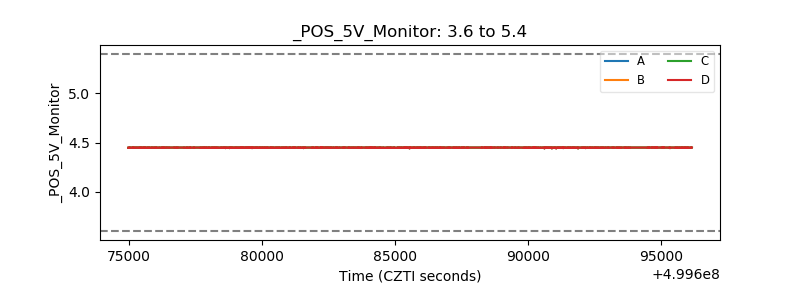 |
| _ROLL_ROT | 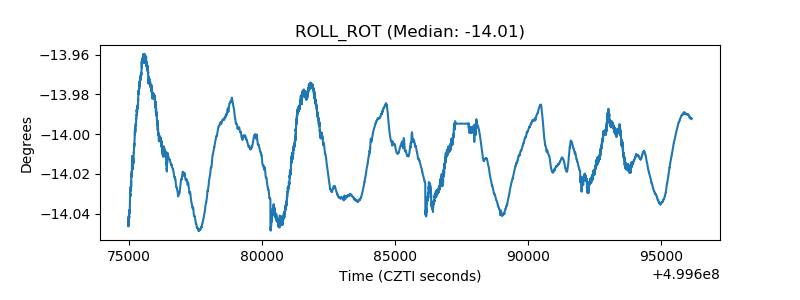 |
| _Roll_DEC | 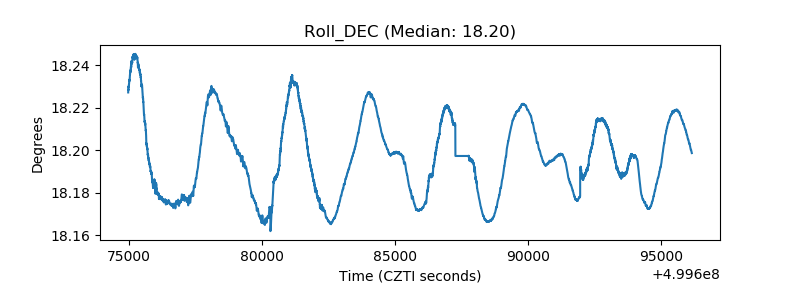 |
| _Roll_RA | 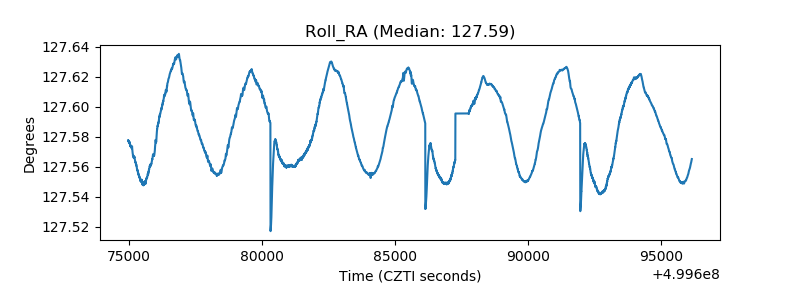 |
| Veto Counter | 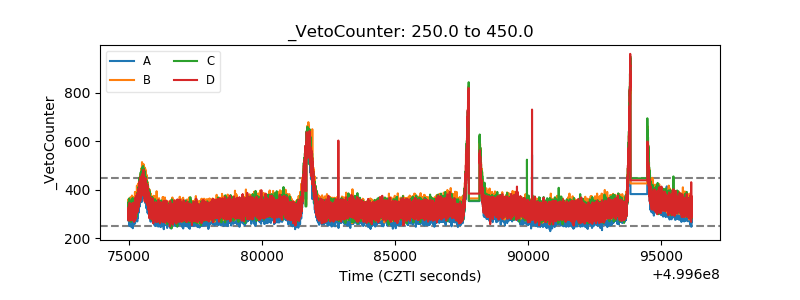 |