| Param | Original file | Final file |
|---|---|---|
| Filename | modeM0/AS1A14_066T07_9000006522_54613cztM0_level2.fits | modeM0/AS1A14_066T07_9000006522_54613cztM0_level2_quad_clean.evt |
| Size (bytes) | 502,496,640 | 100,604,160 |
| Size | 479.2 MB | 95.9 MB |
| Events in quadrant A | 6,219,942 | 631,812 |
| Events in quadrant B | 3,868,835 | 702,108 |
| Events in quadrant C | 3,838,382 | 632,706 |
| Events in quadrant D | 4,125,670 | 587,798 |
| Mode M9 | |||
|---|---|---|---|
| Quadrant | BADHDUFLAG | Total packets | Discarded packets |
| A | 0 | 8 | 0 |
| B | 0 | 8 | 0 |
| C | 0 | 8 | 0 |
| D | 0 | 8 | 0 |
| Mode M0 | |||
|---|---|---|---|
| Quadrant | BADHDUFLAG | Total packets | Discarded packets |
| A | 0 | 23371 | 1 |
| B | 0 | 16392 | 1 |
| C | 0 | 16038 | 1 |
| D | 0 | 17036 | 3 |
| Mode SS | |||
|---|---|---|---|
| Quadrant | BADHDUFLAG | Total packets | Discarded packets |
| A | 0 | 144 | 0 |
| B | 0 | 144 | 0 |
| C | 0 | 144 | 0 |
| D | 0 | 144 | 0 |
| Quadrant | Total seconds | Saturated seconds | Saturation percentage |
|---|---|---|---|
| A | 7058 | 651 | 9.223576% |
| B | 7058 | 229 | 3.244545% |
| C | 7058 | 109 | 1.544347% |
| D | 7058 | 176 | 2.493624% |
Noise dominated data is calculated using 1-second bins in cleaned event files. If a bin has >2000 counts, and if more than 50% of those come from <1% of pixels, then it is considered to be noise-dominated and hence unusable.
| Quadrant | # 1 sec bins | Bins with >0 counts | Bins with >2000 counts | High rate bins dominated by noise | Noise dominated (total time) | Noise dominated (detector-on time) | Marked lightcurve |
|---|---|---|---|---|---|---|---|
| A | 7883 | 7058 | 489 | 489 | 6.20% | 6.93% | 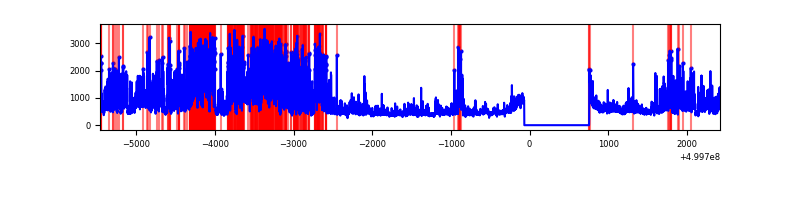 |
| B | 7883 | 7058 | 134 | 134 | 1.70% | 1.90% | 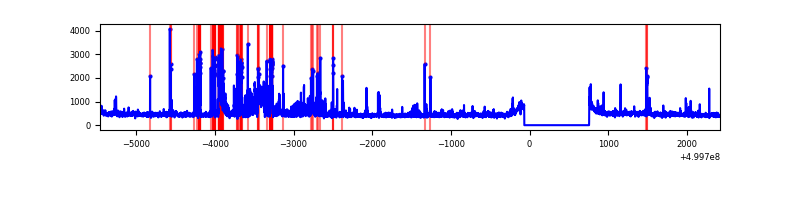 |
| C | 7883 | 7058 | 35 | 35 | 0.44% | 0.50% | 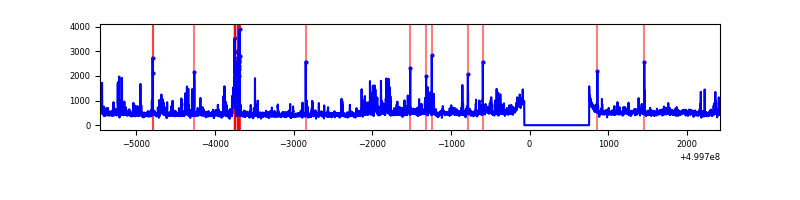 |
| D | 7883 | 7058 | 70 | 70 | 0.89% | 0.99% | 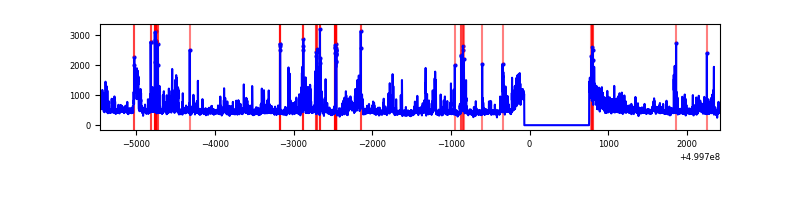 |
Top three noisy pixels from each quadrant. If the there are fewer than three noisy pixels in the level2.evt file, extra rows are filled as -1
| Pixel properties | Quadrant properties | ||||||
|---|---|---|---|---|---|---|---|
| Quadrant | DetID | PixID | Counts | Sigma | Mean | Median | Sigma |
| A | 3 | 14 | 2902785 | 15380.16 | 763 | 744 | 188.7 |
| A | 3 | 110 | 71486 | 374.92 | 763 | 744 | 188.7 |
| A | 13 | 248 | 69675 | 365.32 | 763 | 744 | 188.7 |
| B | 1 | 207 | 385500 | 2326.36 | 762 | 732 | 165.4 |
| B | 5 | 172 | 260767 | 1572.21 | 762 | 732 | 165.4 |
| B | 10 | 14 | 66104 | 395.25 | 762 | 732 | 165.4 |
| C | 5 | 10 | 288963 | 1387.5 | 757 | 746 | 207.7 |
| C | 12 | 252 | 170172 | 815.63 | 757 | 746 | 207.7 |
| C | 4 | 5 | 120399 | 576.02 | 757 | 746 | 207.7 |
| D | 2 | 172 | 327244 | 1522.2 | 758 | 725 | 214.5 |
| D | 9 | 19 | 139183 | 645.48 | 758 | 725 | 214.5 |
| D | 2 | 120 | 121193 | 561.61 | 758 | 725 | 214.5 |
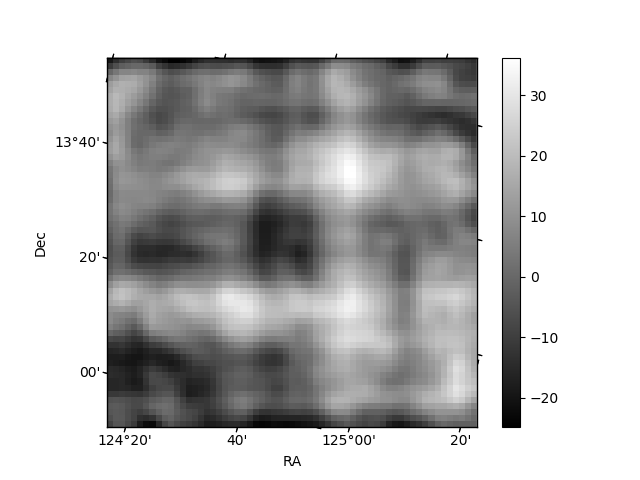
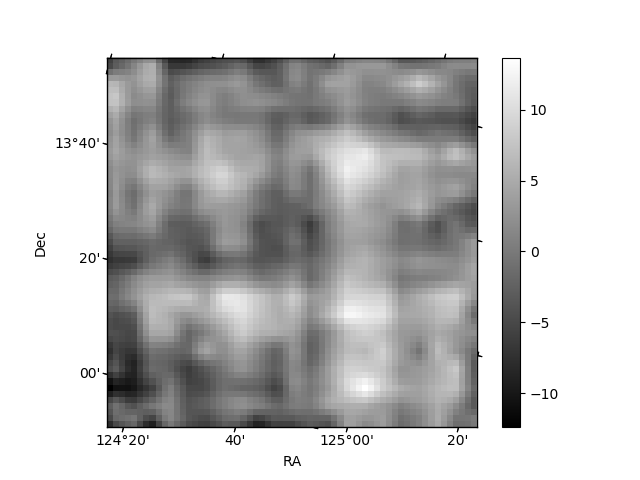
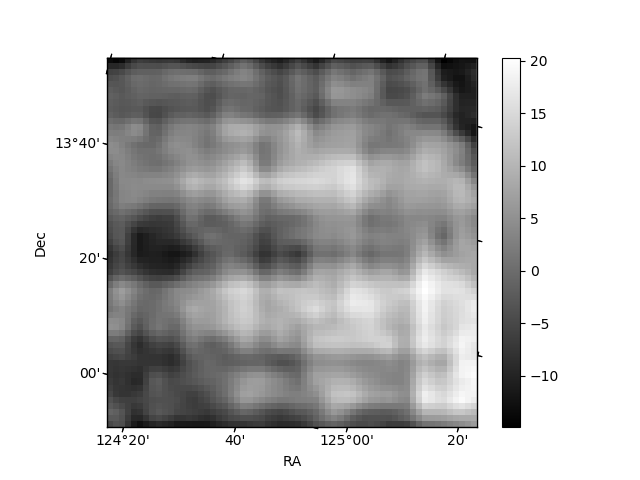
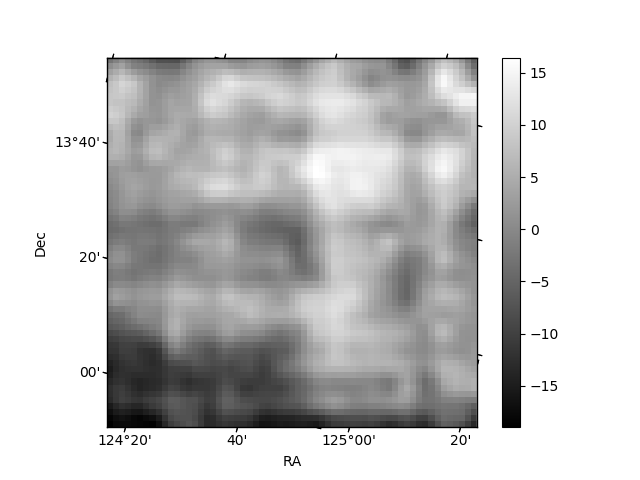
Histogram calculated using DETX and DETY for each event in the final _common_clean file
| Quadrant A | 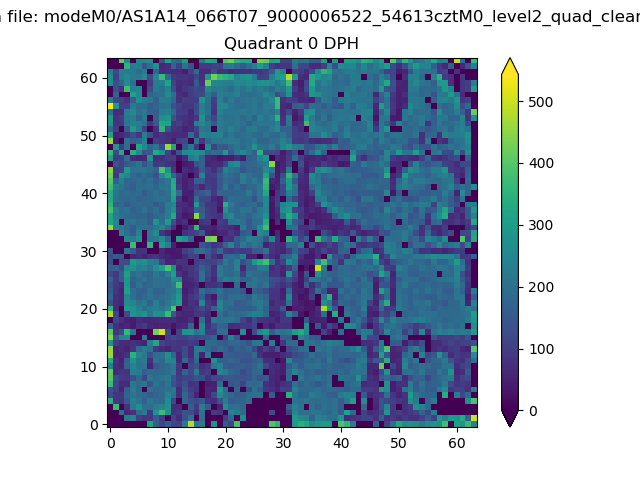 |
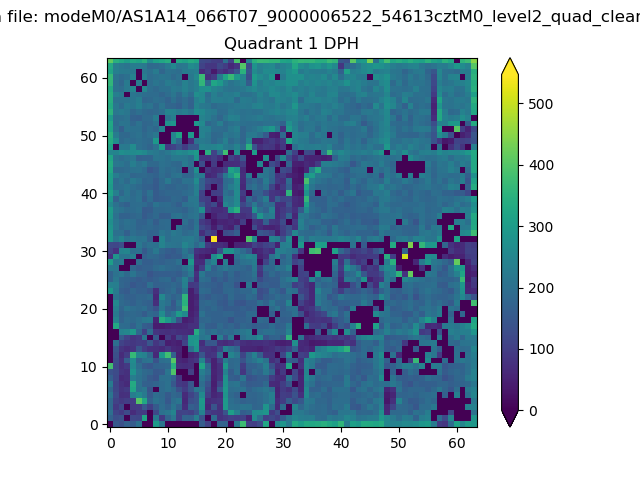 |
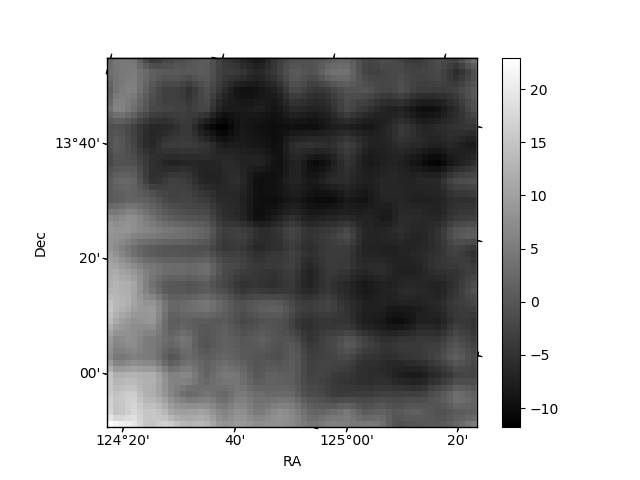
Quadrant B |
|---|---|---|---|
| Quadrant D | 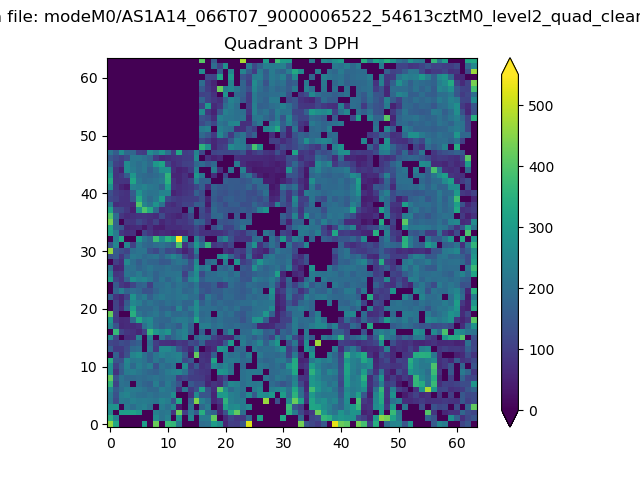 |
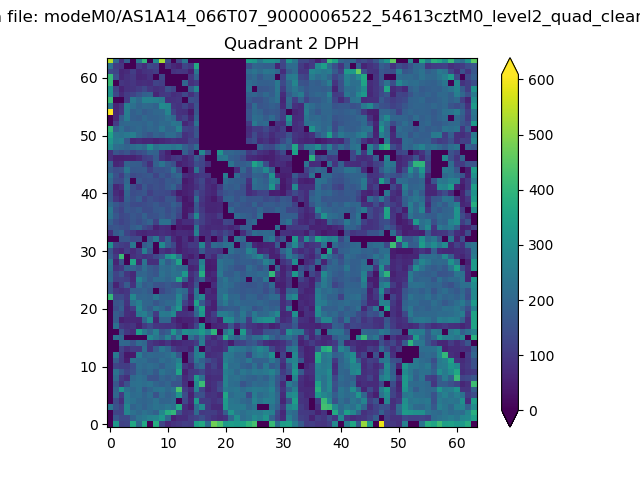 |
Quadrant C |
| Plot type | Count rate plots | Images |
|---|---|---|
| Comparison with Poisson distribution Blue bars denote a histogram of data divided into 1 sec bins. Red curve is a Poisson curve with rate = median count rate of data. |
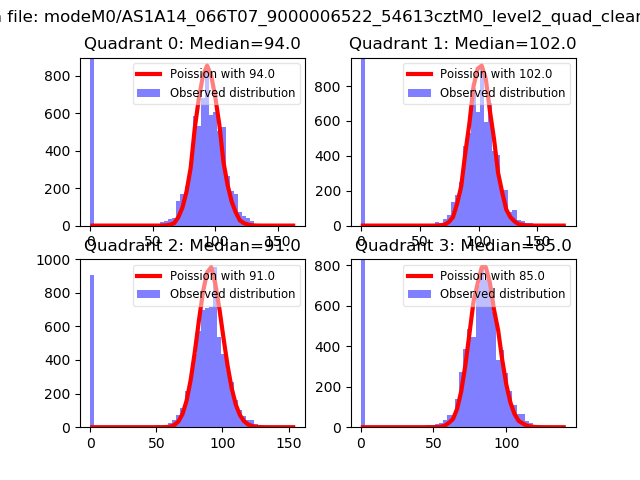 |
 |
| Quadrant-wise count rates Data is divided into 100 sec bins |
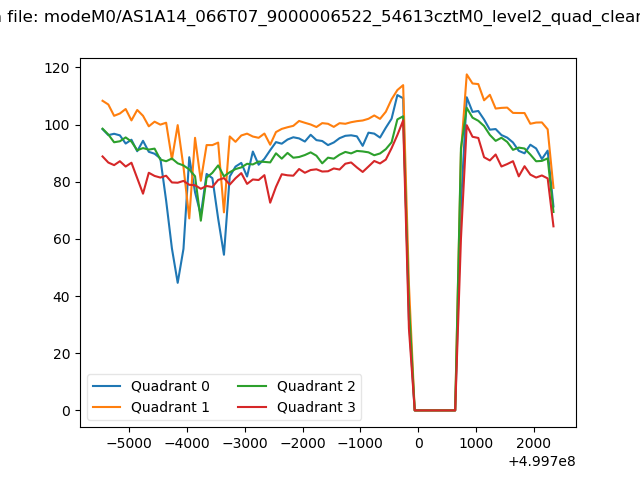 |
|
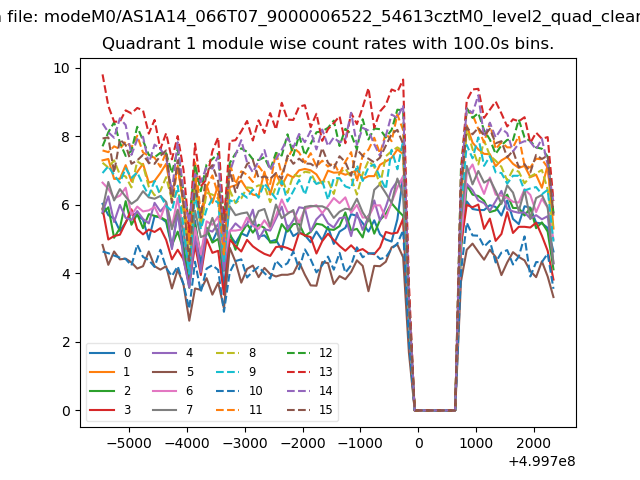
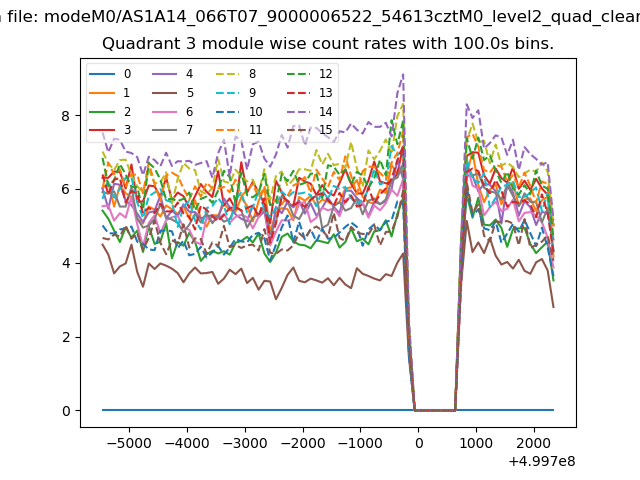
| Module-wise count rates for Quadrant A Data is divided into 100 sec bins |
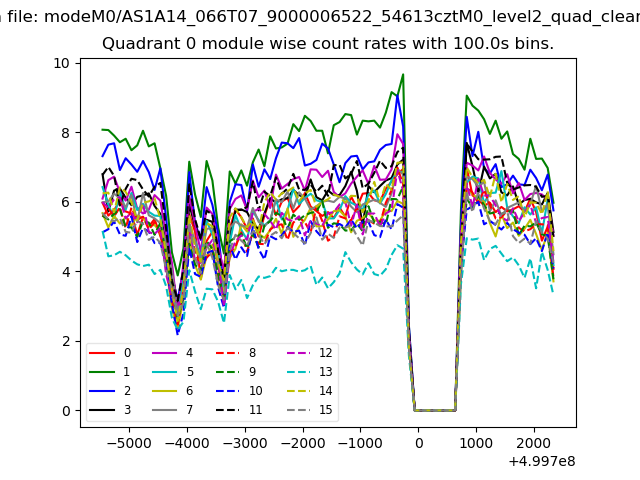 |
 |
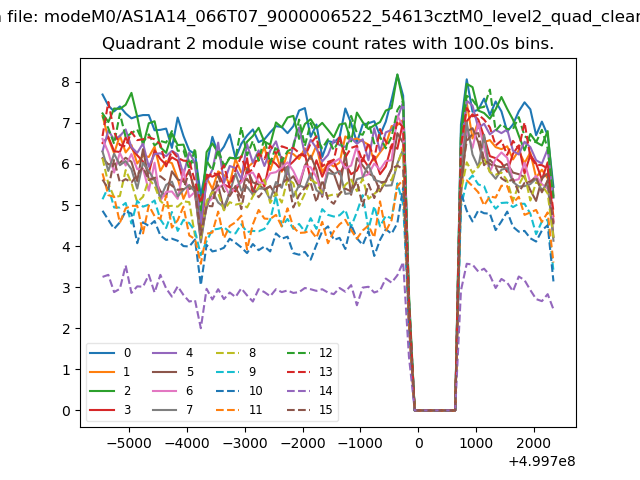
| Module-wise count rates for Quadrant B Data is divided into 100 sec bins |
 |
 |
| Module-wise count rates for Quadrant C Data is divided into 100 sec bins |
 |
 |
| Module-wise count rates for Quadrant D Data is divided into 100 sec bins |
 |
 |
| Parameter | Plot |
|---|---|
| CZT HV Monitor | 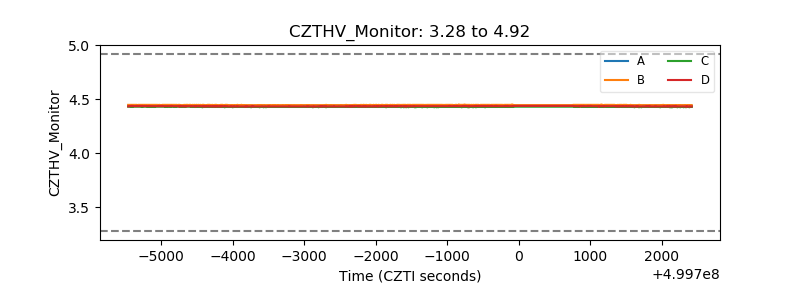 |
| D_VDD | 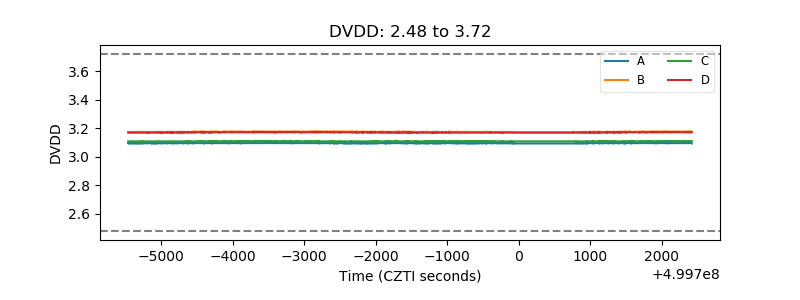 |
| Temperature 1 | 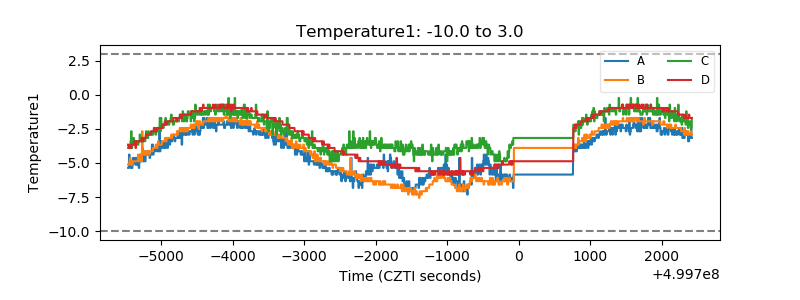 |
| Veto HV Monitor | 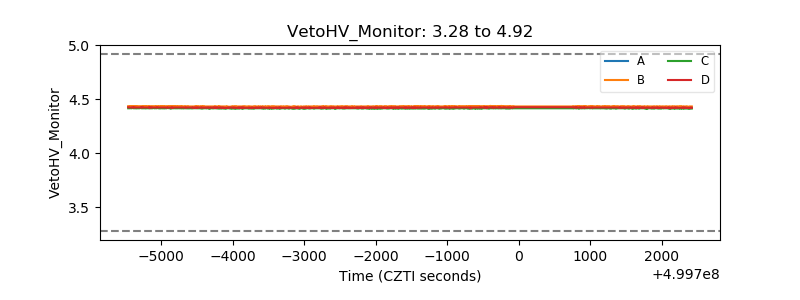 |
| Veto LLD | 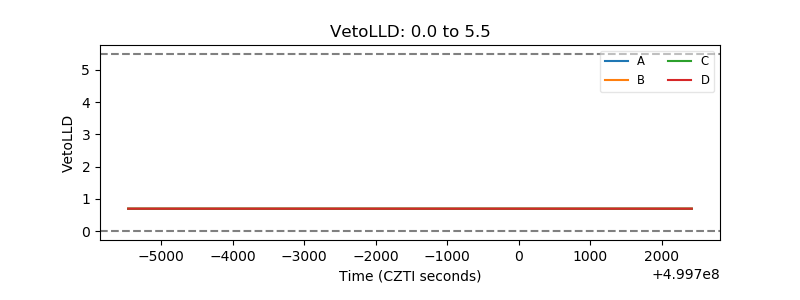 |
| Alpha Counter | 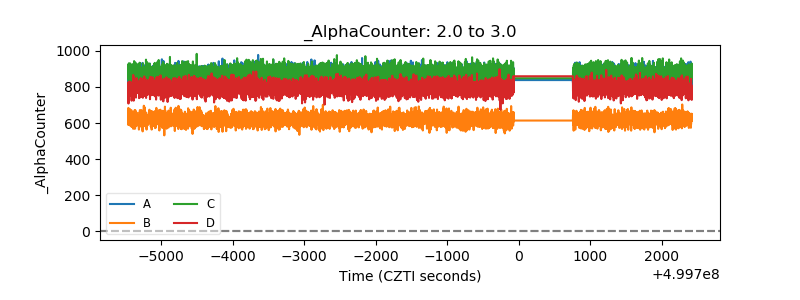 |
| _CPM_Rate | 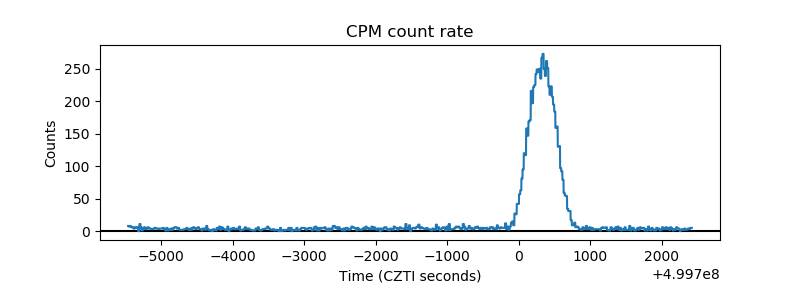 |
| CZT Counter | 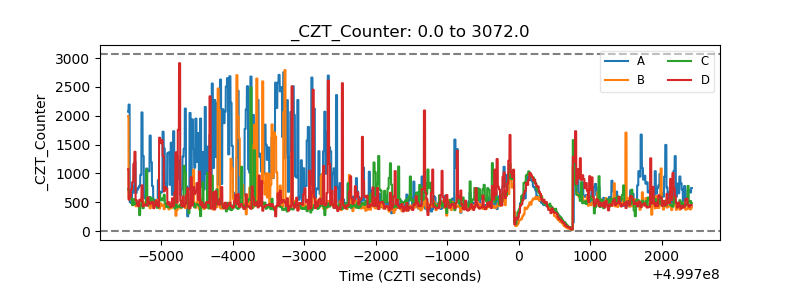 |
| +2.5 Volts monitor |  |
| +5 Volts monitor |  |
| _ROLL_ROT | 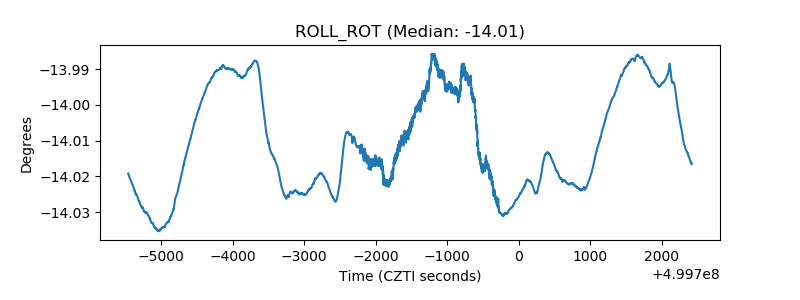 |
| _Roll_DEC | 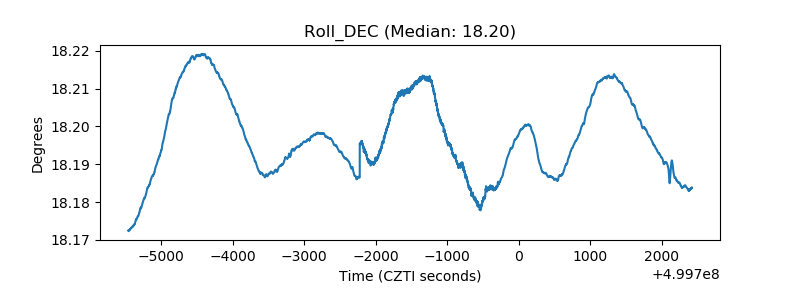 |
| _Roll_RA | 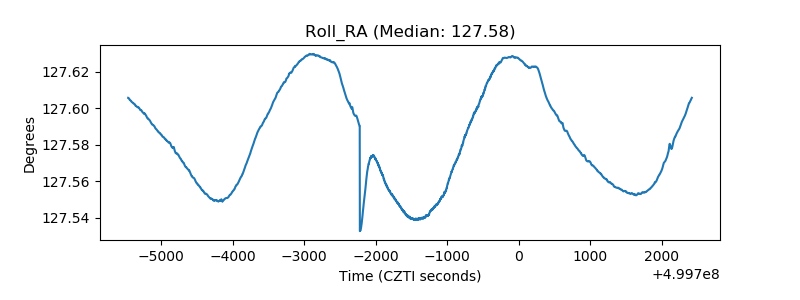 |
| Veto Counter | 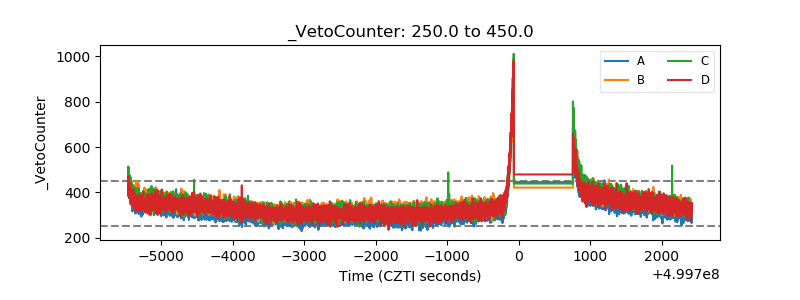 |