| Param | Original file | Final file |
|---|---|---|
| Filename | modeM0/AS1A14_066T07_9000006522_54616cztM0_level2.fits | modeM0/AS1A14_066T07_9000006522_54616cztM0_level2_quad_clean.evt |
| Size (bytes) | 369,573,120 | 93,317,760 |
| Size | 352.5 MB | 89.0 MB |
| Events in quadrant A | 3,162,463 | 612,192 |
| Events in quadrant B | 3,525,524 | 647,374 |
| Events in quadrant C | 3,340,742 | 582,608 |
| Events in quadrant D | 3,171,566 | 553,473 |
| Mode M9 | |||
|---|---|---|---|
| Quadrant | BADHDUFLAG | Total packets | Discarded packets |
| A | 0 | 11 | 0 |
| B | 0 | 11 | 0 |
| C | 0 | 11 | 0 |
| D | 0 | 11 | 0 |
| Mode M0 | |||
|---|---|---|---|
| Quadrant | BADHDUFLAG | Total packets | Discarded packets |
| A | 0 | 13775 | 1 |
| B | 0 | 14699 | 1 |
| C | 0 | 14420 | 2 |
| D | 0 | 13729 | 1 |
| Mode SS | |||
|---|---|---|---|
| Quadrant | BADHDUFLAG | Total packets | Discarded packets |
| A | 0 | 124 | 0 |
| B | 0 | 124 | 0 |
| C | 0 | 124 | 0 |
| D | 0 | 124 | 0 |
| Quadrant | Total seconds | Saturated seconds | Saturation percentage |
|---|---|---|---|
| A | 6165 | 166 | 2.692620% |
| B | 6165 | 197 | 3.195458% |
| C | 6165 | 115 | 1.865369% |
| D | 6165 | 87 | 1.411192% |
Noise dominated data is calculated using 1-second bins in cleaned event files. If a bin has >2000 counts, and if more than 50% of those come from <1% of pixels, then it is considered to be noise-dominated and hence unusable.
| Quadrant | # 1 sec bins | Bins with >0 counts | Bins with >2000 counts | High rate bins dominated by noise | Noise dominated (total time) | Noise dominated (detector-on time) | Marked lightcurve |
|---|---|---|---|---|---|---|---|
| A | 7255 | 6165 | 86 | 86 | 1.19% | 1.39% | 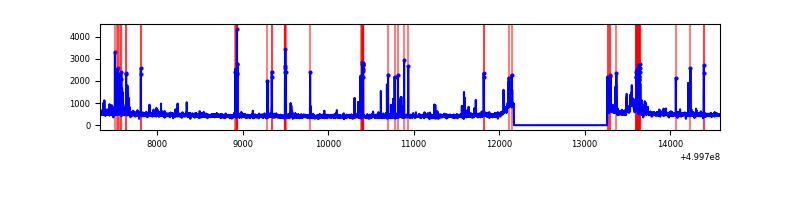 |
| B | 7255 | 6165 | 94 | 94 | 1.30% | 1.52% | 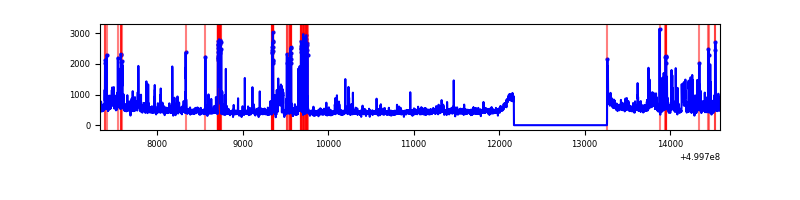 |
| C | 7255 | 6165 | 41 | 41 | 0.57% | 0.67% | 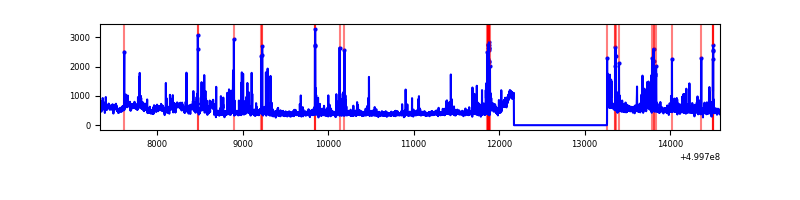 |
| D | 7255 | 6165 | 33 | 33 | 0.45% | 0.54% | 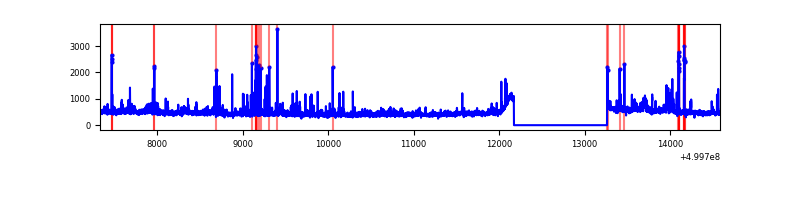 |
Top three noisy pixels from each quadrant. If the there are fewer than three noisy pixels in the level2.evt file, extra rows are filled as -1
| Pixel properties | Quadrant properties | ||||||
|---|---|---|---|---|---|---|---|
| Quadrant | DetID | PixID | Counts | Sigma | Mean | Median | Sigma |
| A | 13 | 248 | 161752 | 943.32 | 694 | 676 | 170.8 |
| A | 11 | 3 | 154869 | 903.01 | 694 | 676 | 170.8 |
| A | 5 | 240 | 64040 | 371.08 | 694 | 676 | 170.8 |
| B | 5 | 172 | 363522 | 2465.38 | 684 | 660 | 147.2 |
| B | 1 | 207 | 225612 | 1528.39 | 684 | 660 | 147.2 |
| B | 8 | 234 | 48963 | 328.18 | 684 | 660 | 147.2 |
| C | 4 | 5 | 244234 | 1297.44 | 681 | 675 | 187.7 |
| C | 13 | 3 | 117546 | 622.57 | 681 | 675 | 187.7 |
| C | 6 | 223 | 79028 | 417.39 | 681 | 675 | 187.7 |
| D | 3 | 12 | 117633 | 604.4 | 682 | 654 | 193.5 |
| D | 3 | 176 | 82224 | 421.45 | 682 | 654 | 193.5 |
| D | 2 | 172 | 62854 | 321.37 | 682 | 654 | 193.5 |
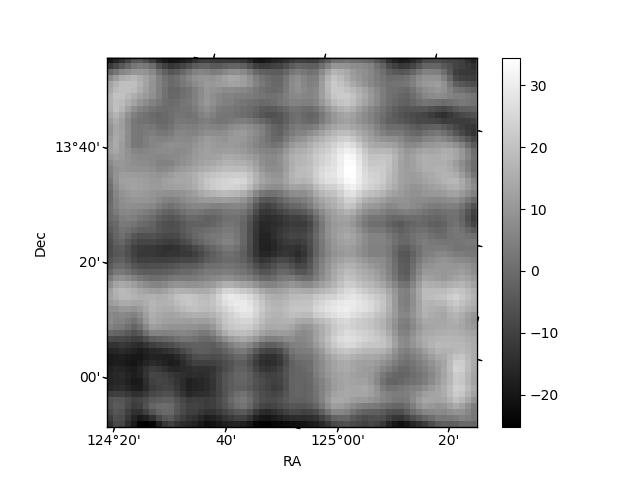
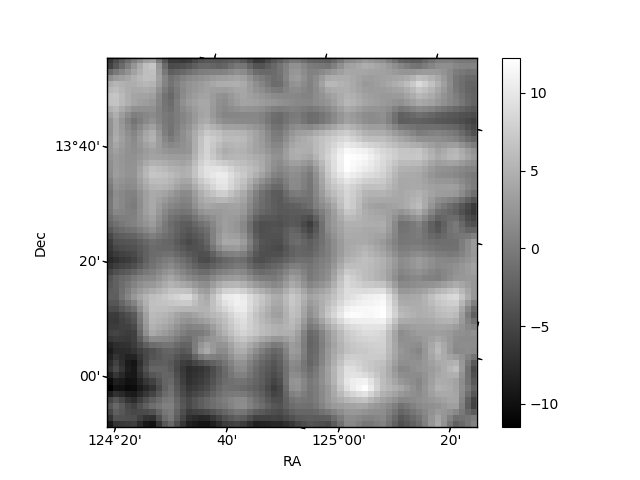
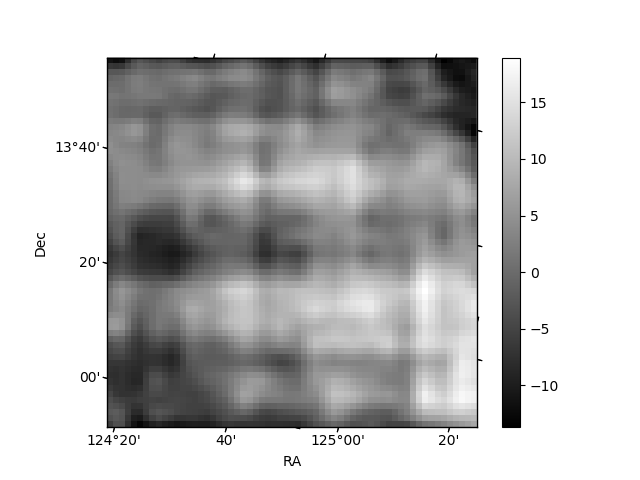
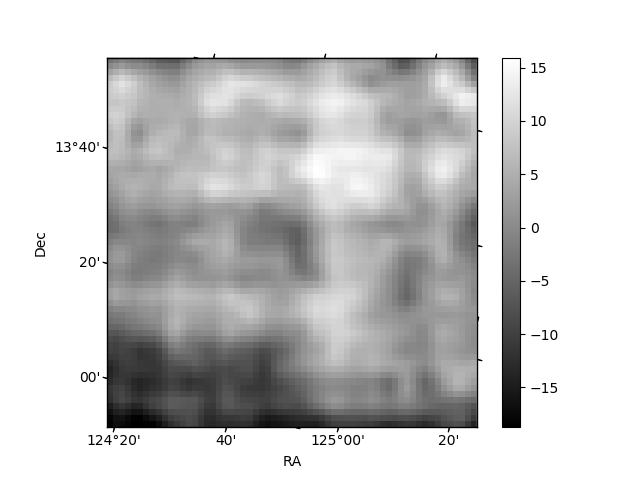
Histogram calculated using DETX and DETY for each event in the final _common_clean file
| Quadrant A | 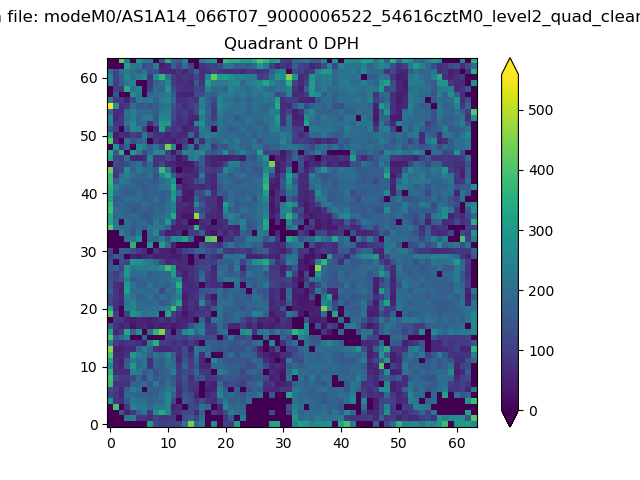 |
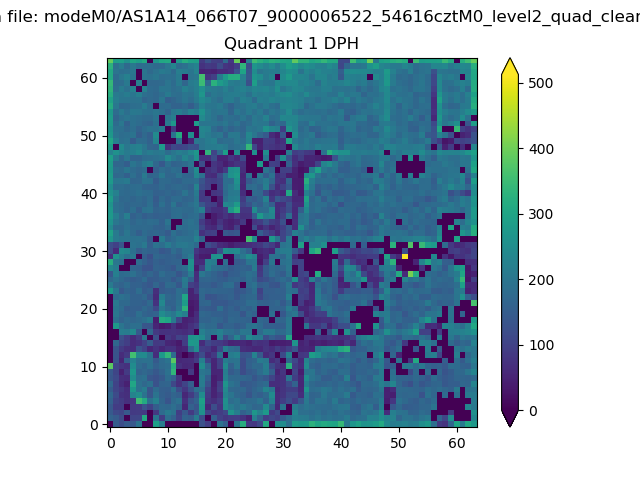 |
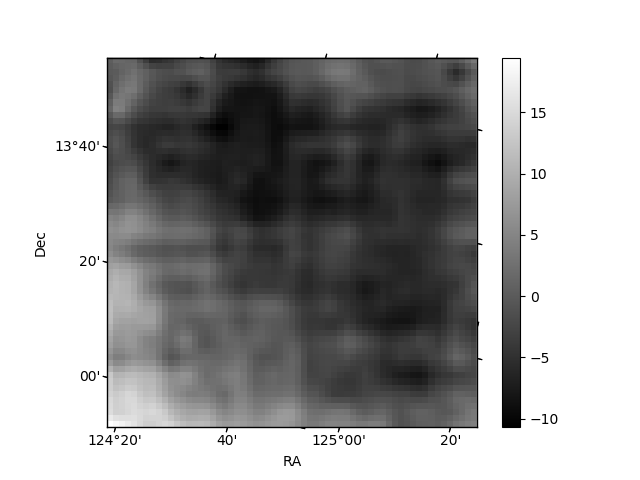
Quadrant B |
|---|---|---|---|
| Quadrant D | 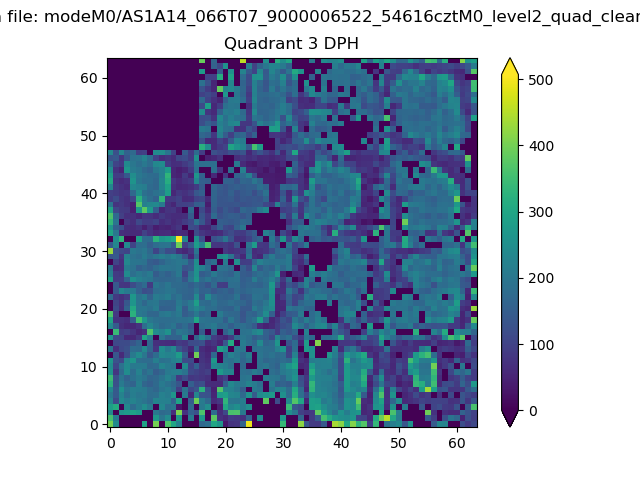 |
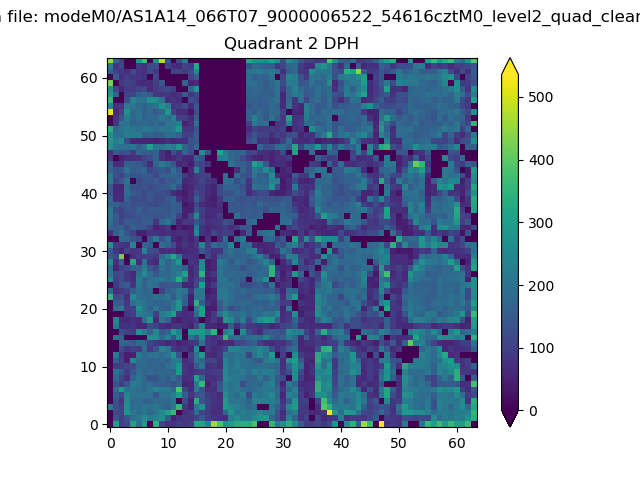 |
Quadrant C |
| Plot type | Count rate plots | Images |
|---|---|---|
| Comparison with Poisson distribution Blue bars denote a histogram of data divided into 1 sec bins. Red curve is a Poisson curve with rate = median count rate of data. |
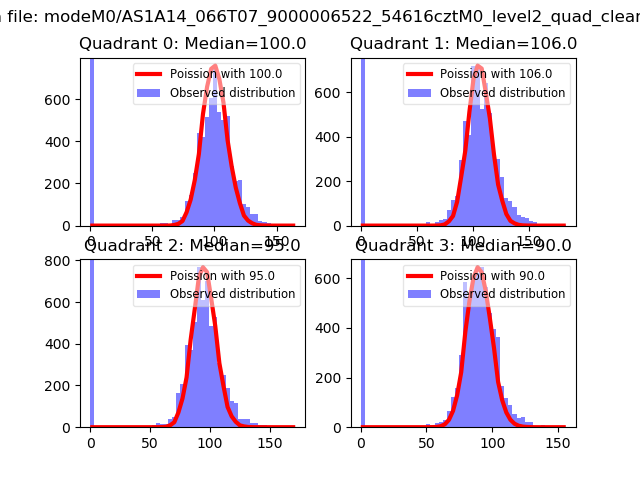 |
 |
| Quadrant-wise count rates Data is divided into 100 sec bins |
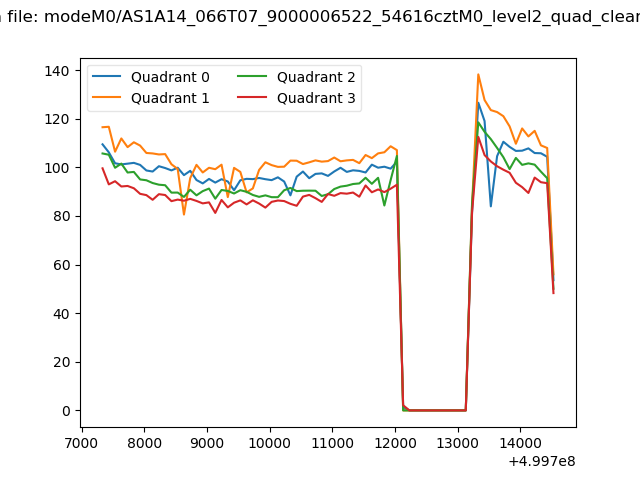 |
|
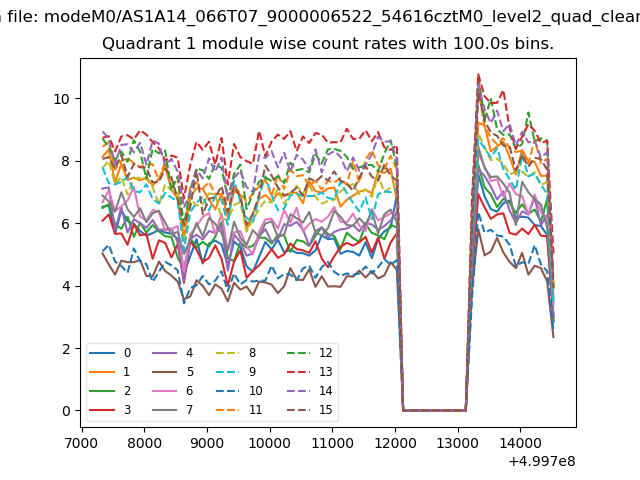
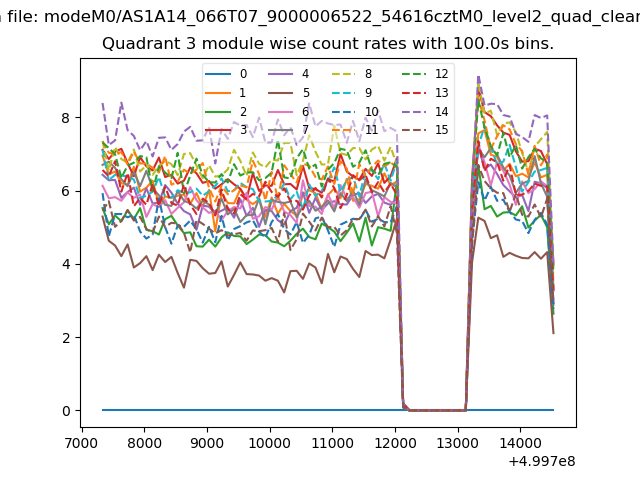
| Module-wise count rates for Quadrant A Data is divided into 100 sec bins |
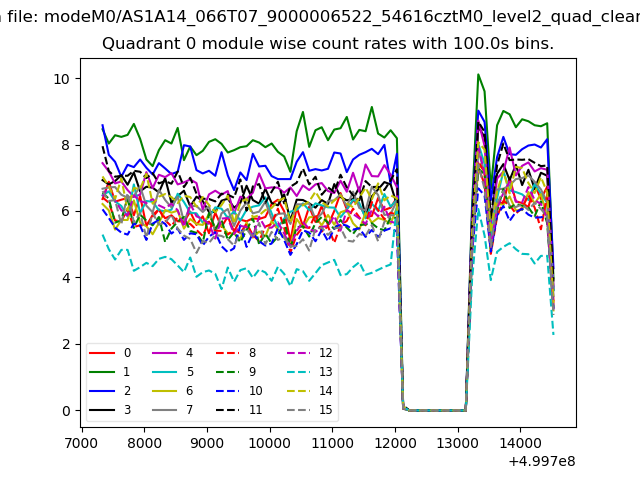 |
 |
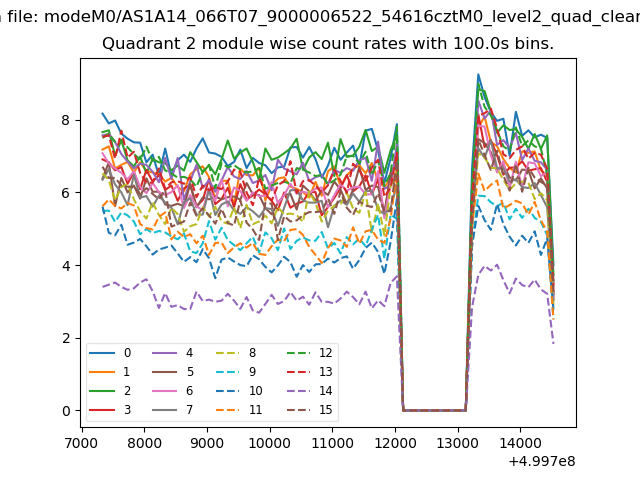
| Module-wise count rates for Quadrant B Data is divided into 100 sec bins |
 |
 |
| Module-wise count rates for Quadrant C Data is divided into 100 sec bins |
 |
 |
| Module-wise count rates for Quadrant D Data is divided into 100 sec bins |
 |
 |
| Parameter | Plot |
|---|---|
| CZT HV Monitor | 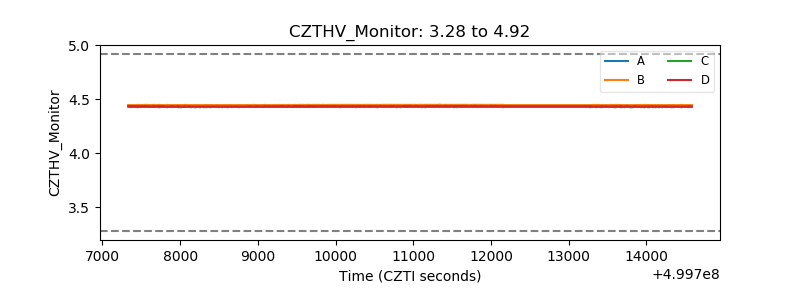 |
| D_VDD | 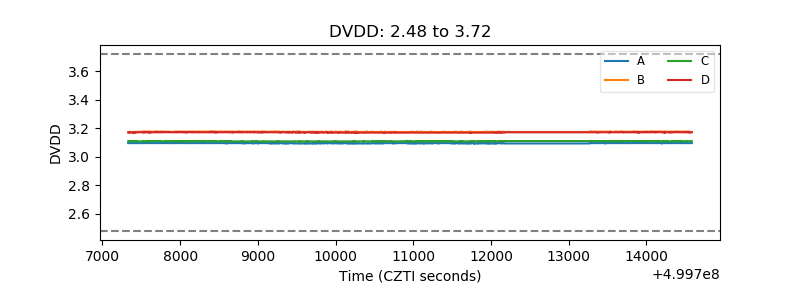 |
| Temperature 1 | 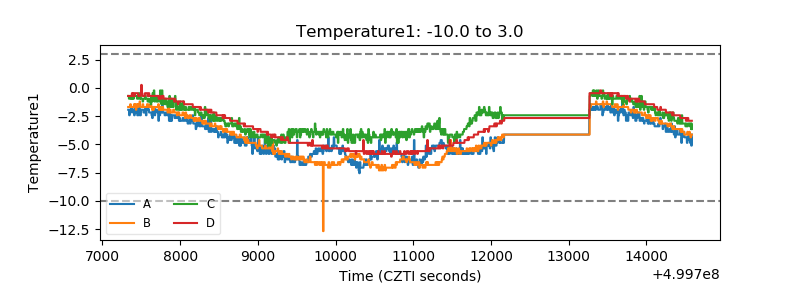 |
| Veto HV Monitor | 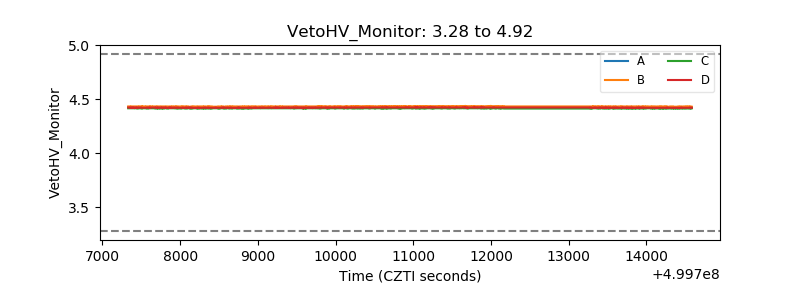 |
| Veto LLD | 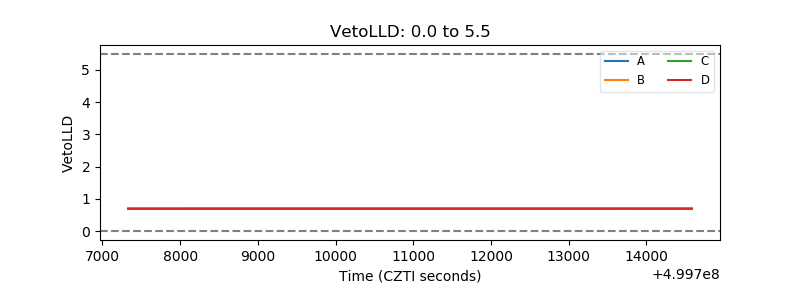 |
| Alpha Counter | 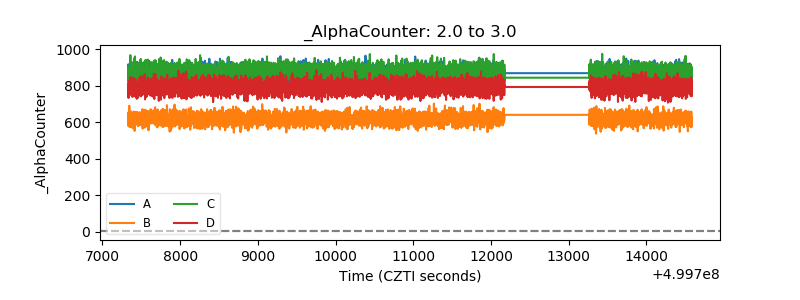 |
| _CPM_Rate | 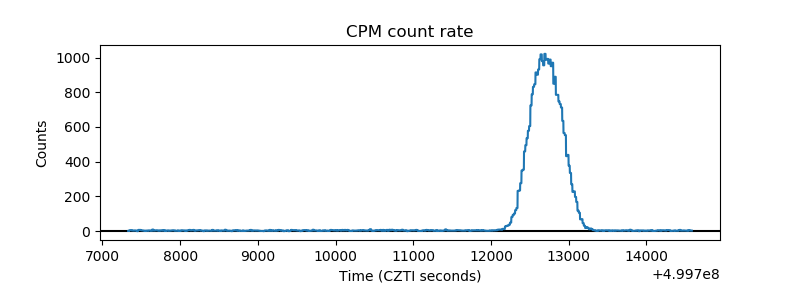 |
| CZT Counter | 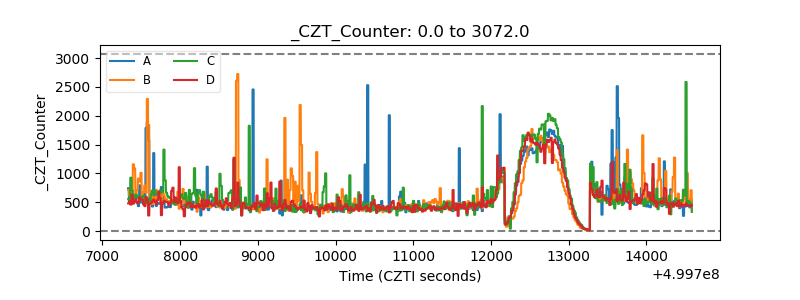 |
| +2.5 Volts monitor | 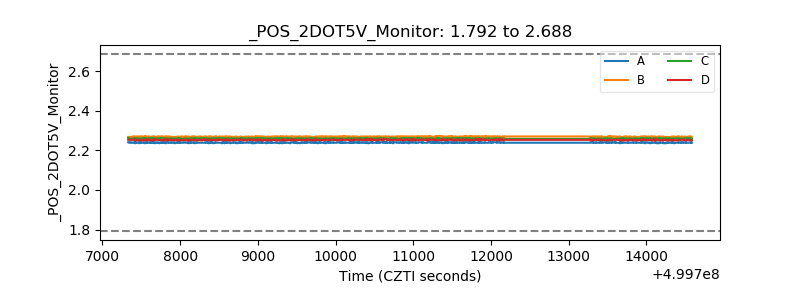 |
| +5 Volts monitor | 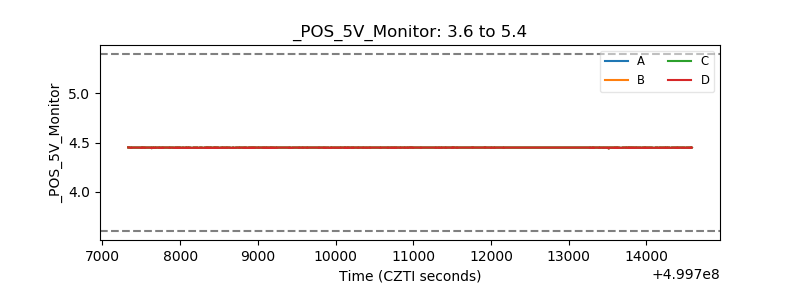 |
| _ROLL_ROT | 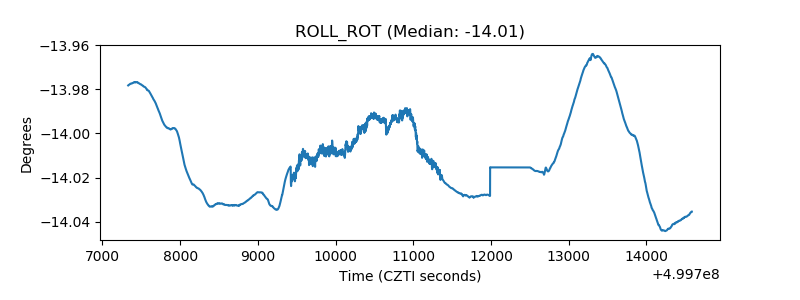 |
| _Roll_DEC | 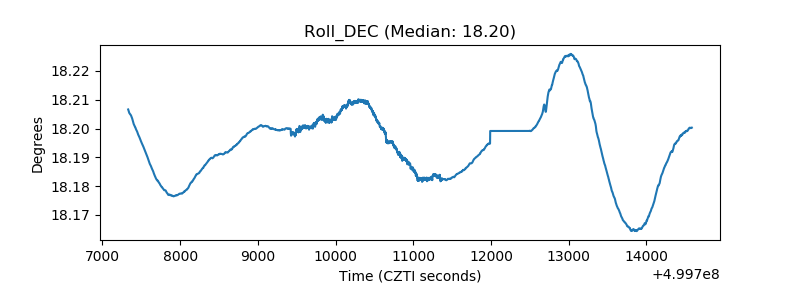 |
| _Roll_RA | 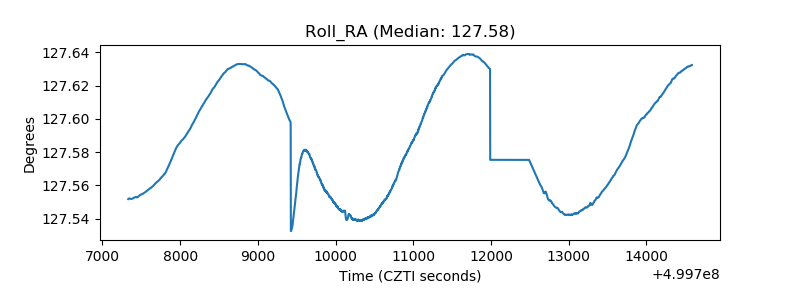 |
| Veto Counter | 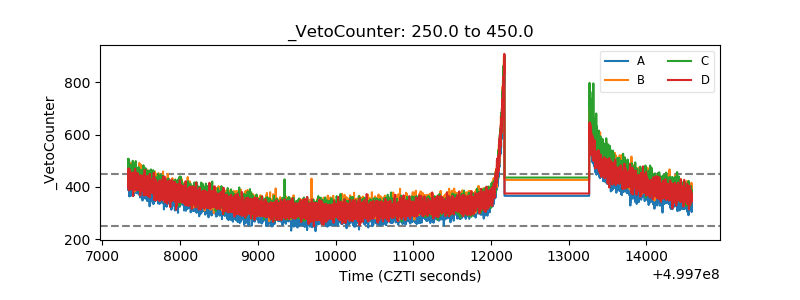 |