| Param | Original file | Final file |
|---|---|---|
| Filename | modeM0/AS1A14_066T07_9000006522_54617cztM0_level2.fits | modeM0/AS1A14_066T07_9000006522_54617cztM0_level2_quad_clean.evt |
| Size (bytes) | 400,429,440 | 97,882,560 |
| Size | 381.9 MB | 93.3 MB |
| Events in quadrant A | 3,428,242 | 643,644 |
| Events in quadrant B | 3,866,113 | 683,276 |
| Events in quadrant C | 3,599,226 | 612,488 |
| Events in quadrant D | 3,437,471 | 583,122 |
| Mode M9 | |||
|---|---|---|---|
| Quadrant | BADHDUFLAG | Total packets | Discarded packets |
| A | 0 | 17 | 0 |
| B | 0 | 17 | 0 |
| C | 0 | 18 | 0 |
| D | 0 | 18 | 0 |
| Mode M0 | |||
|---|---|---|---|
| Quadrant | BADHDUFLAG | Total packets | Discarded packets |
| A | 0 | 14535 | 2 |
| B | 0 | 15867 | 2 |
| C | 0 | 15047 | 2 |
| D | 0 | 14741 | 2 |
| Mode SS | |||
|---|---|---|---|
| Quadrant | BADHDUFLAG | Total packets | Discarded packets |
| A | 0 | 130 | 0 |
| B | 0 | 130 | 0 |
| C | 0 | 130 | 0 |
| D | 0 | 130 | 0 |
| Quadrant | Total seconds | Saturated seconds | Saturation percentage |
|---|---|---|---|
| A | 6317 | 173 | 2.738642% |
| B | 6317 | 247 | 3.910084% |
| C | 6317 | 181 | 2.865284% |
| D | 6316 | 100 | 1.583281% |
Noise dominated data is calculated using 1-second bins in cleaned event files. If a bin has >2000 counts, and if more than 50% of those come from <1% of pixels, then it is considered to be noise-dominated and hence unusable.
| Quadrant | # 1 sec bins | Bins with >0 counts | Bins with >2000 counts | High rate bins dominated by noise | Noise dominated (total time) | Noise dominated (detector-on time) | Marked lightcurve |
|---|---|---|---|---|---|---|---|
| A | 7467 | 6317 | 86 | 86 | 1.15% | 1.36% | 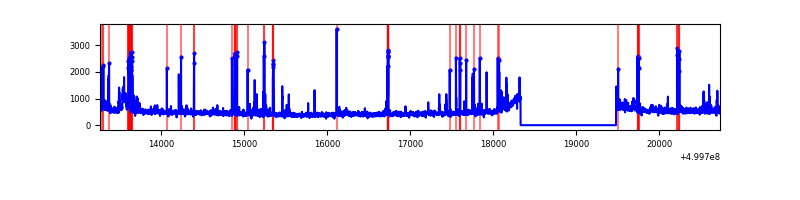 |
| B | 7466 | 6316 | 112 | 112 | 1.50% | 1.77% | 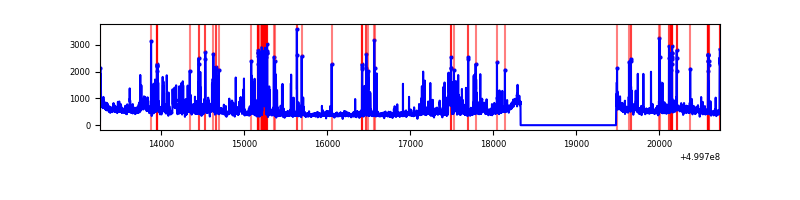 |
| C | 7467 | 6317 | 97 | 97 | 1.30% | 1.54% | 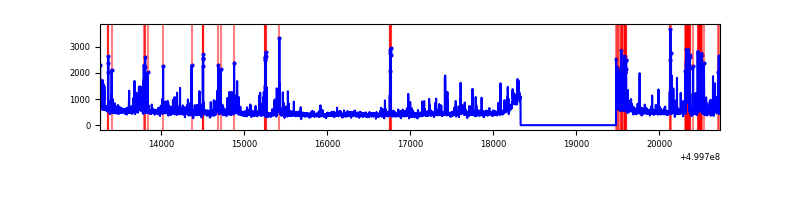 |
| D | 7466 | 6316 | 53 | 53 | 0.71% | 0.84% | 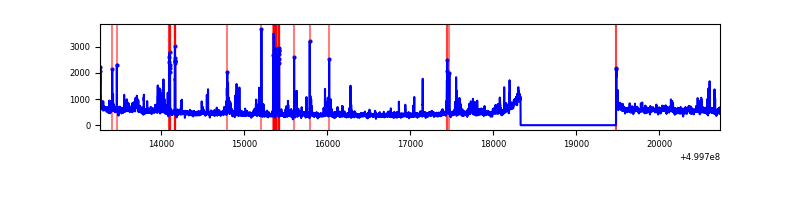 |
Top three noisy pixels from each quadrant. If the there are fewer than three noisy pixels in the level2.evt file, extra rows are filled as -1
| Pixel properties | Quadrant properties | ||||||
|---|---|---|---|---|---|---|---|
| Quadrant | DetID | PixID | Counts | Sigma | Mean | Median | Sigma |
| A | 13 | 248 | 204158 | 1136.86 | 727 | 710 | 179.0 |
| A | 3 | 14 | 135709 | 754.37 | 727 | 710 | 179.0 |
| A | 11 | 3 | 135551 | 753.49 | 727 | 710 | 179.0 |
| B | 5 | 172 | 383376 | 2504.2 | 714 | 690 | 152.8 |
| B | 8 | 234 | 245712 | 1603.36 | 714 | 690 | 152.8 |
| B | 1 | 207 | 141564 | 921.84 | 714 | 690 | 152.8 |
| C | 13 | 3 | 398947 | 2032.19 | 711 | 703 | 196.0 |
| C | 14 | 254 | 92038 | 466.07 | 711 | 703 | 196.0 |
| C | 6 | 223 | 72061 | 364.13 | 711 | 703 | 196.0 |
| D | 2 | 62 | 188412 | 927.08 | 712 | 684 | 202.5 |
| D | 2 | 172 | 115643 | 567.72 | 712 | 684 | 202.5 |
| D | 3 | 176 | 65073 | 317.98 | 712 | 684 | 202.5 |
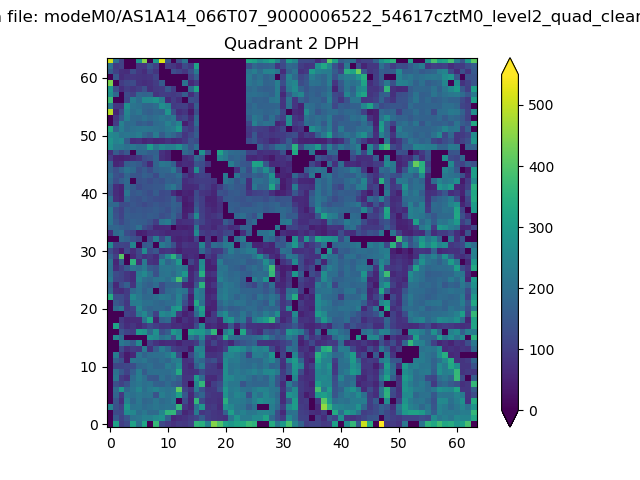
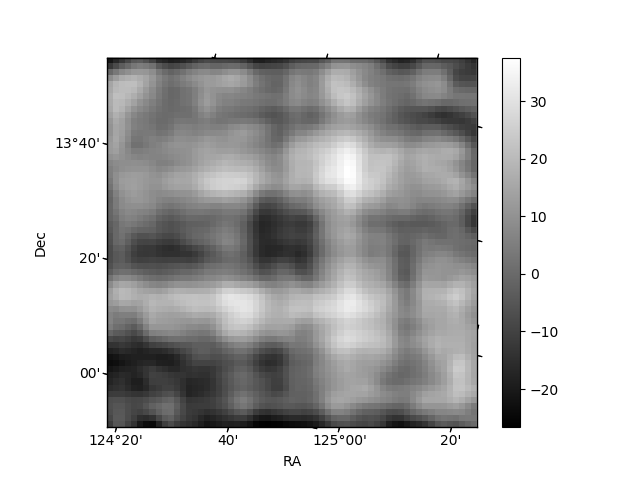
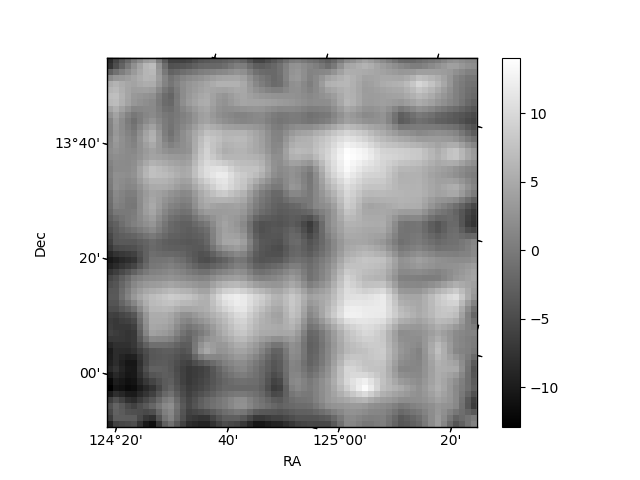
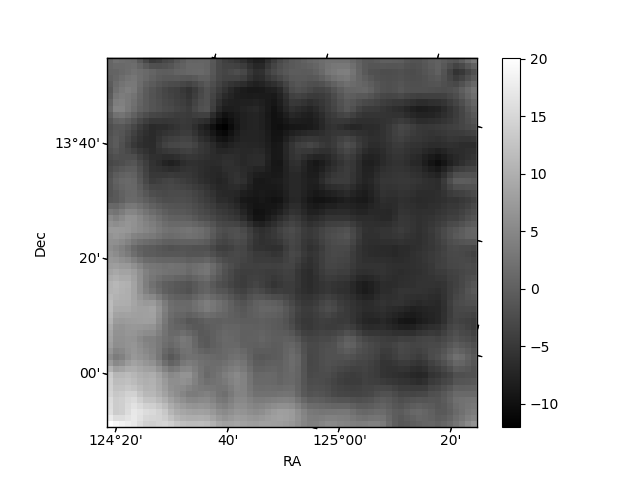
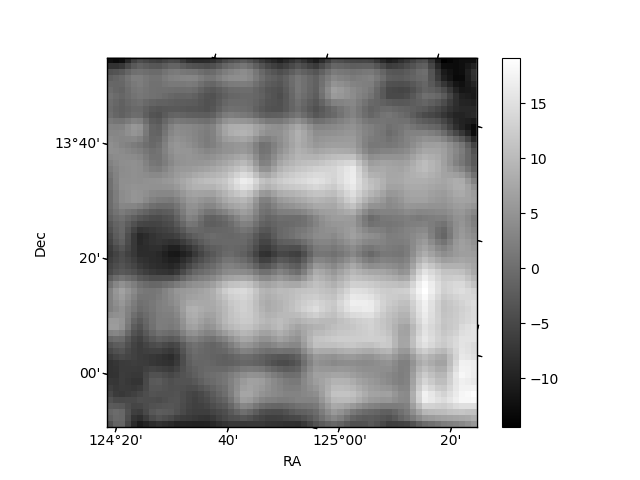
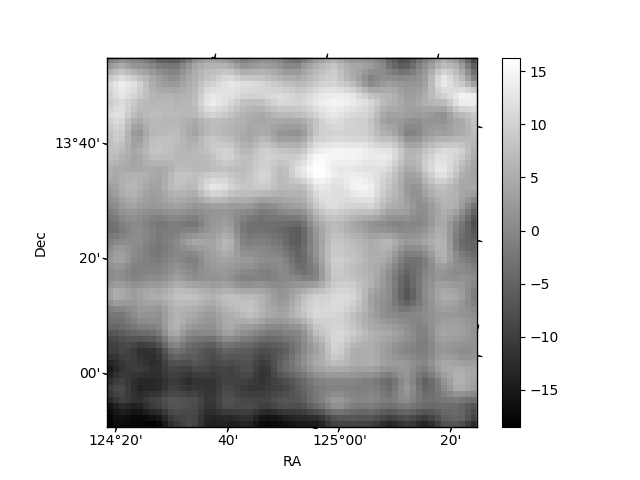
Histogram calculated using DETX and DETY for each event in the final _common_clean file
| Quadrant A | 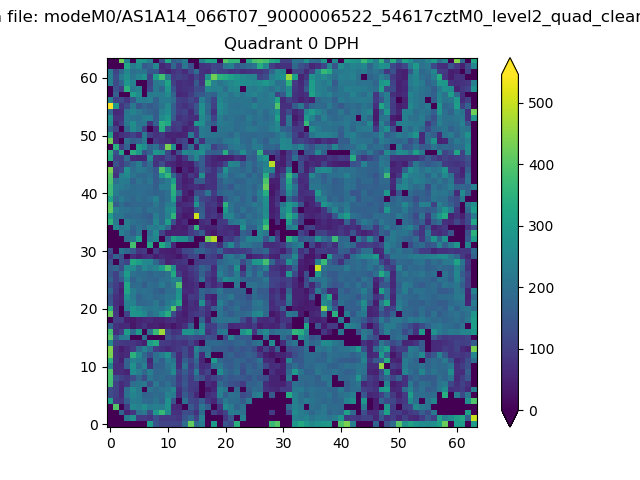 |
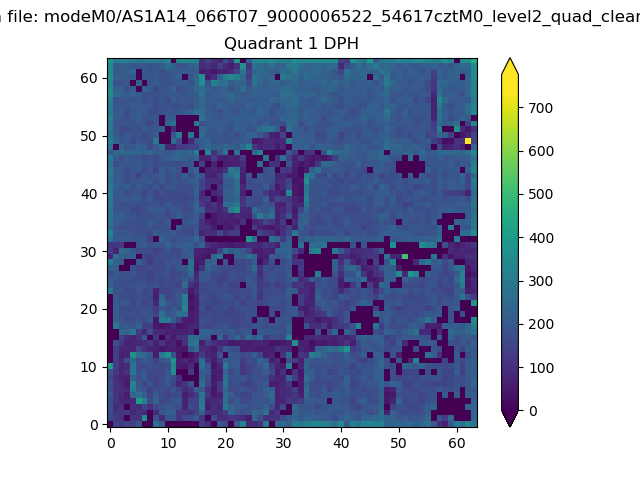 |
Quadrant B |
|---|---|---|---|
| Quadrant D | 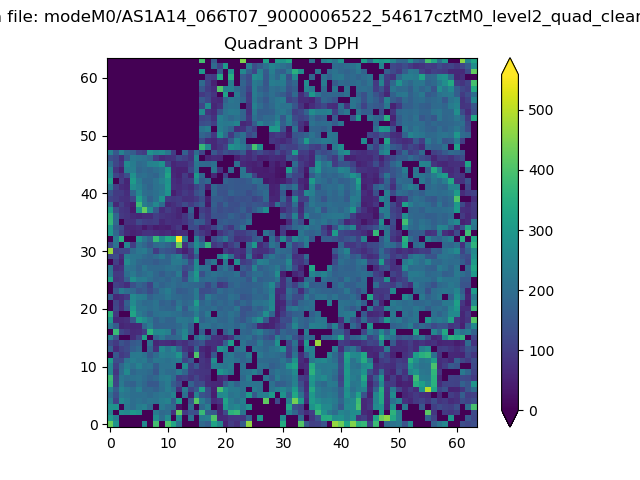 |
 |
Quadrant C |
| Plot type | Count rate plots | Images |
|---|---|---|
| Comparison with Poisson distribution Blue bars denote a histogram of data divided into 1 sec bins. Red curve is a Poisson curve with rate = median count rate of data. |
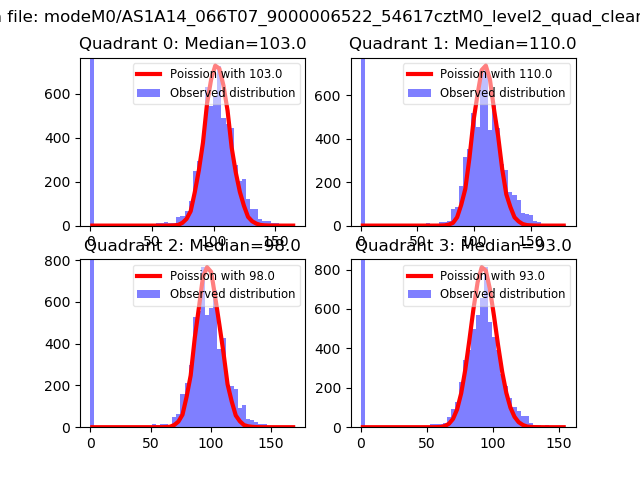 |
 |
| Quadrant-wise count rates Data is divided into 100 sec bins |
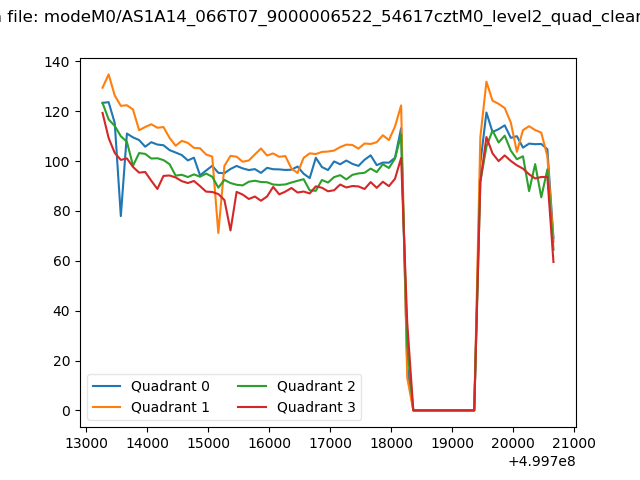 |
|
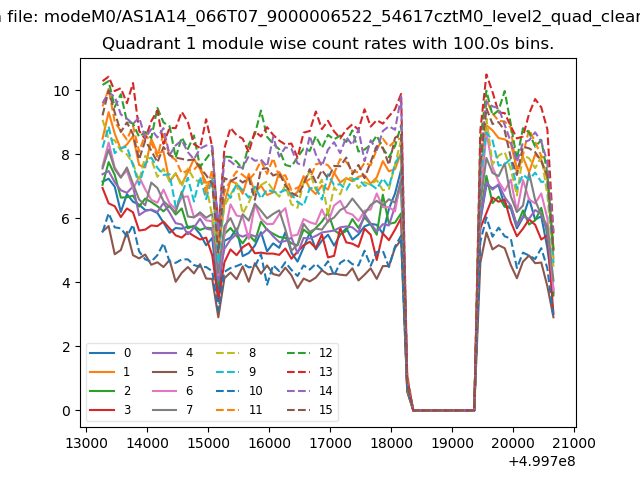
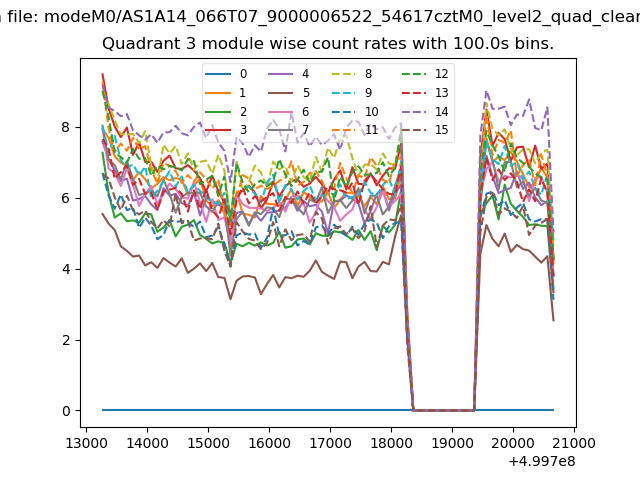
| Module-wise count rates for Quadrant A Data is divided into 100 sec bins |
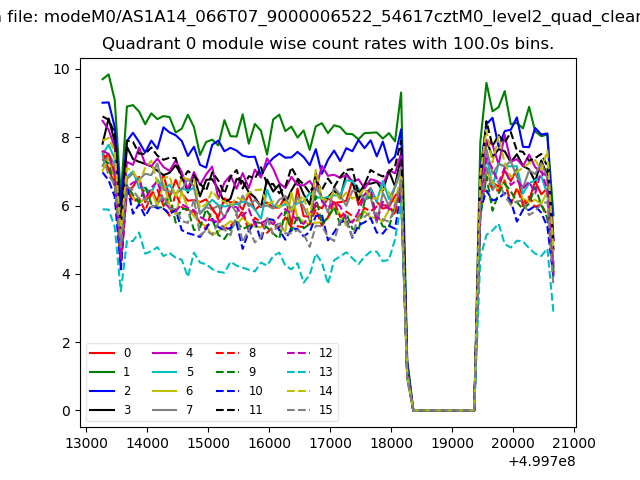 |
 |
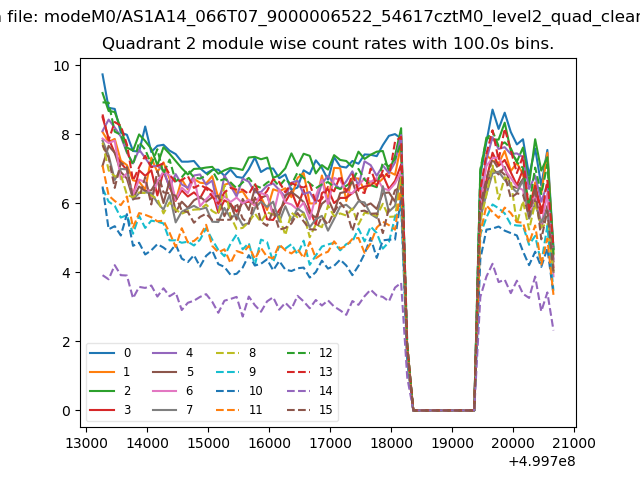
| Module-wise count rates for Quadrant B Data is divided into 100 sec bins |
 |
 |
| Module-wise count rates for Quadrant C Data is divided into 100 sec bins |
 |
 |
| Module-wise count rates for Quadrant D Data is divided into 100 sec bins |
 |
 |
| Parameter | Plot |
|---|---|
| CZT HV Monitor | 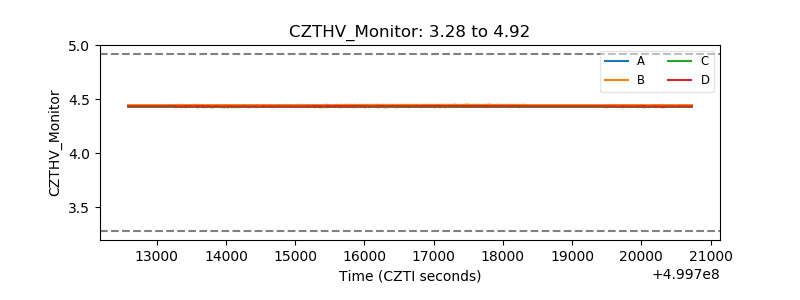 |
| D_VDD | 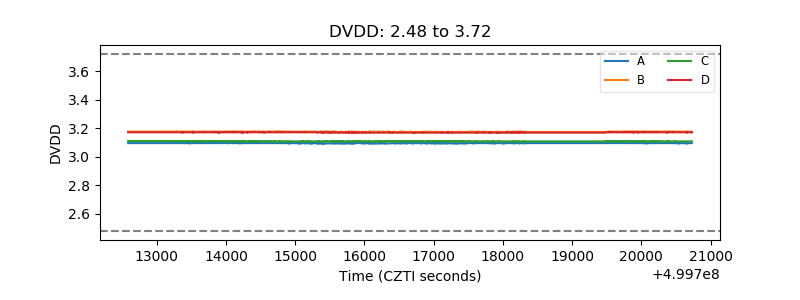 |
| Temperature 1 | 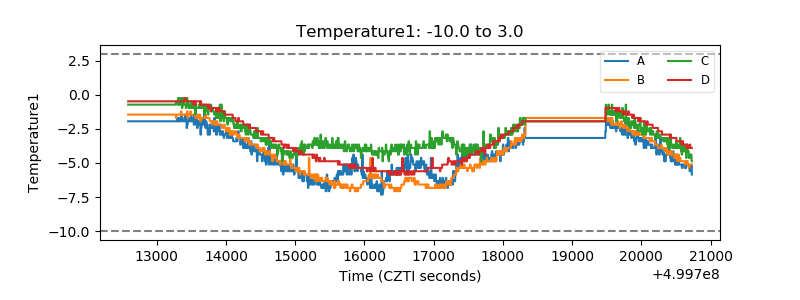 |
| Veto HV Monitor | 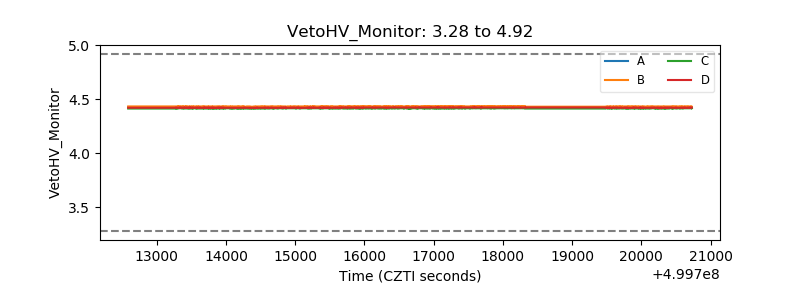 |
| Veto LLD | 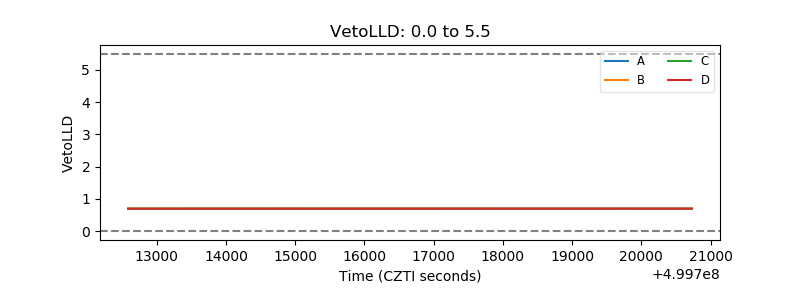 |
| Alpha Counter | 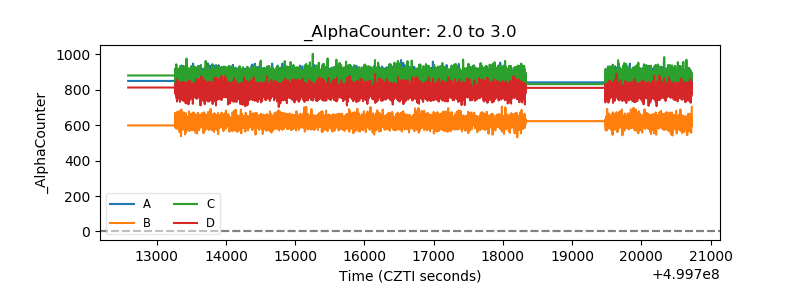 |
| _CPM_Rate | 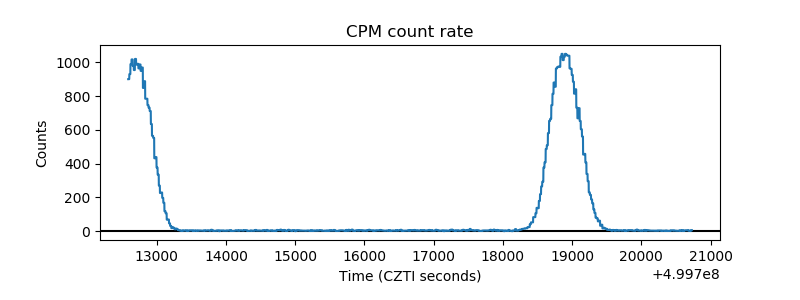 |
| CZT Counter | 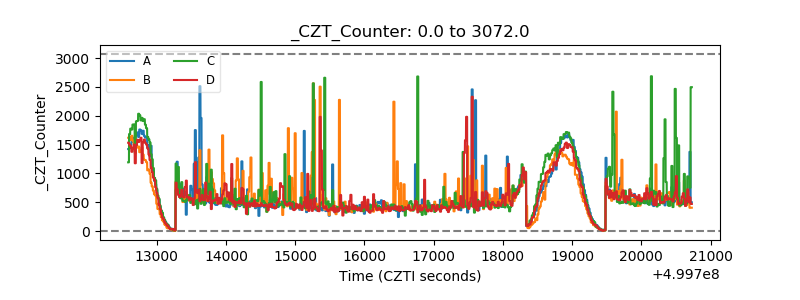 |
| +2.5 Volts monitor | 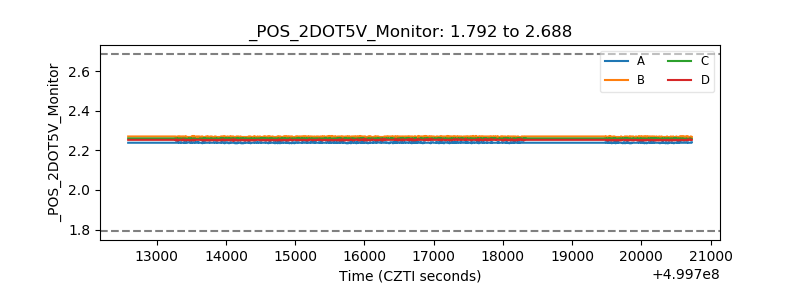 |
| +5 Volts monitor | 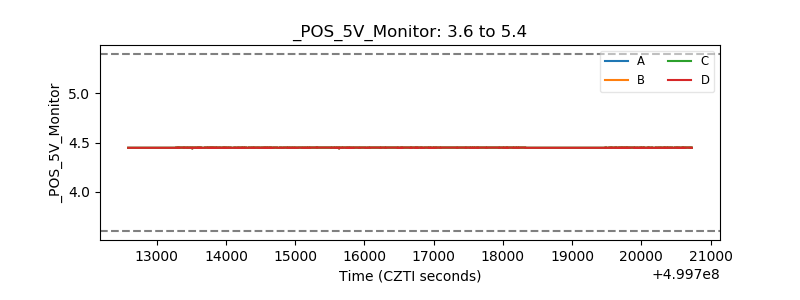 |
| _ROLL_ROT | 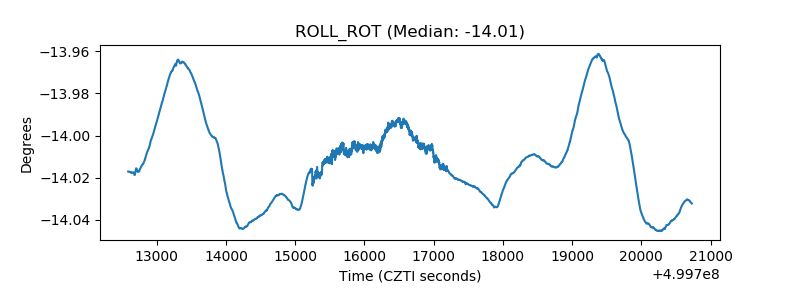 |
| _Roll_DEC | 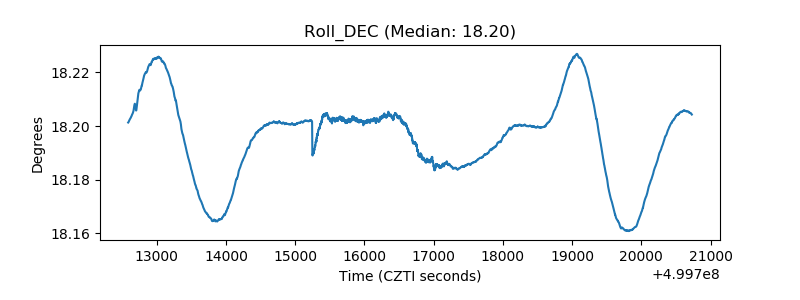 |
| _Roll_RA | 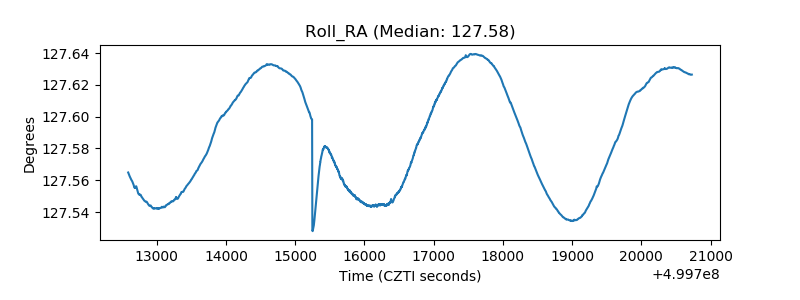 |
| Veto Counter | 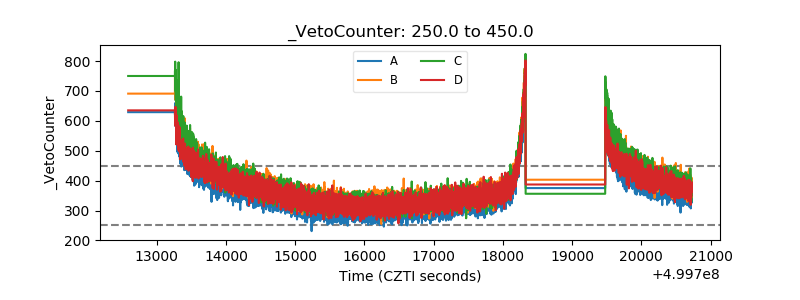 |