| Param | Original file | Final file |
|---|---|---|
| Filename | modeM0/AS1A14_066T07_9000006522_54619cztM0_level2.fits | modeM0/AS1A14_066T07_9000006522_54619cztM0_level2_quad_clean.evt |
| Size (bytes) | 465,854,400 | 93,850,560 |
| Size | 444.3 MB | 89.5 MB |
| Events in quadrant A | 3,396,118 | 621,521 |
| Events in quadrant B | 3,406,945 | 658,507 |
| Events in quadrant C | 4,049,513 | 575,744 |
| Events in quadrant D | 5,901,373 | 545,446 |
| Mode M9 | |||
|---|---|---|---|
| Quadrant | BADHDUFLAG | Total packets | Discarded packets |
| A | 0 | 11 | 0 |
| B | 0 | 11 | 0 |
| C | 0 | 11 | 0 |
| D | 0 | 11 | 0 |
| Mode M0 | |||
|---|---|---|---|
| Quadrant | BADHDUFLAG | Total packets | Discarded packets |
| A | 0 | 14695 | 1 |
| B | 0 | 14762 | 1 |
| C | 0 | 16482 | 1 |
| D | 0 | 22242 | 1 |
| Mode SS | |||
|---|---|---|---|
| Quadrant | BADHDUFLAG | Total packets | Discarded packets |
| A | 0 | 130 | 0 |
| B | 0 | 130 | 0 |
| C | 0 | 130 | 0 |
| D | 0 | 130 | 0 |
| Quadrant | Total seconds | Saturated seconds | Saturation percentage |
|---|---|---|---|
| A | 6314 | 186 | 2.945835% |
| B | 6314 | 238 | 3.769401% |
| C | 6314 | 341 | 5.400697% |
| D | 6315 | 221 | 3.499604% |
Noise dominated data is calculated using 1-second bins in cleaned event files. If a bin has >2000 counts, and if more than 50% of those come from <1% of pixels, then it is considered to be noise-dominated and hence unusable.
| Quadrant | # 1 sec bins | Bins with >0 counts | Bins with >2000 counts | High rate bins dominated by noise | Noise dominated (total time) | Noise dominated (detector-on time) | Marked lightcurve |
|---|---|---|---|---|---|---|---|
| A | 7419 | 6315 | 133 | 133 | 1.79% | 2.11% | 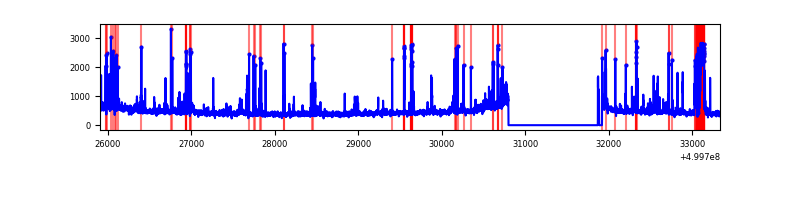 |
| B | 7419 | 6315 | 132 | 132 | 1.78% | 2.09% | 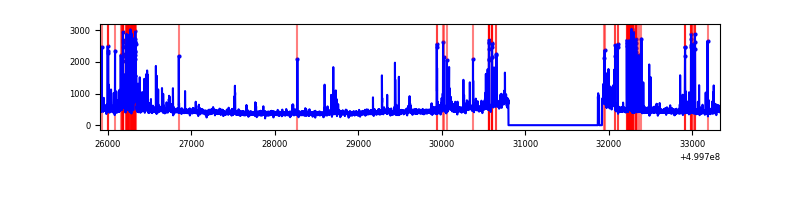 |
| C | 7419 | 6316 | 301 | 301 | 4.06% | 4.77% | 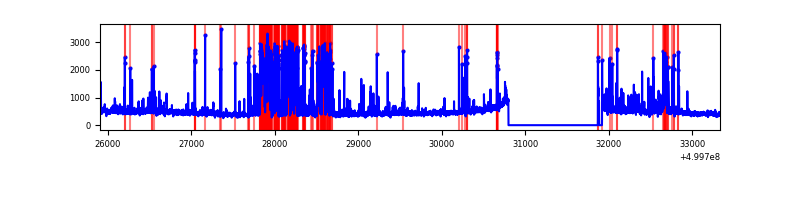 |
| D | 7420 | 6316 | 100 | 100 | 1.35% | 1.58% | 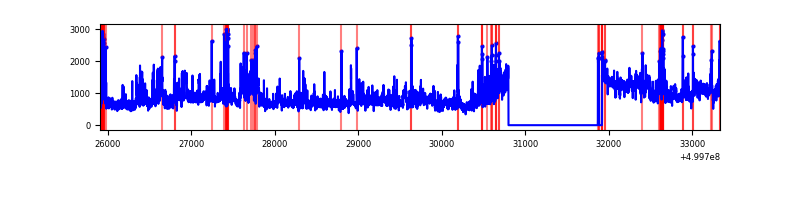 |
Top three noisy pixels from each quadrant. If the there are fewer than three noisy pixels in the level2.evt file, extra rows are filled as -1
| Pixel properties | Quadrant properties | ||||||
|---|---|---|---|---|---|---|---|
| Quadrant | DetID | PixID | Counts | Sigma | Mean | Median | Sigma |
| A | 0 | 8 | 244135 | 1424.63 | 694 | 678 | 170.9 |
| A | 11 | 3 | 168743 | 983.46 | 694 | 678 | 170.9 |
| A | 3 | 14 | 77358 | 448.71 | 694 | 678 | 170.9 |
| B | 1 | 207 | 414674 | 2817.18 | 686 | 660 | 147.0 |
| B | 10 | 247 | 107565 | 727.44 | 686 | 660 | 147.0 |
| B | 5 | 172 | 91546 | 618.44 | 686 | 660 | 147.0 |
| C | 13 | 3 | 1167479 | 6334.55 | 670 | 667 | 184.2 |
| C | 6 | 223 | 55372 | 296.99 | 670 | 667 | 184.2 |
| C | 1 | 16 | 52805 | 283.05 | 670 | 667 | 184.2 |
| D | 2 | 62 | 2340740 | 12072.09 | 667 | 636 | 193.8 |
| D | 2 | 172 | 347423 | 1789.0 | 667 | 636 | 193.8 |
| D | 8 | 160 | 292777 | 1507.09 | 667 | 636 | 193.8 |
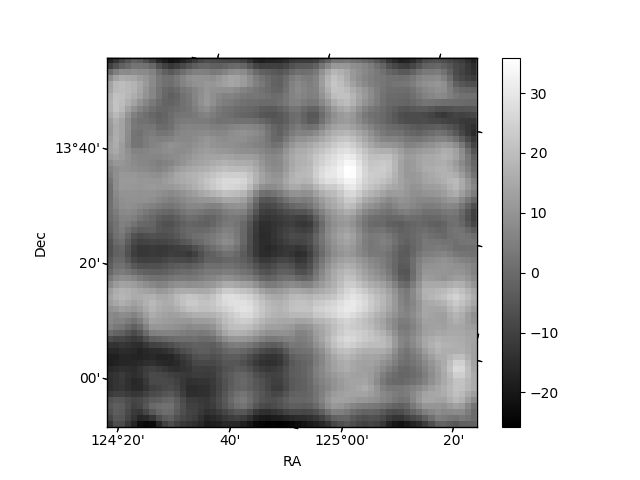
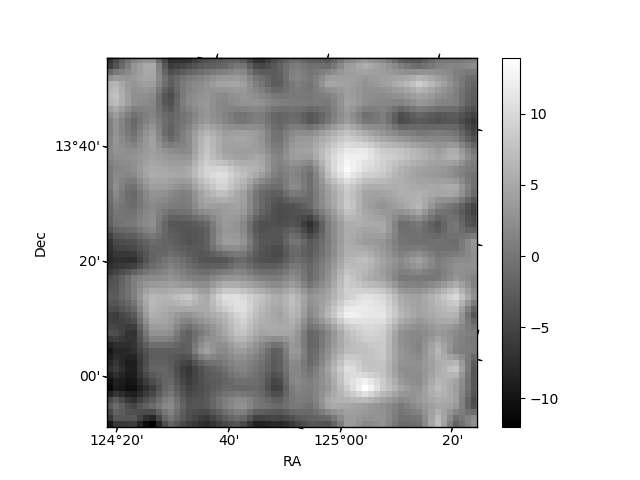
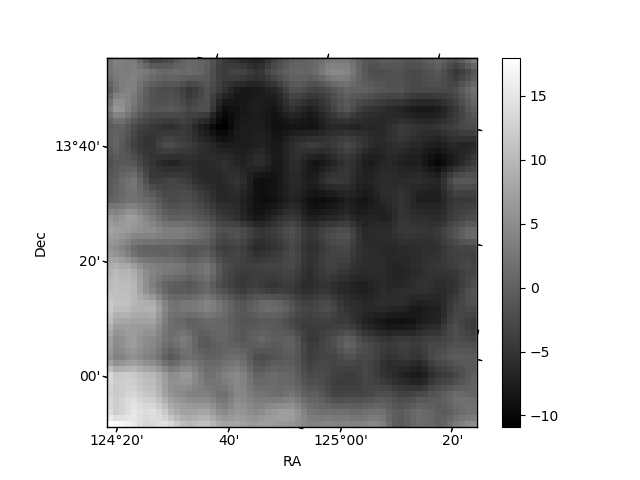
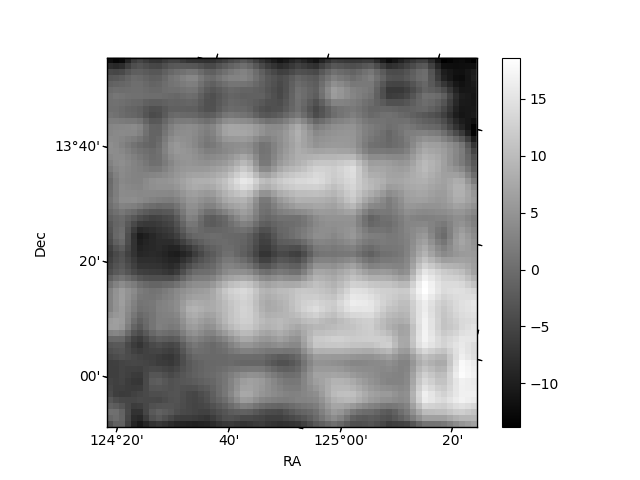
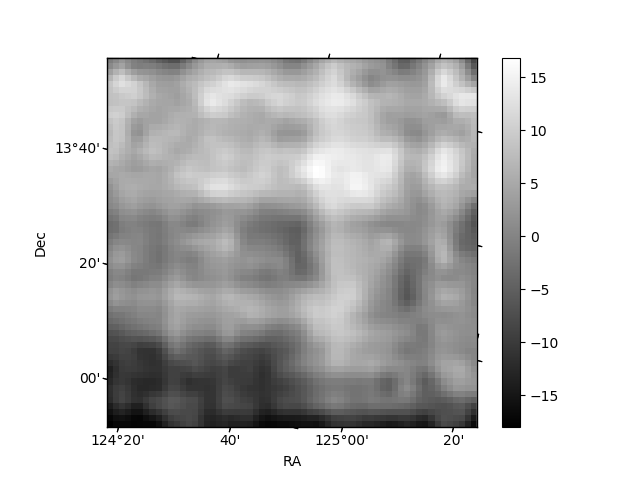
Histogram calculated using DETX and DETY for each event in the final _common_clean file
| Quadrant A | 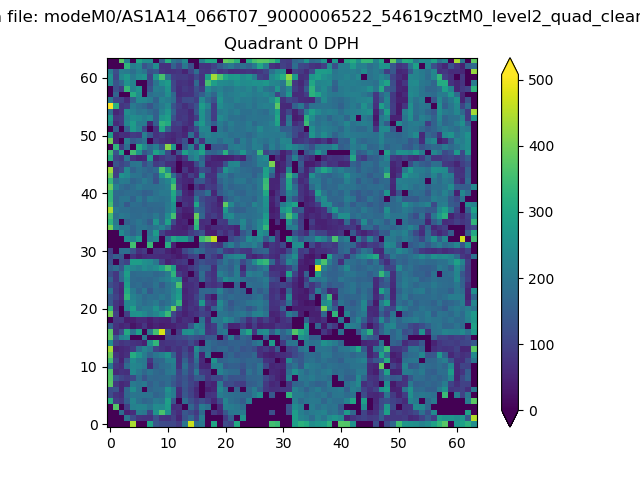 |
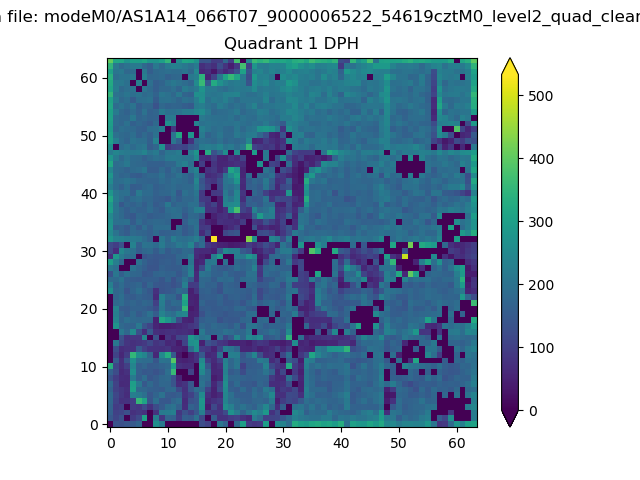 |
Quadrant B |
|---|---|---|---|
| Quadrant D | 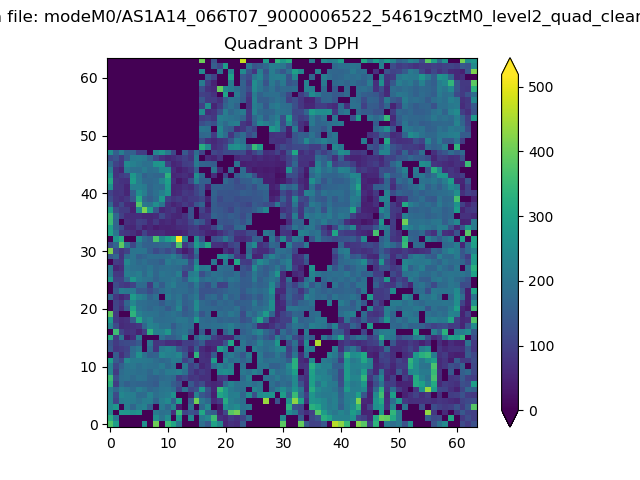 |
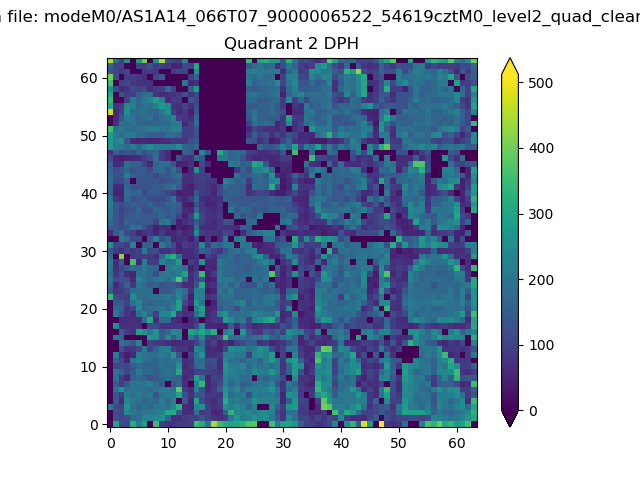 |
Quadrant C |
| Plot type | Count rate plots | Images |
|---|---|---|
| Comparison with Poisson distribution Blue bars denote a histogram of data divided into 1 sec bins. Red curve is a Poisson curve with rate = median count rate of data. |
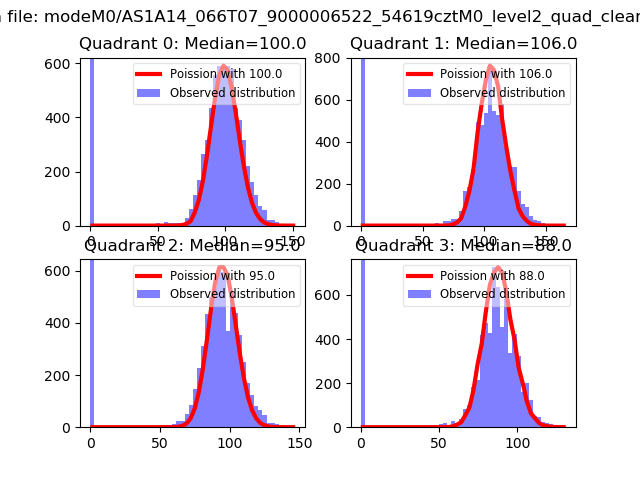 |
 |
| Quadrant-wise count rates Data is divided into 100 sec bins |
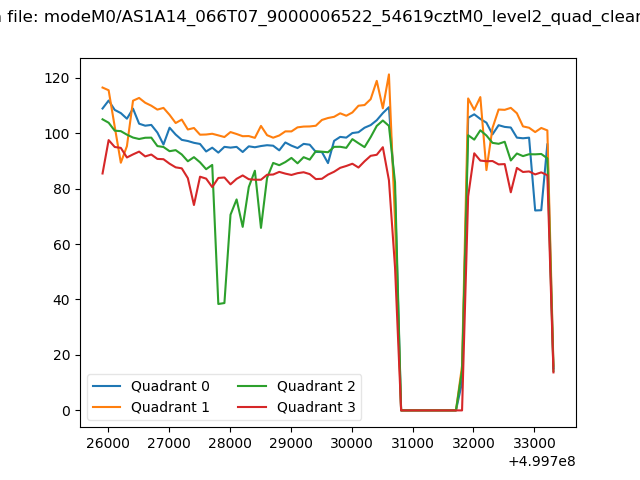 |
|
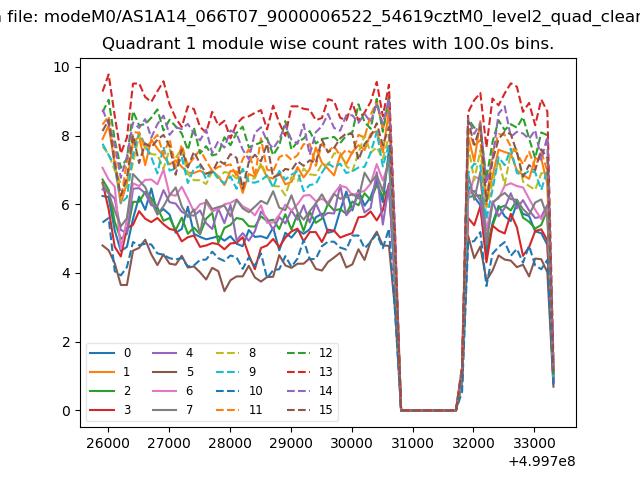
| Module-wise count rates for Quadrant A Data is divided into 100 sec bins |
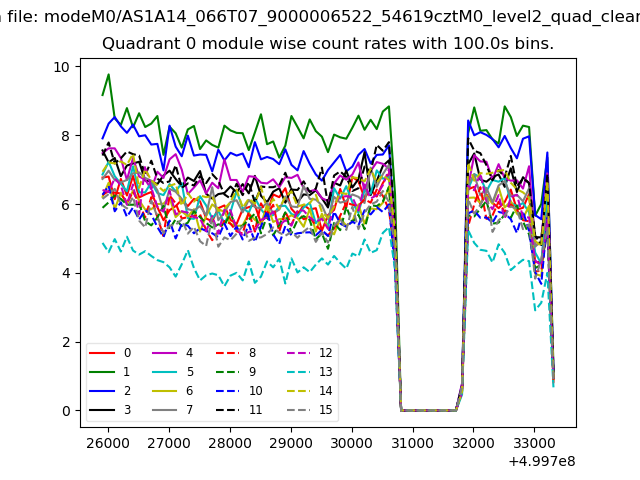 |
 |
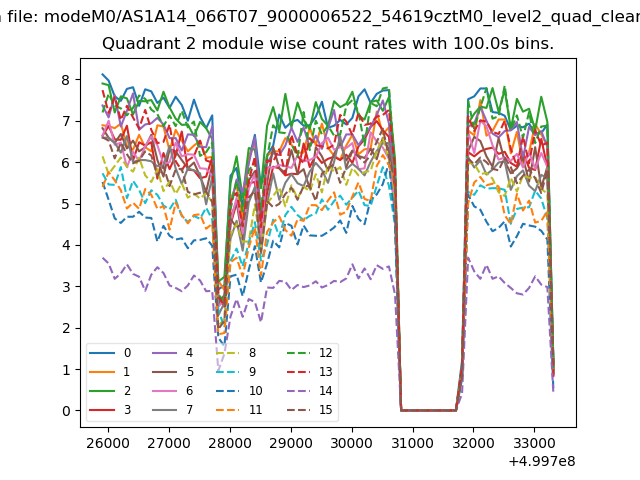
| Module-wise count rates for Quadrant B Data is divided into 100 sec bins |
 |
 |
| Module-wise count rates for Quadrant C Data is divided into 100 sec bins |
 |
 |
| Module-wise count rates for Quadrant D Data is divided into 100 sec bins |
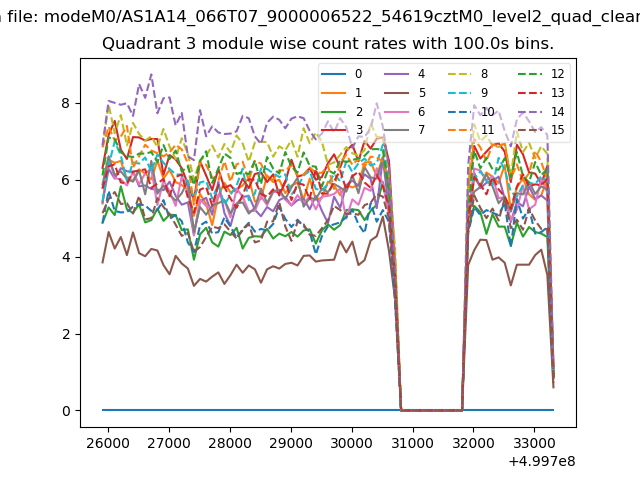 |
 |
| Parameter | Plot |
|---|---|
| CZT HV Monitor | 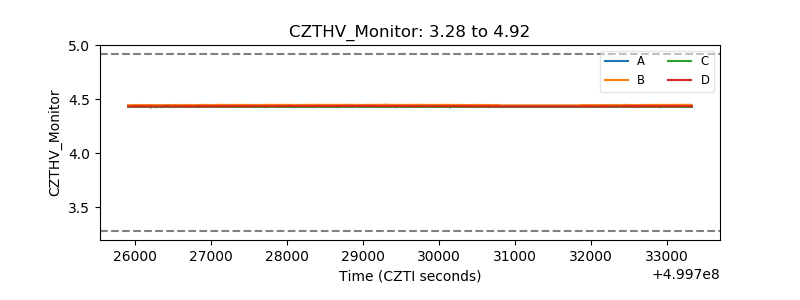 |
| D_VDD | 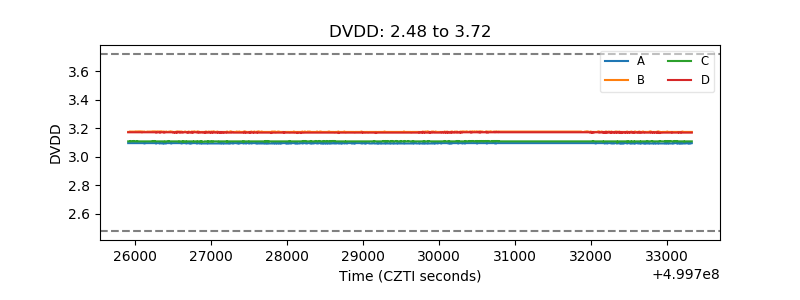 |
| Temperature 1 | 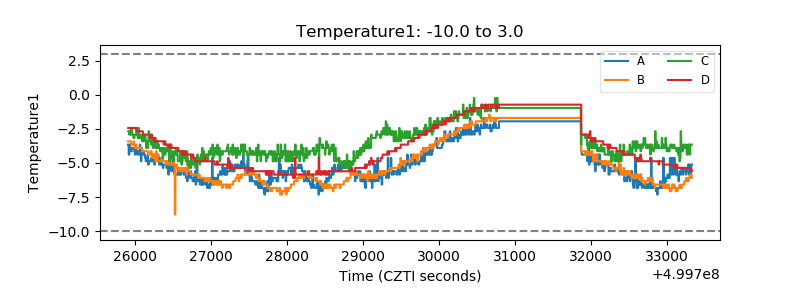 |
| Veto HV Monitor | 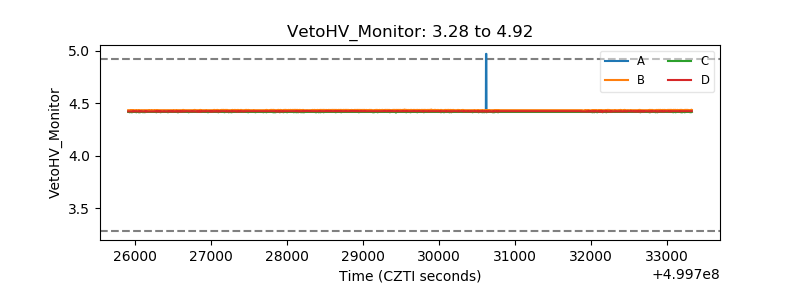 |
| Veto LLD | 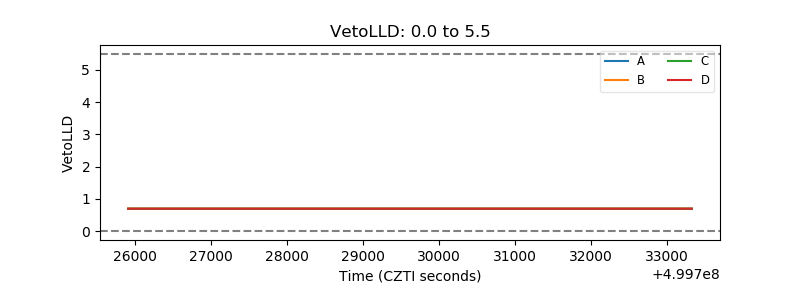 |
| Alpha Counter | 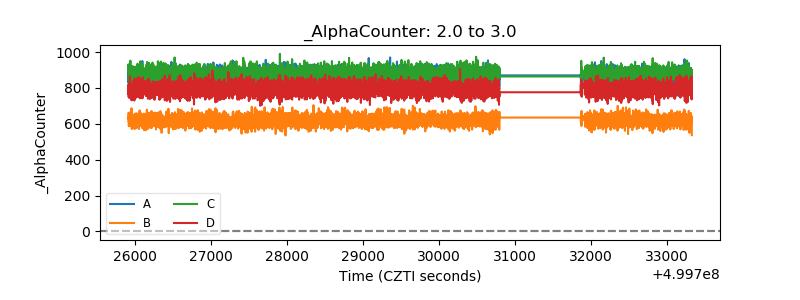 |
| _CPM_Rate | 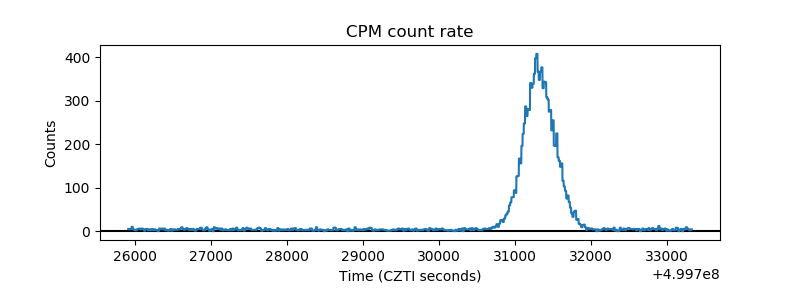 |
| CZT Counter | 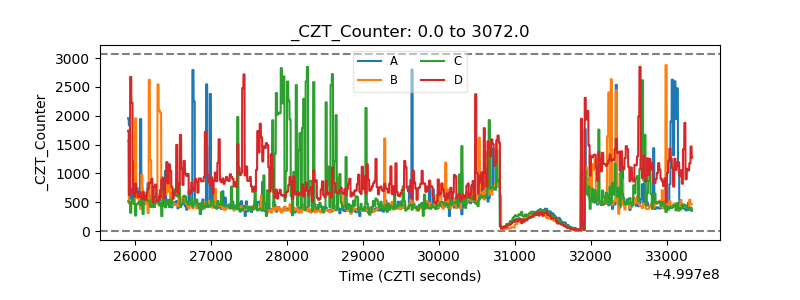 |
| +2.5 Volts monitor | 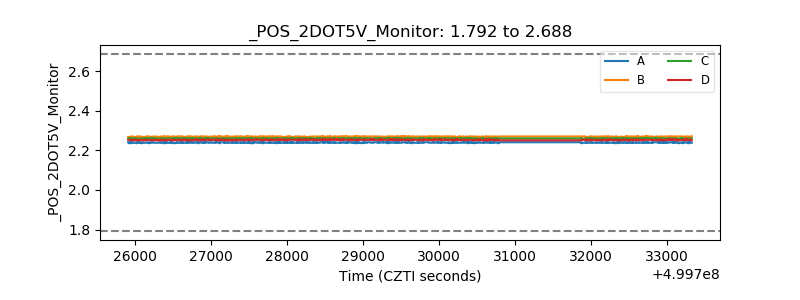 |
| +5 Volts monitor | 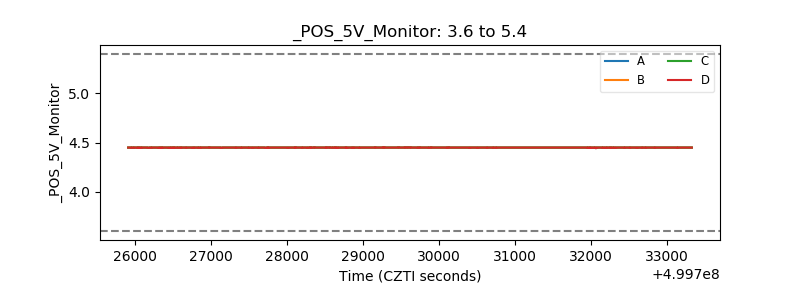 |
| _ROLL_ROT | 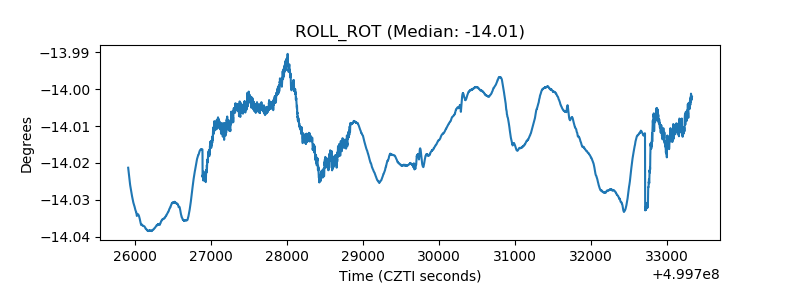 |
| _Roll_DEC | 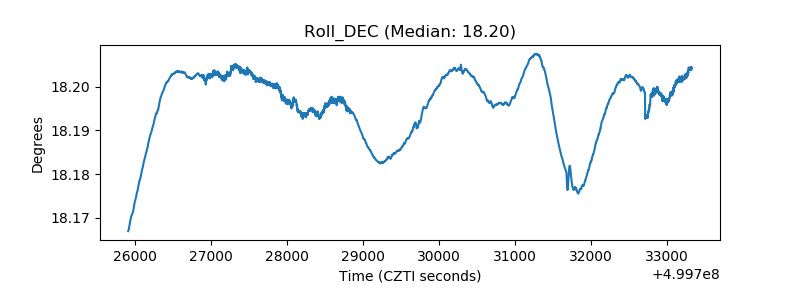 |
| _Roll_RA | 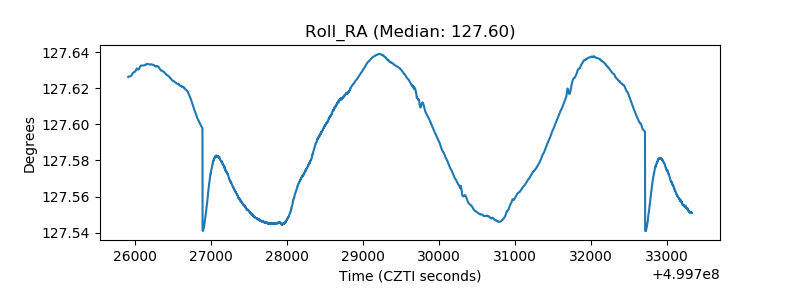 |
| Veto Counter | 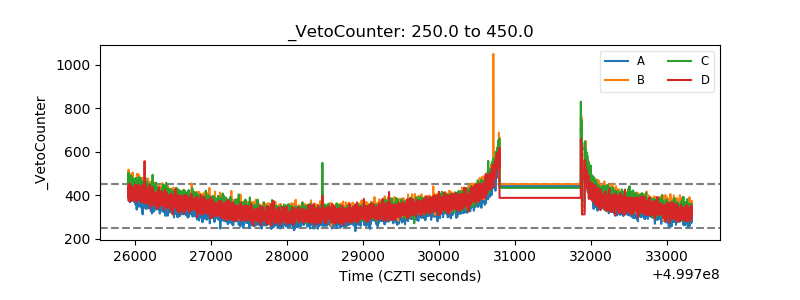 |