| Param | Original file | Final file |
|---|---|---|
| Filename | modeM0/AS1A14_066T07_9000006522_54622cztM0_level2.fits | modeM0/AS1A14_066T07_9000006522_54622cztM0_level2_quad_clean.evt |
| Size (bytes) | 591,183,360 | 115,940,160 |
| Size | 563.8 MB | 110.6 MB |
| Events in quadrant A | 4,161,346 | 758,248 |
| Events in quadrant B | 3,702,537 | 817,632 |
| Events in quadrant C | 5,169,673 | 708,315 |
| Events in quadrant D | 8,223,914 | 664,516 |
| Mode M0 | |||
|---|---|---|---|
| Quadrant | BADHDUFLAG | Total packets | Discarded packets |
| A | 0 | 18357 | 0 |
| B | 0 | 17190 | 0 |
| C | 0 | 21340 | 0 |
| D | 0 | 30194 | 0 |
| Mode SS | |||
|---|---|---|---|
| Quadrant | BADHDUFLAG | Total packets | Discarded packets |
| A | 0 | 162 | 0 |
| B | 0 | 162 | 0 |
| C | 0 | 162 | 0 |
| D | 0 | 162 | 0 |
| Quadrant | Total seconds | Saturated seconds | Saturation percentage |
|---|---|---|---|
| A | 8081 | 123 | 1.522089% |
| B | 8082 | 35 | 0.433061% |
| C | 8082 | 278 | 3.439743% |
| D | 8082 | 291 | 3.600594% |
Noise dominated data is calculated using 1-second bins in cleaned event files. If a bin has >2000 counts, and if more than 50% of those come from <1% of pixels, then it is considered to be noise-dominated and hence unusable.
| Quadrant | # 1 sec bins | Bins with >0 counts | Bins with >2000 counts | High rate bins dominated by noise | Noise dominated (total time) | Noise dominated (detector-on time) | Marked lightcurve |
|---|---|---|---|---|---|---|---|
| A | 8081 | 8081 | 119 | 119 | 1.47% | 1.47% | 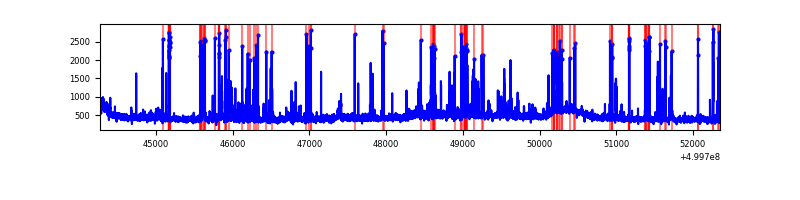 |
| B | 8082 | 8082 | 10 | 10 | 0.12% | 0.12% | 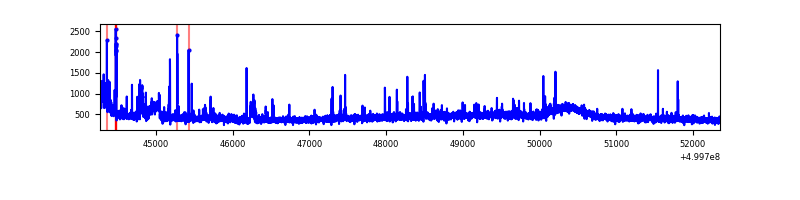 |
| C | 8082 | 8082 | 262 | 262 | 3.24% | 3.24% | 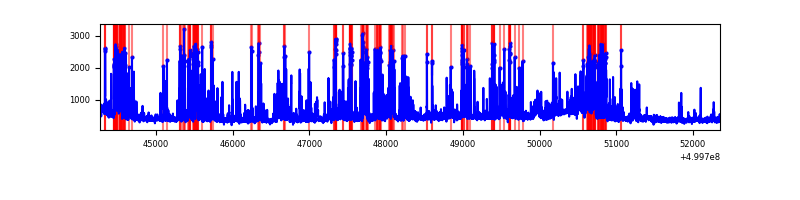 |
| D | 8082 | 8082 | 233 | 233 | 2.88% | 2.88% | 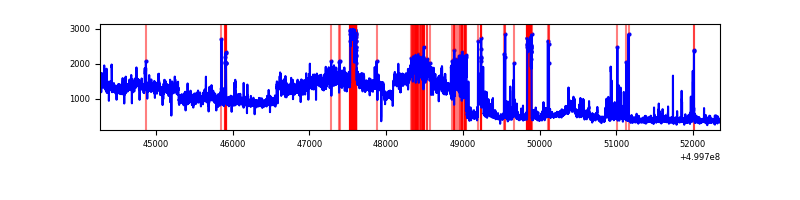 |
Top three noisy pixels from each quadrant. If the there are fewer than three noisy pixels in the level2.evt file, extra rows are filled as -1
| Pixel properties | Quadrant properties | ||||||
|---|---|---|---|---|---|---|---|
| Quadrant | DetID | PixID | Counts | Sigma | Mean | Median | Sigma |
| A | 11 | 3 | 264953 | 1241.54 | 864 | 844 | 212.7 |
| A | 0 | 8 | 240225 | 1125.29 | 864 | 844 | 212.7 |
| A | 5 | 243 | 71253 | 330.98 | 864 | 844 | 212.7 |
| B | 5 | 172 | 174048 | 916.23 | 865 | 833 | 189.1 |
| B | 10 | 247 | 59294 | 309.23 | 865 | 833 | 189.1 |
| B | 10 | 14 | 31137 | 160.29 | 865 | 833 | 189.1 |
| C | 13 | 3 | 1385143 | 6041.33 | 833 | 827 | 229.1 |
| C | 12 | 249 | 133856 | 580.56 | 833 | 827 | 229.1 |
| C | 14 | 96 | 76232 | 329.08 | 833 | 827 | 229.1 |
| D | 2 | 62 | 4241073 | 18025.73 | 821 | 782 | 235.2 |
| D | 2 | 172 | 347009 | 1471.83 | 821 | 782 | 235.2 |
| D | 1 | 232 | 181768 | 769.38 | 821 | 782 | 235.2 |
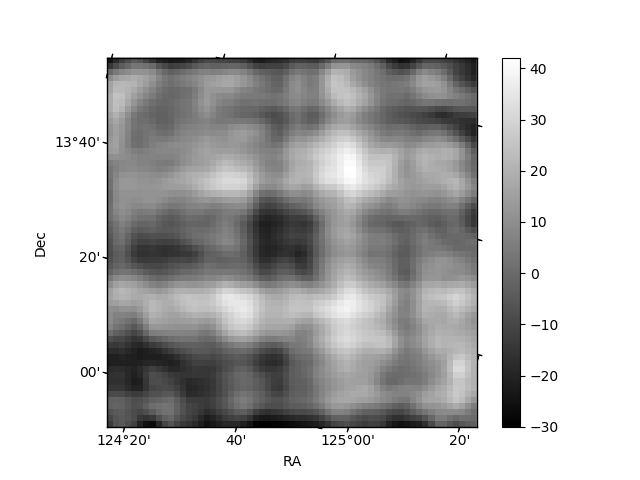
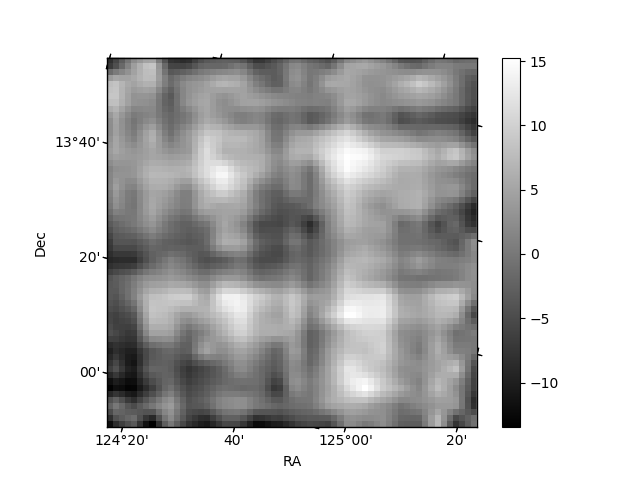
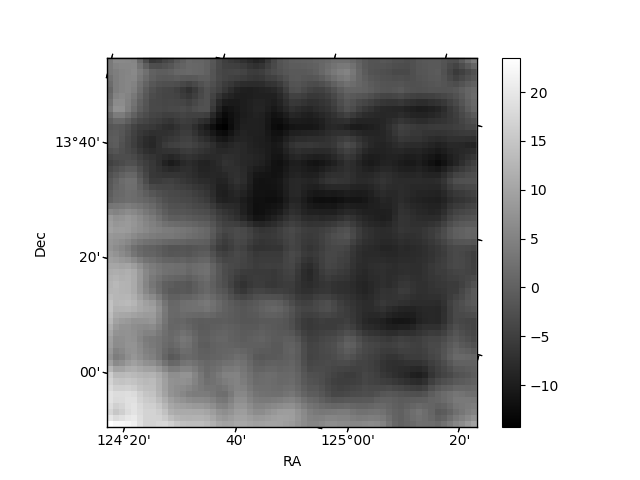
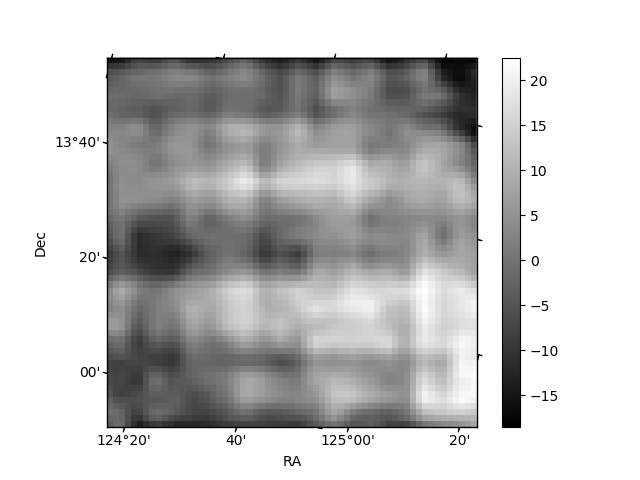
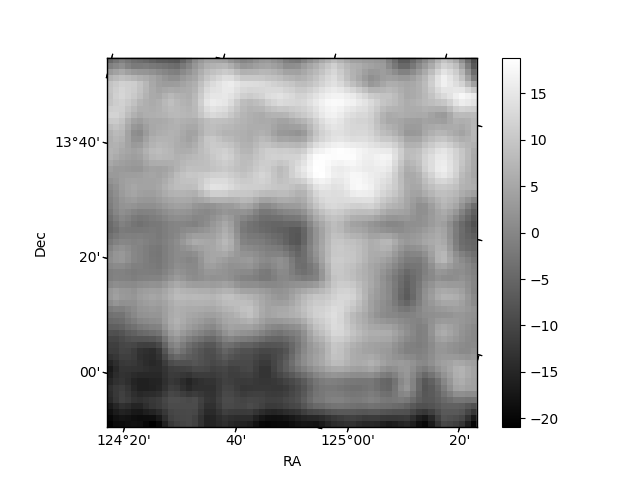
Histogram calculated using DETX and DETY for each event in the final _common_clean file
| Quadrant A | 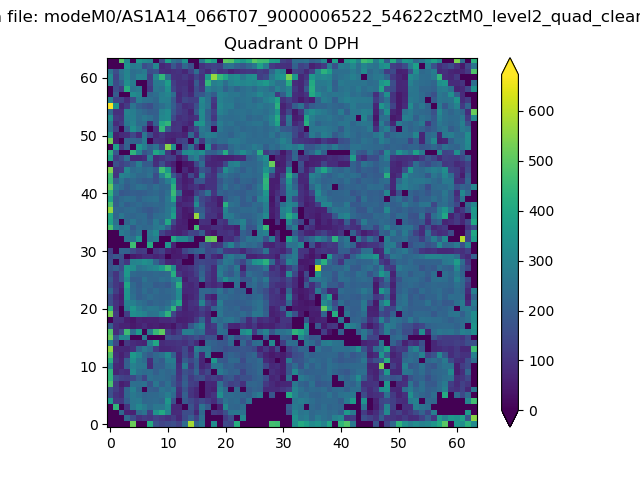 |
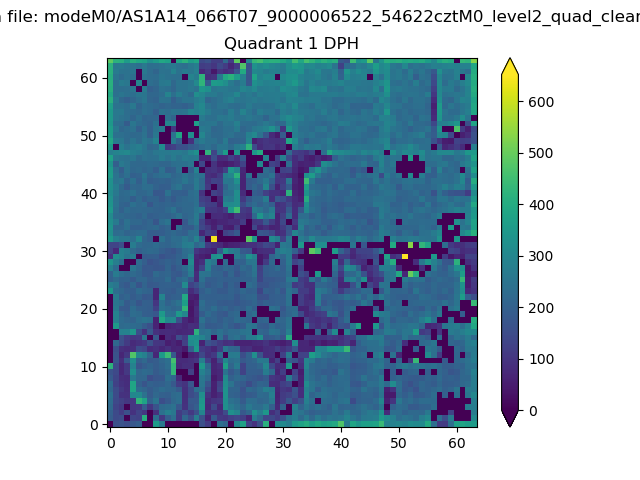 |
Quadrant B |
|---|---|---|---|
| Quadrant D | 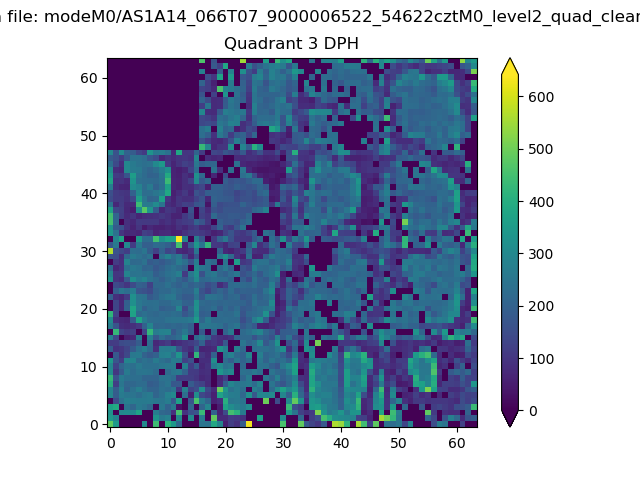 |
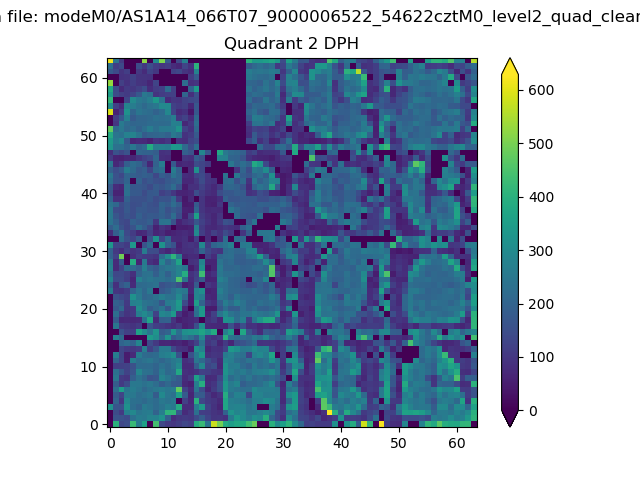 |
Quadrant C |
| Plot type | Count rate plots | Images |
|---|---|---|
| Comparison with Poisson distribution Blue bars denote a histogram of data divided into 1 sec bins. Red curve is a Poisson curve with rate = median count rate of data. |
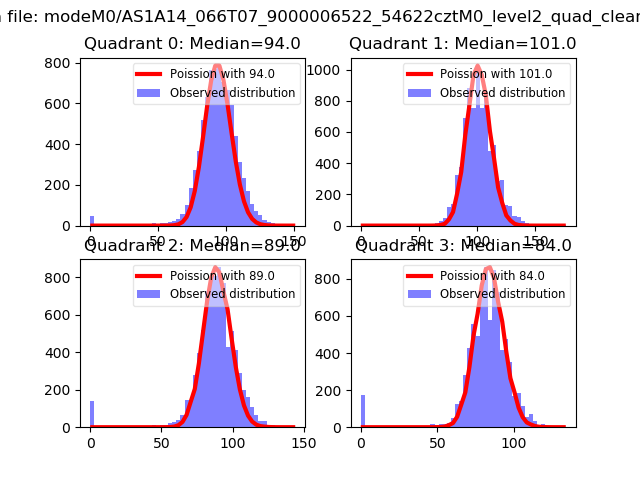 |
 |
| Quadrant-wise count rates Data is divided into 100 sec bins |
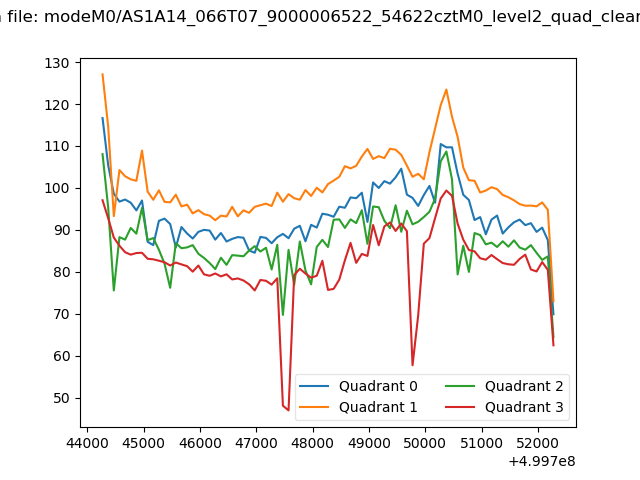 |
|
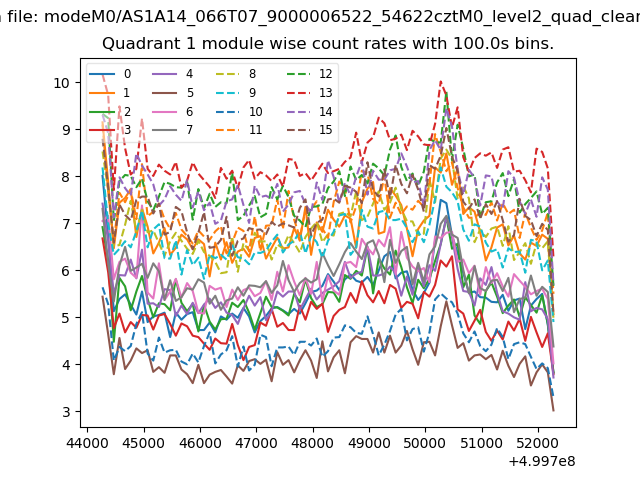
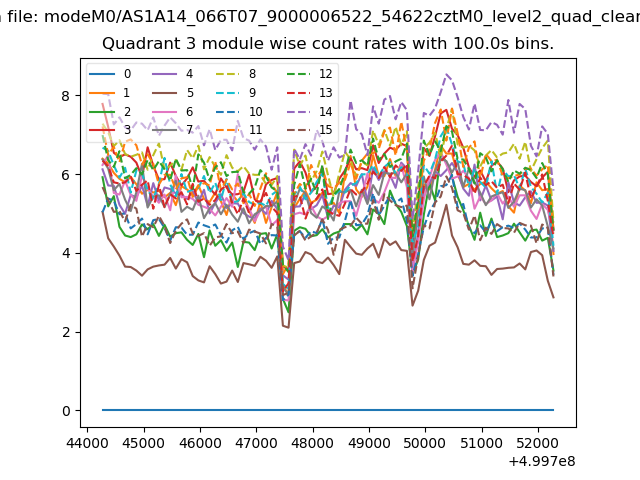
| Module-wise count rates for Quadrant A Data is divided into 100 sec bins |
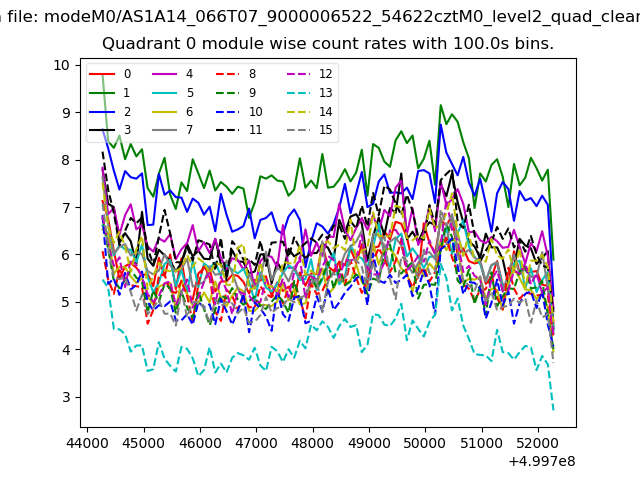 |
 |
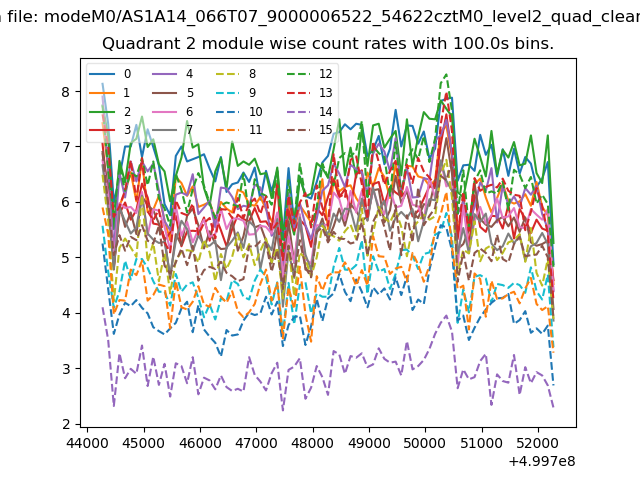
| Module-wise count rates for Quadrant B Data is divided into 100 sec bins |
 |
 |
| Module-wise count rates for Quadrant C Data is divided into 100 sec bins |
 |
 |
| Module-wise count rates for Quadrant D Data is divided into 100 sec bins |
 |
 |
| Parameter | Plot |
|---|---|
| CZT HV Monitor | 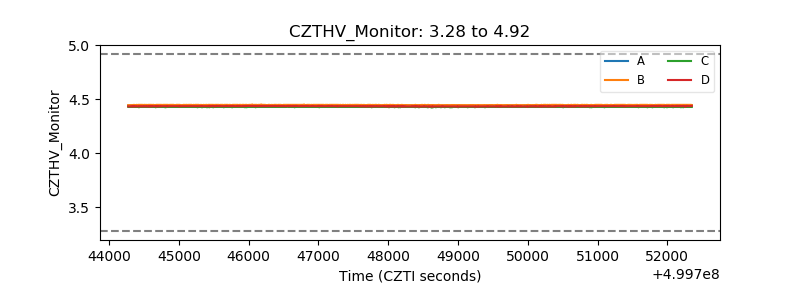 |
| D_VDD | 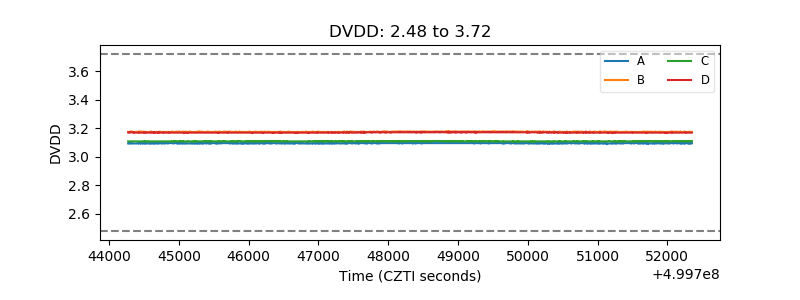 |
| Temperature 1 | 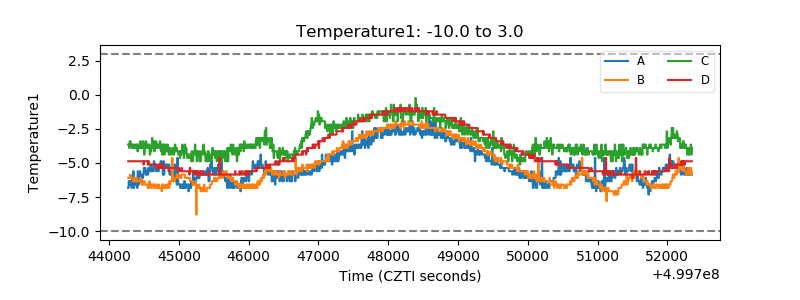 |
| Veto HV Monitor | 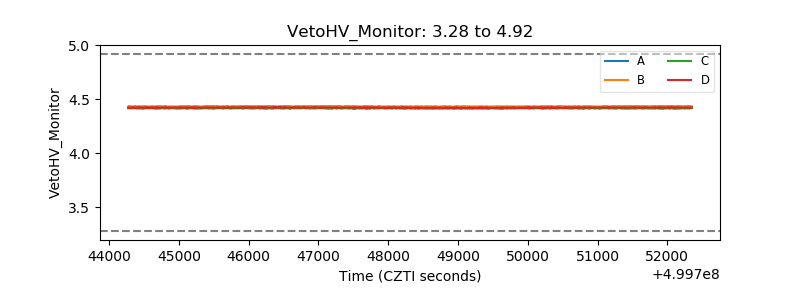 |
| Veto LLD | 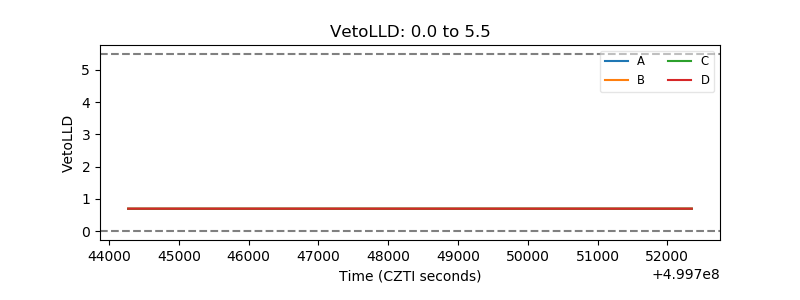 |
| Alpha Counter | 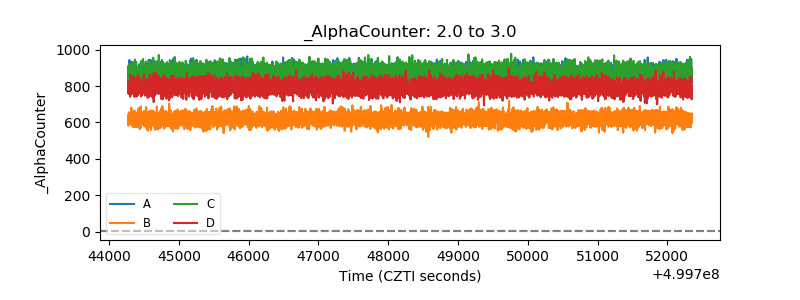 |
| _CPM_Rate | 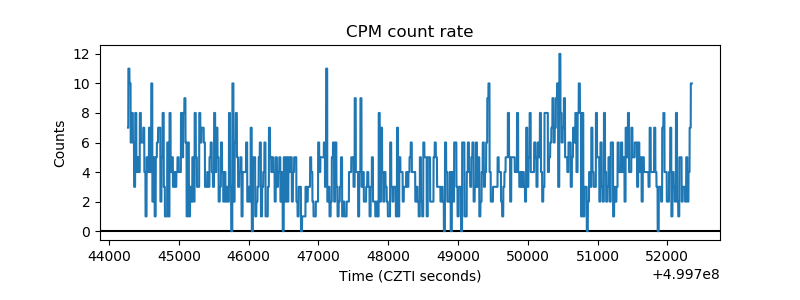 |
| CZT Counter | 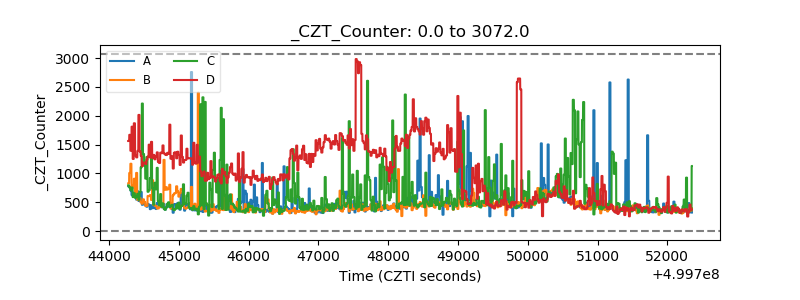 |
| +2.5 Volts monitor | 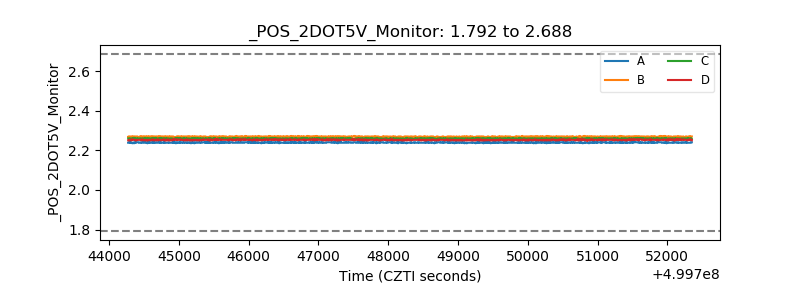 |
| +5 Volts monitor | 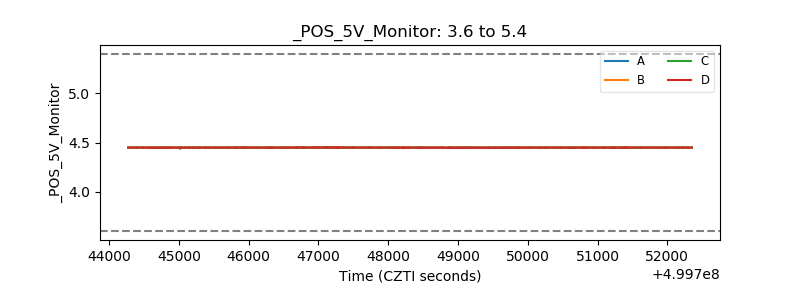 |
| _ROLL_ROT | 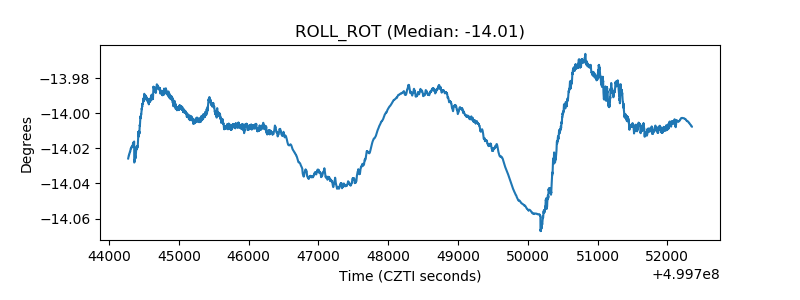 |
| _Roll_DEC | 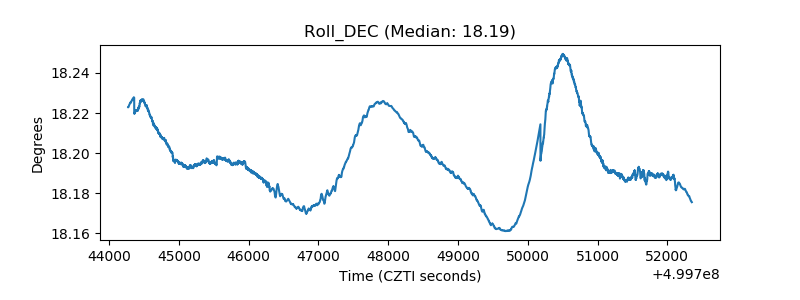 |
| _Roll_RA | 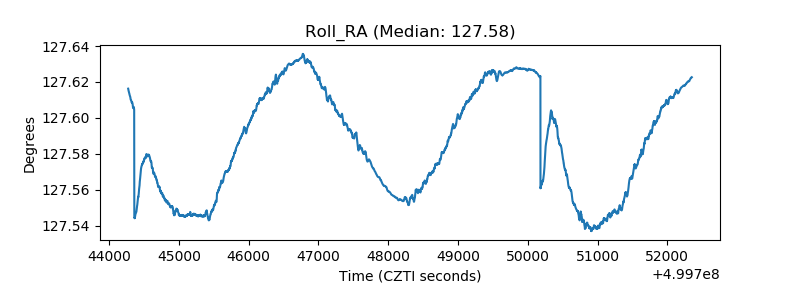 |
| Veto Counter | 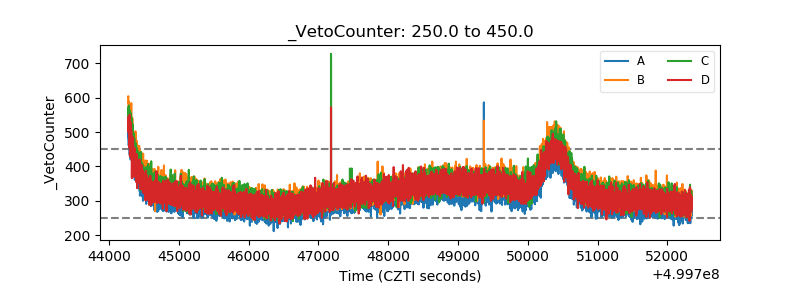 |