| Param | Original file | Final file |
|---|---|---|
| Filename | modeM0/AS1A14_066T07_9000006522_54623cztM0_level2.fits | modeM0/AS1A14_066T07_9000006522_54623cztM0_level2_quad_clean.evt |
| Size (bytes) | 491,241,600 | 128,545,920 |
| Size | 468.5 MB | 122.6 MB |
| Events in quadrant A | 4,528,838 | 837,500 |
| Events in quadrant B | 3,943,566 | 900,793 |
| Events in quadrant C | 4,524,162 | 790,902 |
| Events in quadrant D | 4,492,964 | 743,232 |
| Mode M0 | |||
|---|---|---|---|
| Quadrant | BADHDUFLAG | Total packets | Discarded packets |
| A | 0 | 20045 | 0 |
| B | 0 | 18487 | 0 |
| C | 0 | 20253 | 0 |
| D | 0 | 19973 | 0 |
| Mode SS | |||
|---|---|---|---|
| Quadrant | BADHDUFLAG | Total packets | Discarded packets |
| A | 0 | 178 | 0 |
| B | 0 | 178 | 0 |
| C | 0 | 178 | 0 |
| D | 0 | 178 | 0 |
| Quadrant | Total seconds | Saturated seconds | Saturation percentage |
|---|---|---|---|
| A | 8933 | 136 | 1.522445% |
| B | 8934 | 19 | 0.212671% |
| C | 8934 | 114 | 1.276024% |
| D | 8934 | 159 | 1.779718% |
Noise dominated data is calculated using 1-second bins in cleaned event files. If a bin has >2000 counts, and if more than 50% of those come from <1% of pixels, then it is considered to be noise-dominated and hence unusable.
| Quadrant | # 1 sec bins | Bins with >0 counts | Bins with >2000 counts | High rate bins dominated by noise | Noise dominated (total time) | Noise dominated (detector-on time) | Marked lightcurve |
|---|---|---|---|---|---|---|---|
| A | 8933 | 8933 | 124 | 124 | 1.39% | 1.39% | 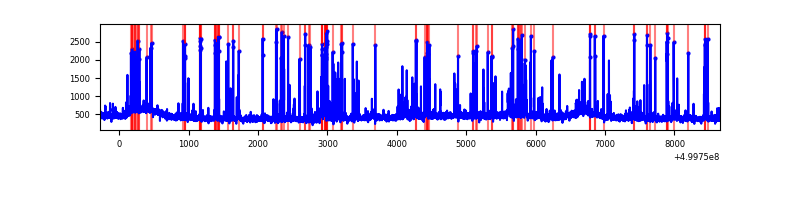 |
| B | 8933 | 8933 | 3 | 3 | 0.03% | 0.03% | 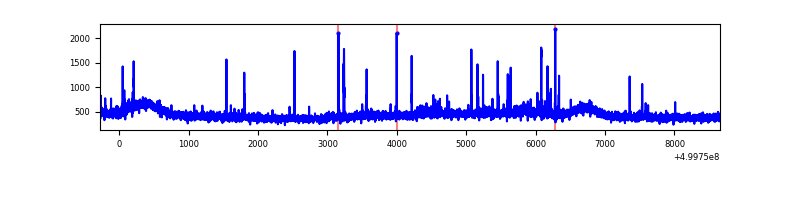 |
| C | 8934 | 8934 | 100 | 100 | 1.12% | 1.12% | 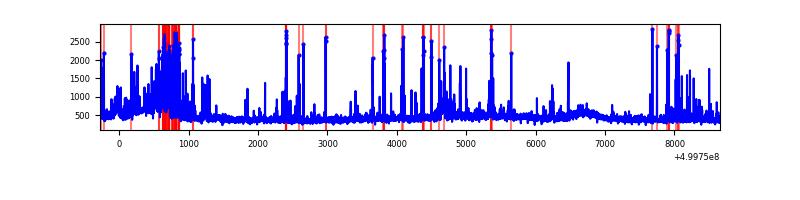 |
| D | 8934 | 8934 | 171 | 171 | 1.91% | 1.91% | 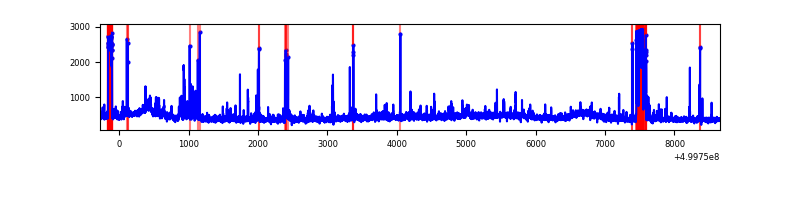 |
Top three noisy pixels from each quadrant. If the there are fewer than three noisy pixels in the level2.evt file, extra rows are filled as -1
| Pixel properties | Quadrant properties | ||||||
|---|---|---|---|---|---|---|---|
| Quadrant | DetID | PixID | Counts | Sigma | Mean | Median | Sigma |
| A | 11 | 3 | 366114 | 1531.97 | 958 | 934 | 238.4 |
| A | 0 | 8 | 137195 | 571.63 | 958 | 934 | 238.4 |
| A | 13 | 248 | 58004 | 239.41 | 958 | 934 | 238.4 |
| B | 10 | 247 | 67936 | 321.59 | 956 | 922 | 208.4 |
| B | 10 | 14 | 42678 | 200.38 | 956 | 922 | 208.4 |
| B | 12 | 111 | 26051 | 120.59 | 956 | 922 | 208.4 |
| C | 13 | 3 | 515693 | 2000.34 | 932 | 927 | 257.3 |
| C | 12 | 249 | 103028 | 396.76 | 932 | 927 | 257.3 |
| C | 14 | 96 | 66609 | 255.23 | 932 | 927 | 257.3 |
| D | 2 | 252 | 339406 | 1293.05 | 919 | 878 | 261.8 |
| D | 2 | 62 | 187583 | 713.14 | 919 | 878 | 261.8 |
| D | 2 | 172 | 167101 | 634.91 | 919 | 878 | 261.8 |
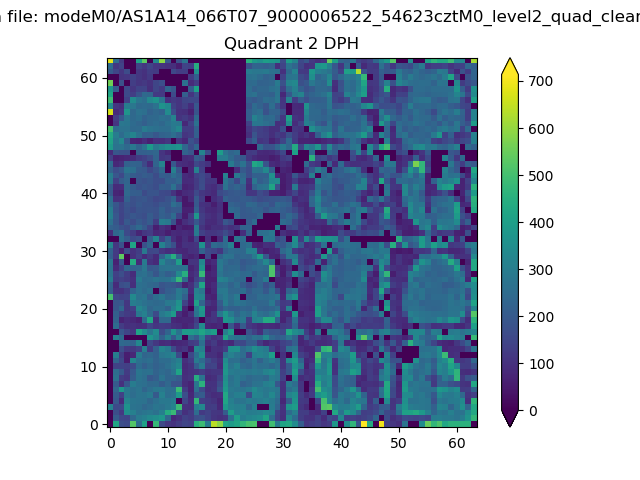
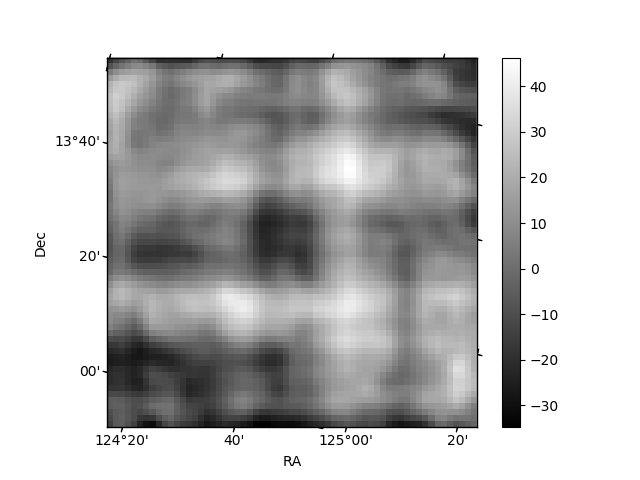
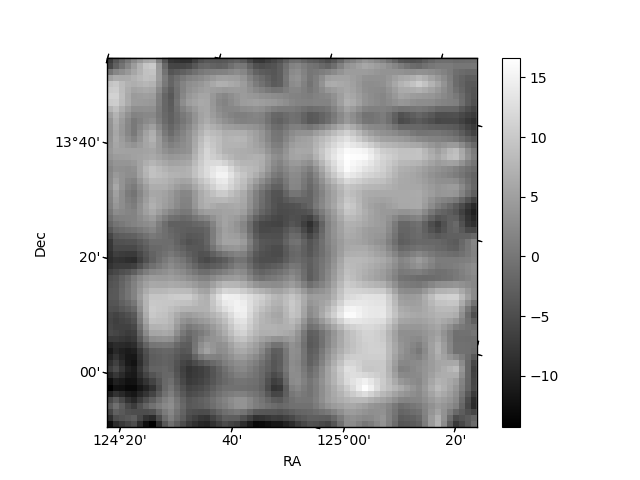
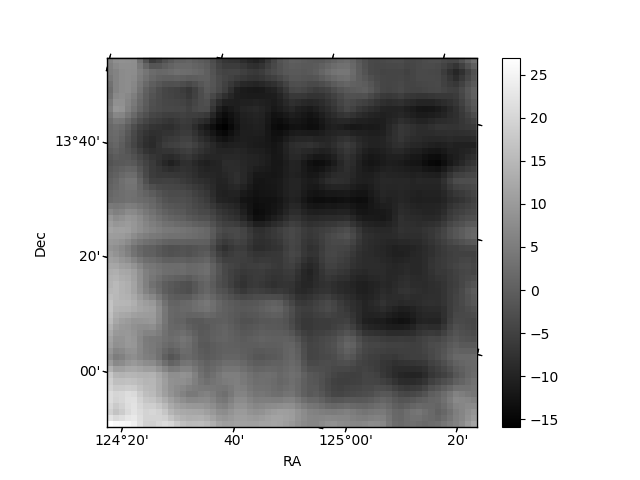
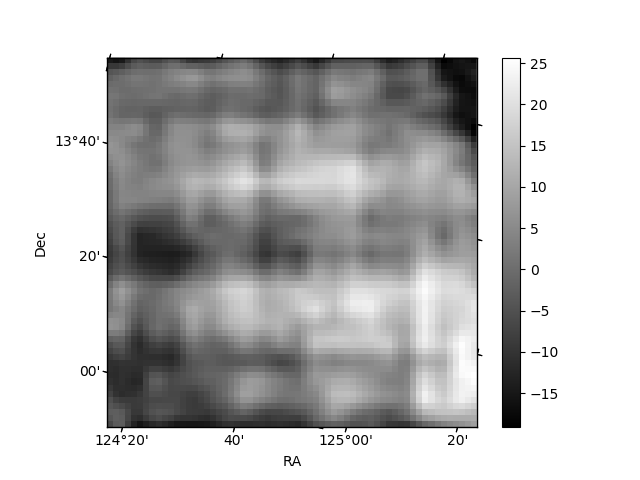
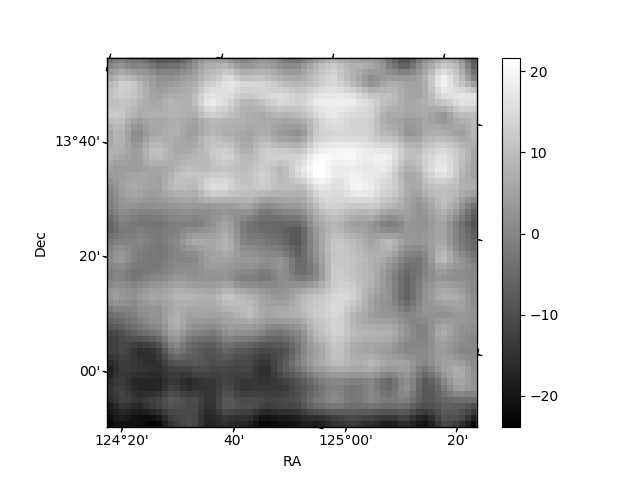
Histogram calculated using DETX and DETY for each event in the final _common_clean file
| Quadrant A | 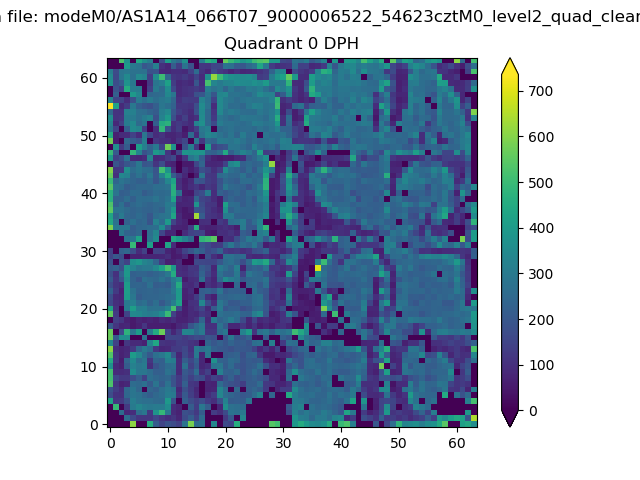 |
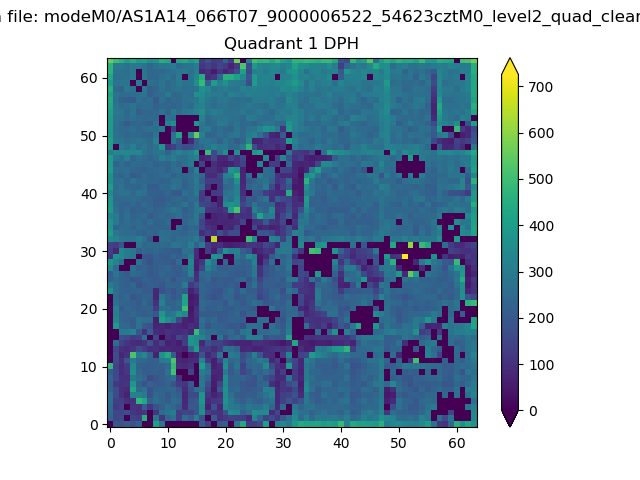 |
Quadrant B |
|---|---|---|---|
| Quadrant D | 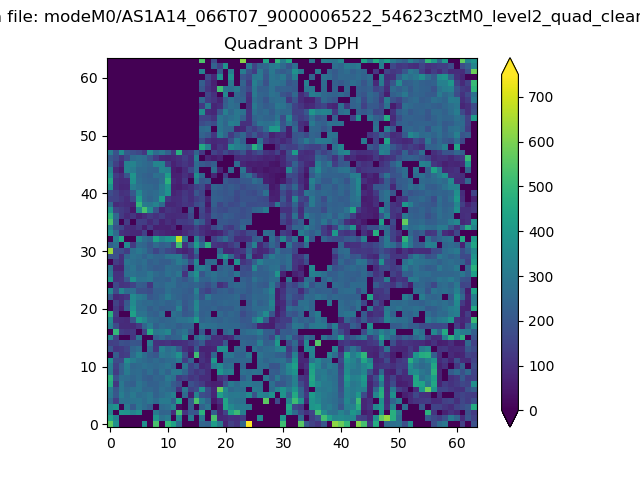 |
 |
Quadrant C |
| Plot type | Count rate plots | Images |
|---|---|---|
| Comparison with Poisson distribution Blue bars denote a histogram of data divided into 1 sec bins. Red curve is a Poisson curve with rate = median count rate of data. |
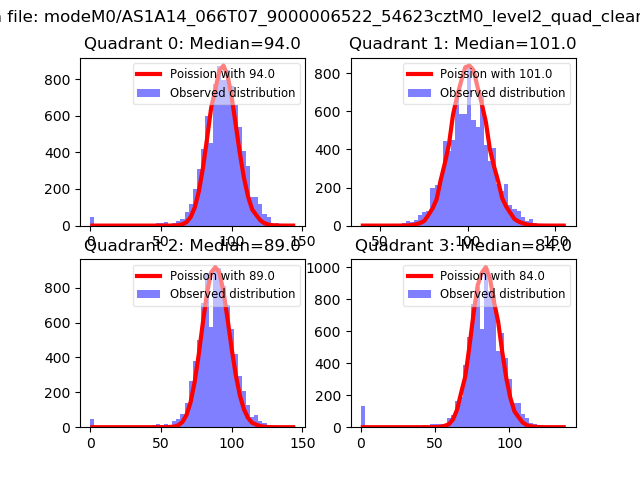 |
 |
| Quadrant-wise count rates Data is divided into 100 sec bins |
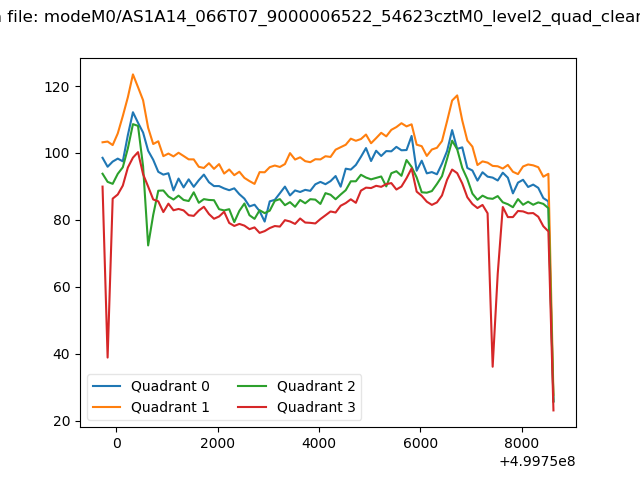 |
|
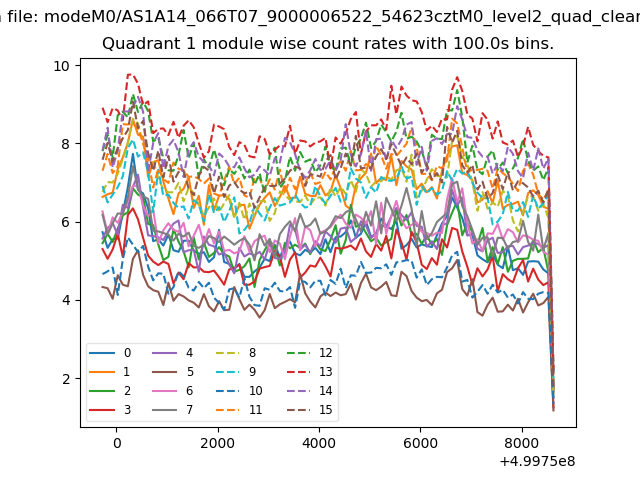
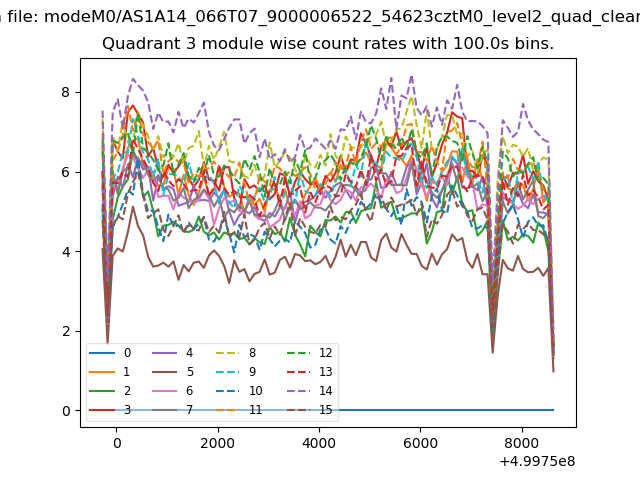
| Module-wise count rates for Quadrant A Data is divided into 100 sec bins |
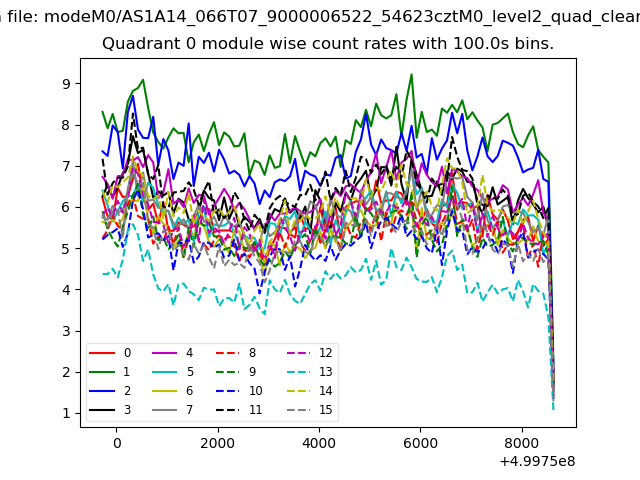 |
 |
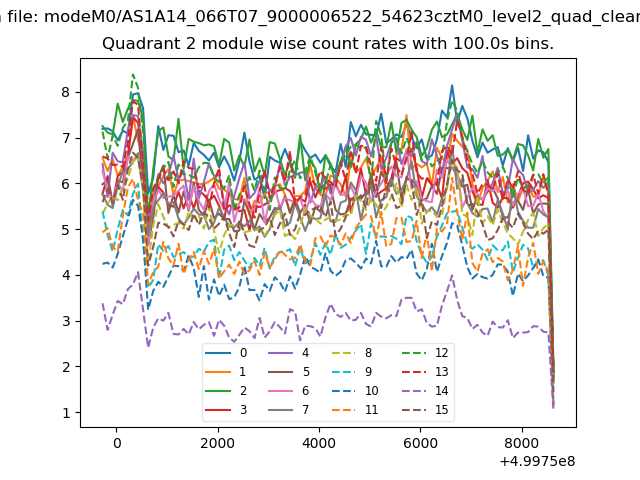
| Module-wise count rates for Quadrant B Data is divided into 100 sec bins |
 |
 |
| Module-wise count rates for Quadrant C Data is divided into 100 sec bins |
 |
 |
| Module-wise count rates for Quadrant D Data is divided into 100 sec bins |
 |
 |
| Parameter | Plot |
|---|---|
| CZT HV Monitor | 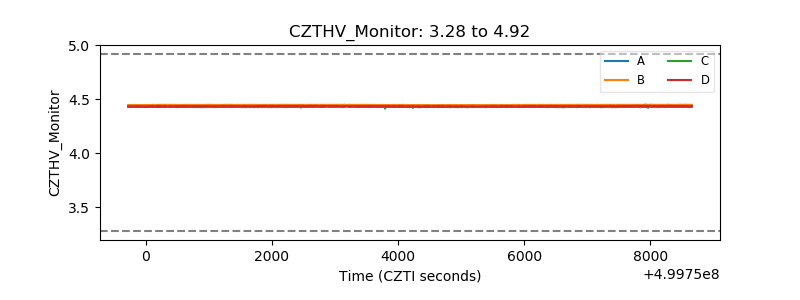 |
| D_VDD | 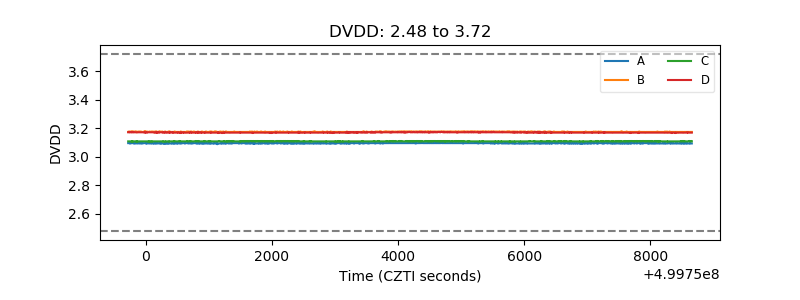 |
| Temperature 1 | 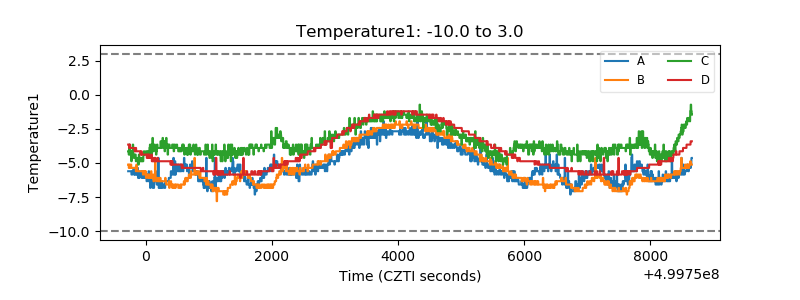 |
| Veto HV Monitor | 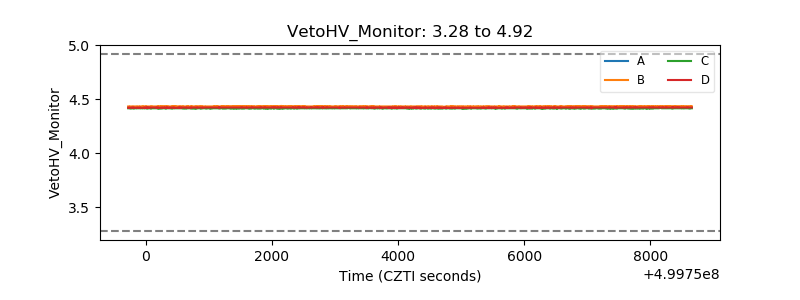 |
| Veto LLD | 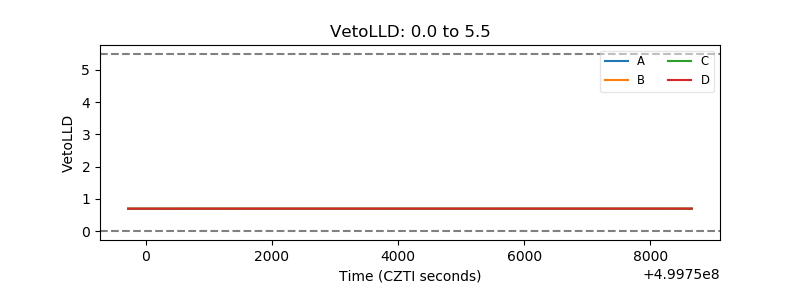 |
| Alpha Counter | 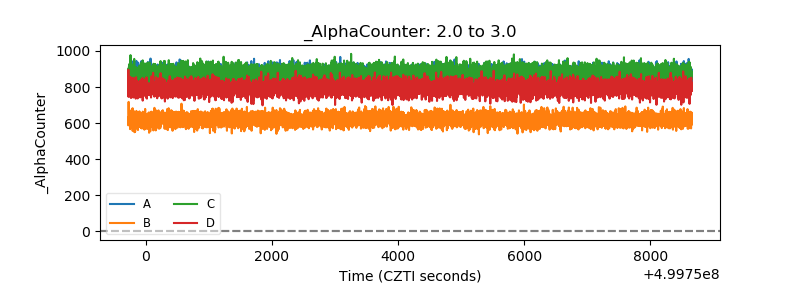 |
| _CPM_Rate | 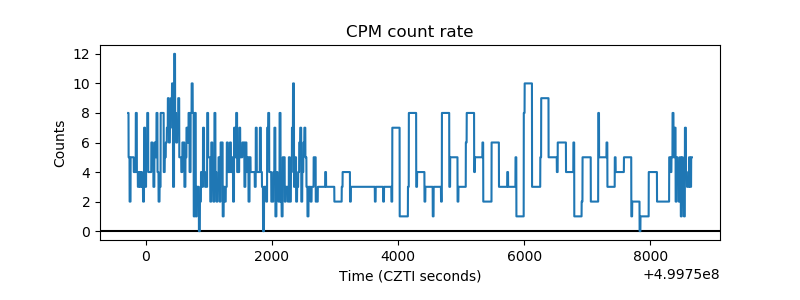 |
| CZT Counter | 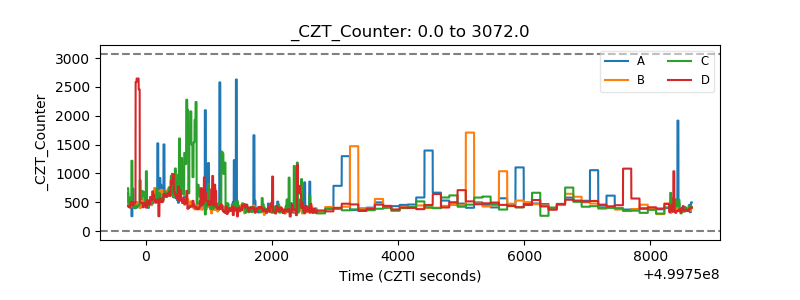 |
| +2.5 Volts monitor | 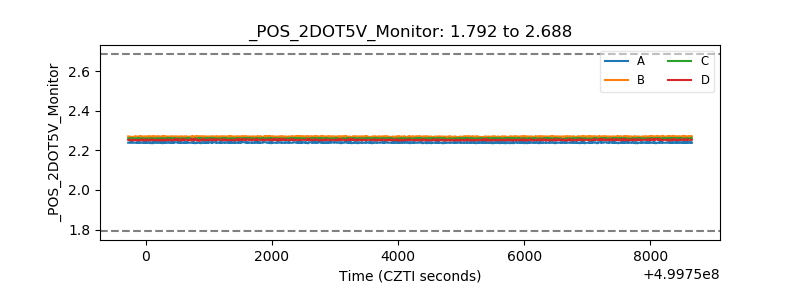 |
| +5 Volts monitor | 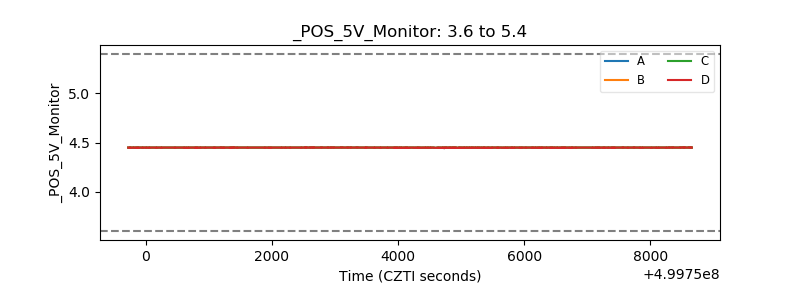 |
| _ROLL_ROT | 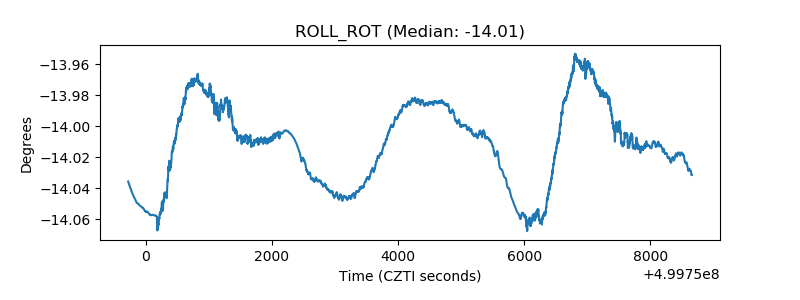 |
| _Roll_DEC | 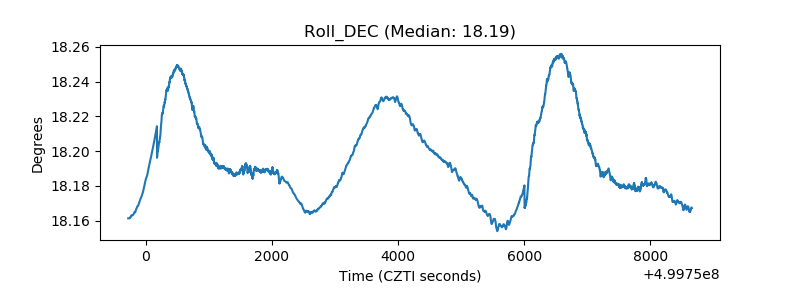 |
| _Roll_RA | 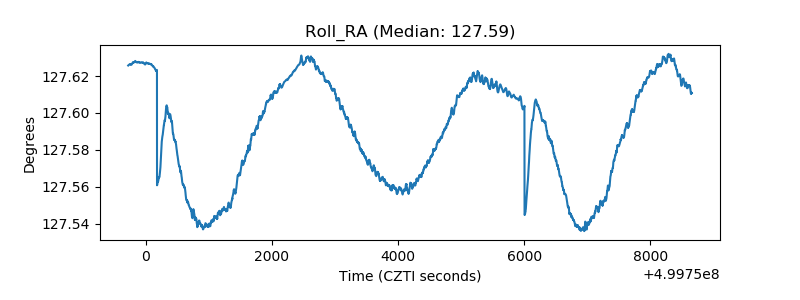 |
| Veto Counter | 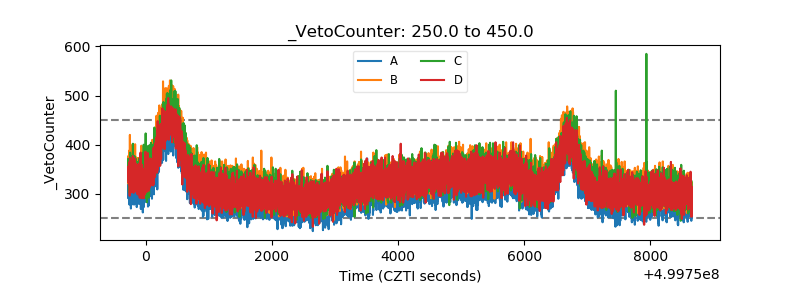 |