| Param | Original file | Final file |
|---|---|---|
| Filename | modeM0/AS1A14_066T07_9000006522_54626cztM0_level2.fits | modeM0/AS1A14_066T07_9000006522_54626cztM0_level2_quad_clean.evt |
| Size (bytes) | 558,331,200 | 120,519,360 |
| Size | 532.5 MB | 114.9 MB |
| Events in quadrant A | 6,540,014 | 736,791 |
| Events in quadrant B | 4,001,293 | 856,668 |
| Events in quadrant C | 4,397,549 | 755,446 |
| Events in quadrant D | 5,057,423 | 700,267 |
| Mode M0 | |||
|---|---|---|---|
| Quadrant | BADHDUFLAG | Total packets | Discarded packets |
| A | 0 | 25597 | 0 |
| B | 0 | 18593 | 0 |
| C | 0 | 19603 | 0 |
| D | 0 | 21185 | 2 |
| Mode SS | |||
|---|---|---|---|
| Quadrant | BADHDUFLAG | Total packets | Discarded packets |
| A | 0 | 172 | 0 |
| B | 0 | 172 | 0 |
| C | 0 | 172 | 0 |
| D | 0 | 172 | 0 |
| Quadrant | Total seconds | Saturated seconds | Saturation percentage |
|---|---|---|---|
| A | 8644 | 775 | 8.965757% |
| B | 8645 | 47 | 0.543667% |
| C | 8645 | 91 | 1.052632% |
| D | 8644 | 257 | 2.973161% |
Noise dominated data is calculated using 1-second bins in cleaned event files. If a bin has >2000 counts, and if more than 50% of those come from <1% of pixels, then it is considered to be noise-dominated and hence unusable.
| Quadrant | # 1 sec bins | Bins with >0 counts | Bins with >2000 counts | High rate bins dominated by noise | Noise dominated (total time) | Noise dominated (detector-on time) | Marked lightcurve |
|---|---|---|---|---|---|---|---|
| A | 8643 | 8643 | 701 | 701 | 8.11% | 8.11% | 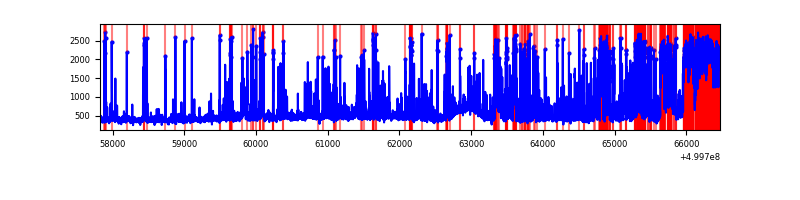 |
| B | 8644 | 8644 | 10 | 10 | 0.12% | 0.12% | 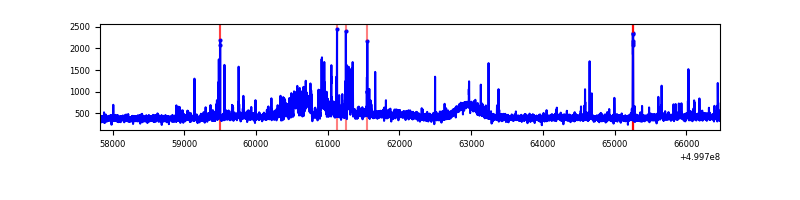 |
| C | 8644 | 8644 | 65 | 65 | 0.75% | 0.75% | 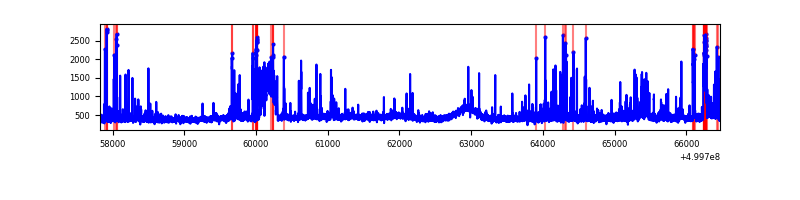 |
| D | 8643 | 8643 | 263 | 263 | 3.04% | 3.04% | 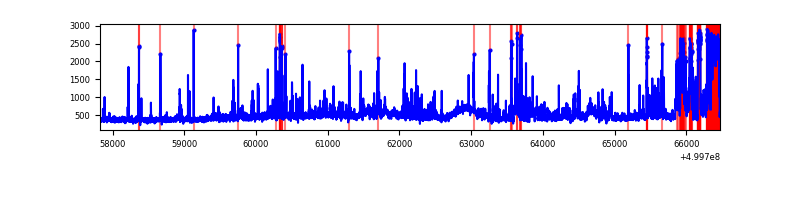 |
Top three noisy pixels from each quadrant. If the there are fewer than three noisy pixels in the level2.evt file, extra rows are filled as -1
| Pixel properties | Quadrant properties | ||||||
|---|---|---|---|---|---|---|---|
| Quadrant | DetID | PixID | Counts | Sigma | Mean | Median | Sigma |
| A | 7 | 190 | 1424740 | 6444.98 | 896 | 874 | 220.9 |
| A | 7 | 14 | 950195 | 4297.0 | 896 | 874 | 220.9 |
| A | 11 | 3 | 265030 | 1195.67 | 896 | 874 | 220.9 |
| B | 5 | 172 | 286398 | 1476.03 | 903 | 868 | 193.4 |
| B | 10 | 247 | 70566 | 360.3 | 903 | 868 | 193.4 |
| B | 12 | 111 | 24054 | 119.86 | 903 | 868 | 193.4 |
| C | 4 | 5 | 271480 | 1112.27 | 887 | 882 | 243.3 |
| C | 15 | 157 | 201831 | 825.98 | 887 | 882 | 243.3 |
| C | 15 | 147 | 118197 | 482.21 | 887 | 882 | 243.3 |
| D | 8 | 240 | 718950 | 2887.89 | 882 | 844 | 248.7 |
| D | 2 | 62 | 231775 | 928.7 | 882 | 844 | 248.7 |
| D | 2 | 172 | 166195 | 664.97 | 882 | 844 | 248.7 |
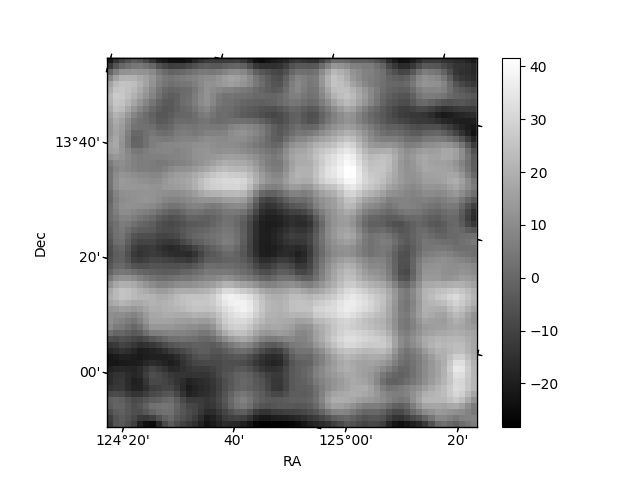
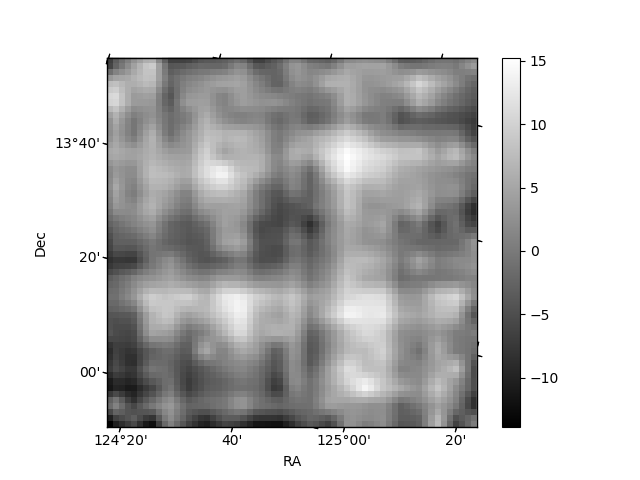
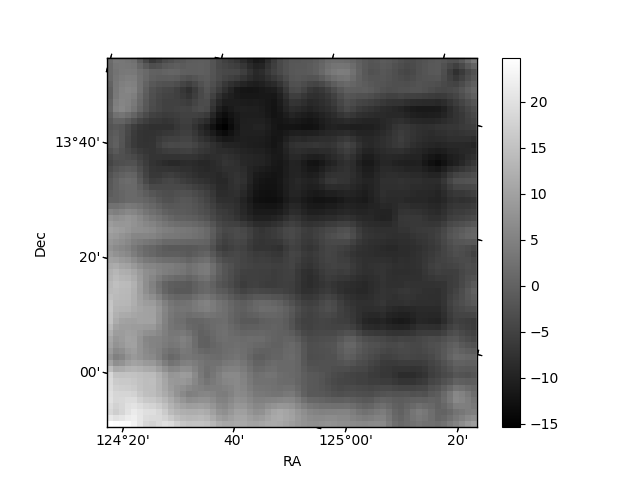
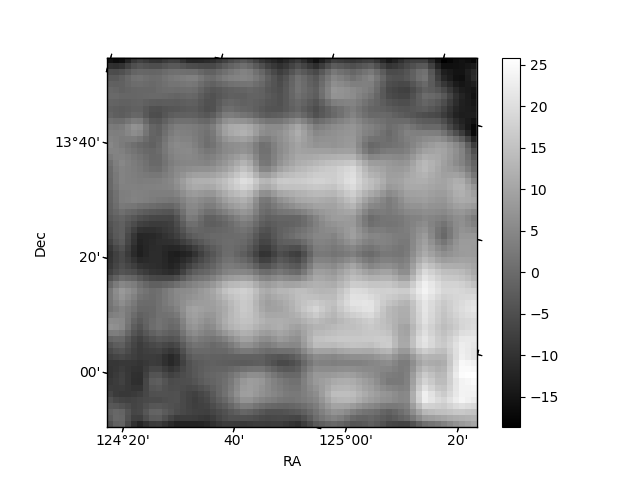
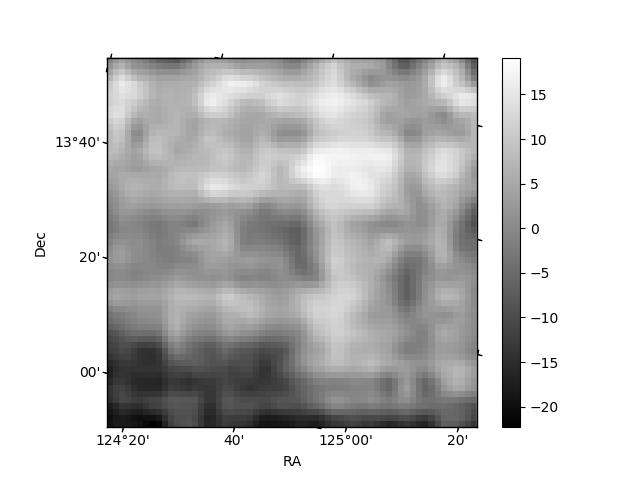
Histogram calculated using DETX and DETY for each event in the final _common_clean file
| Quadrant A | 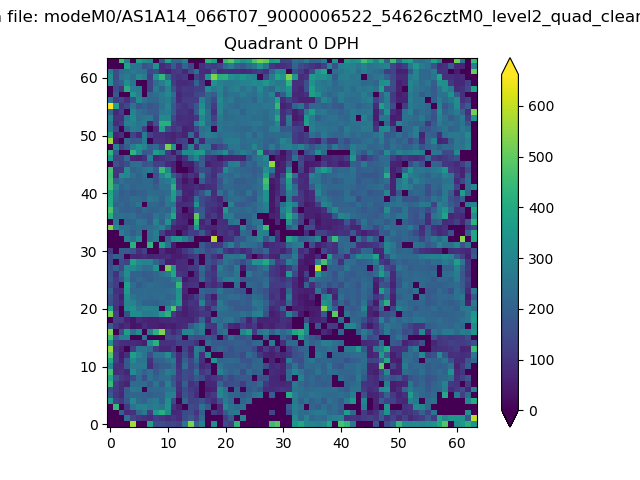 |
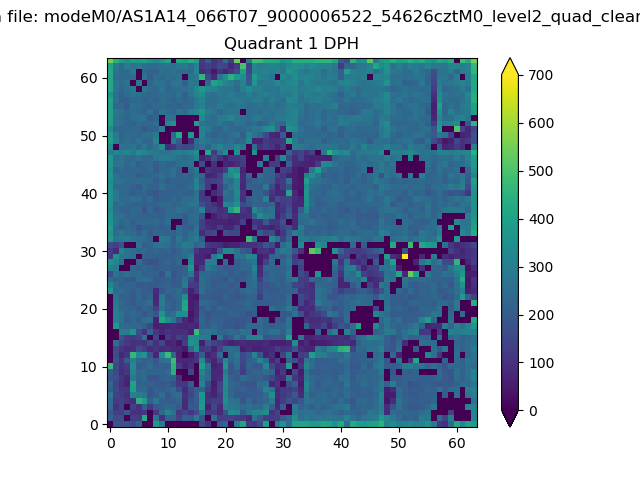 |
Quadrant B |
|---|---|---|---|
| Quadrant D | 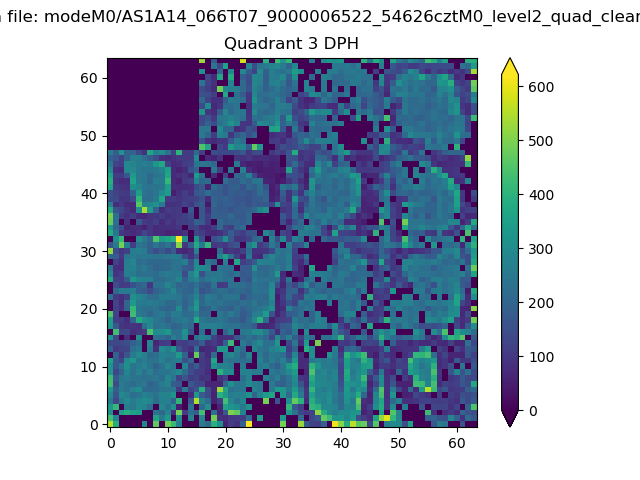 |
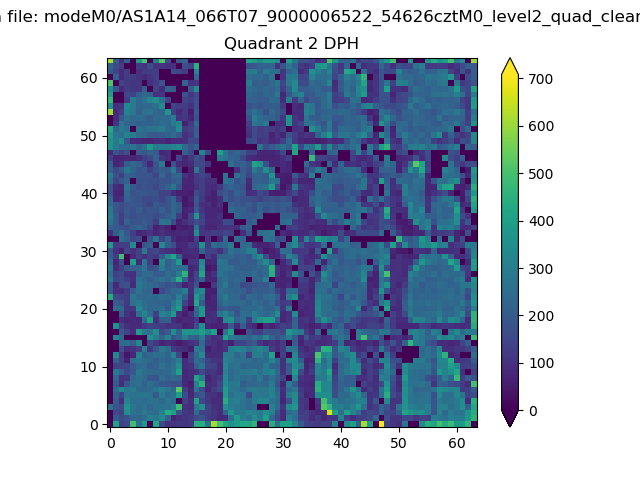 |
Quadrant C |
| Plot type | Count rate plots | Images |
|---|---|---|
| Comparison with Poisson distribution Blue bars denote a histogram of data divided into 1 sec bins. Red curve is a Poisson curve with rate = median count rate of data. |
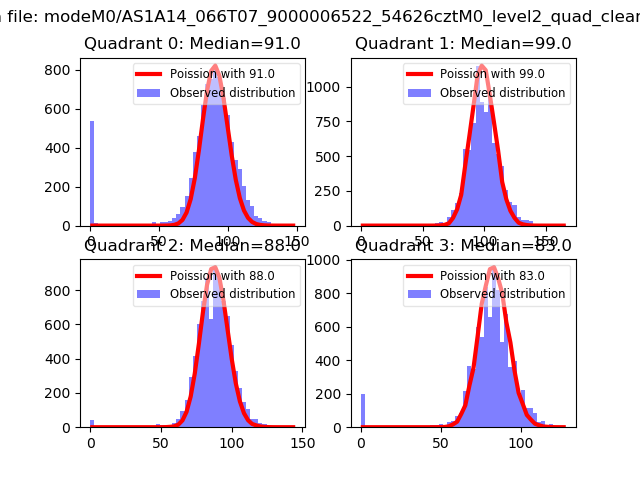 |
 |
| Quadrant-wise count rates Data is divided into 100 sec bins |
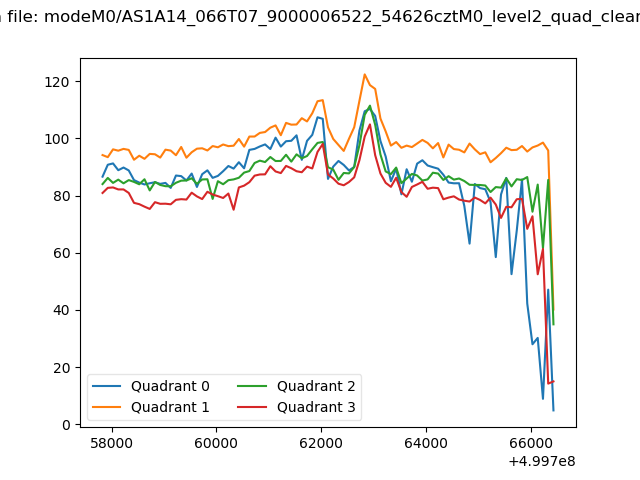 |
|
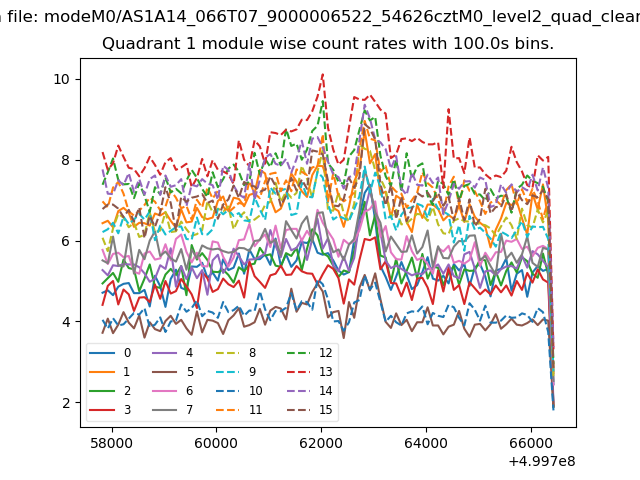
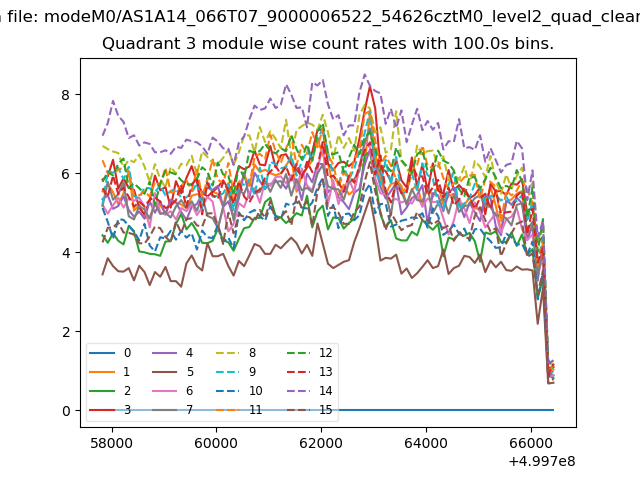
| Module-wise count rates for Quadrant A Data is divided into 100 sec bins |
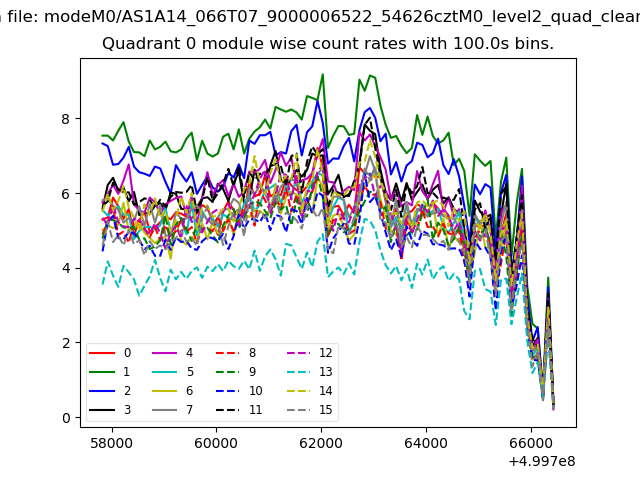 |
 |
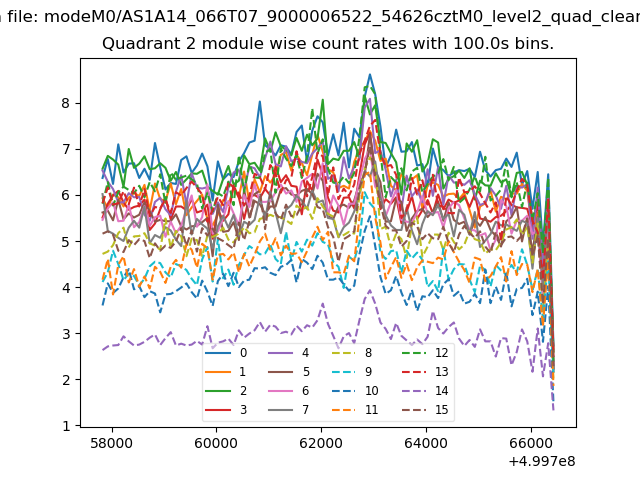
| Module-wise count rates for Quadrant B Data is divided into 100 sec bins |
 |
 |
| Module-wise count rates for Quadrant C Data is divided into 100 sec bins |
 |
 |
| Module-wise count rates for Quadrant D Data is divided into 100 sec bins |
 |
 |
| Parameter | Plot |
|---|---|
| CZT HV Monitor | 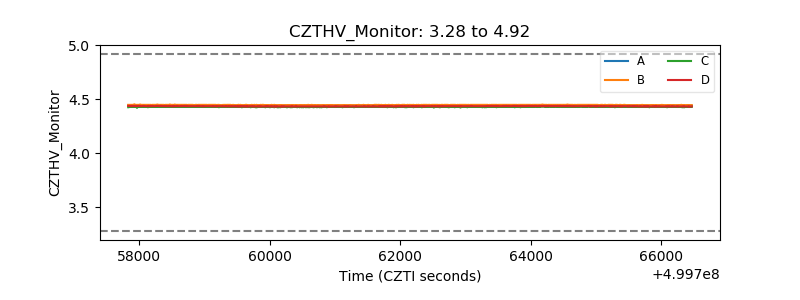 |
| D_VDD | 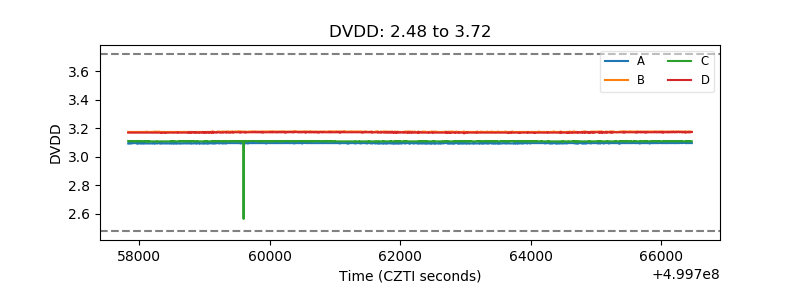 |
| Temperature 1 | 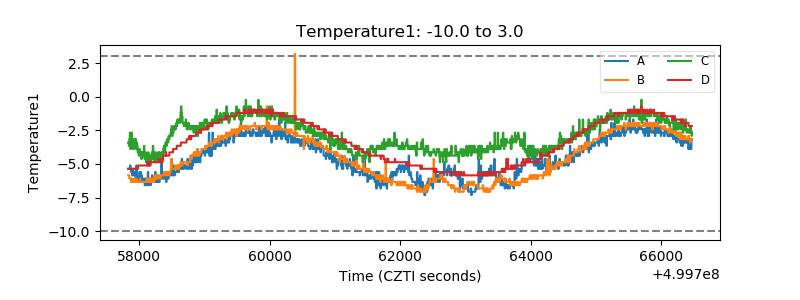 |
| Veto HV Monitor |  |
| Veto LLD | 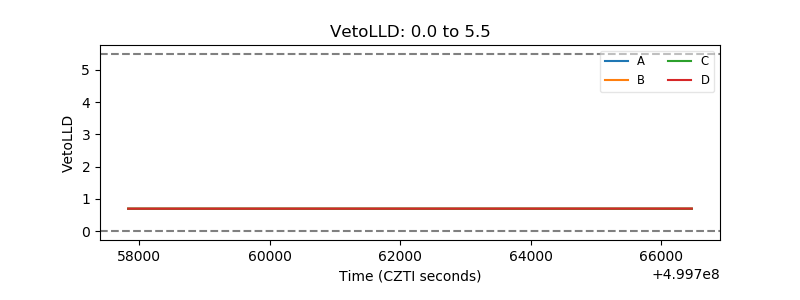 |
| Alpha Counter | 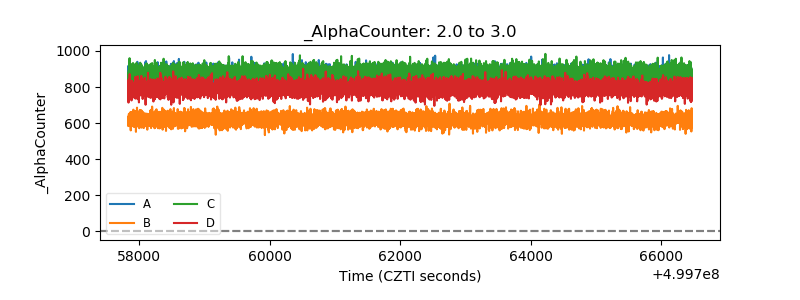 |
| _CPM_Rate | 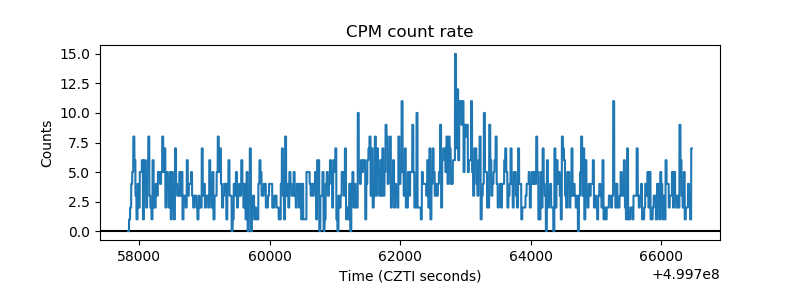 |
| CZT Counter | 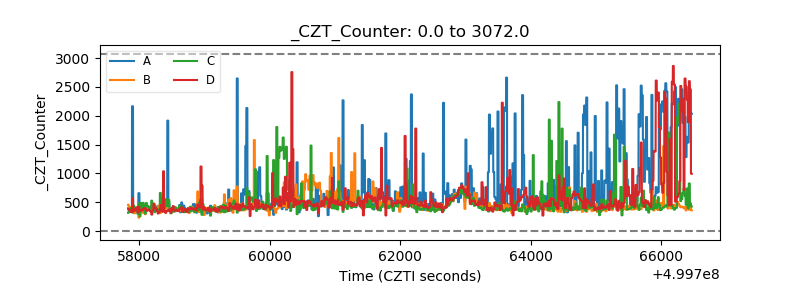 |
| +2.5 Volts monitor | 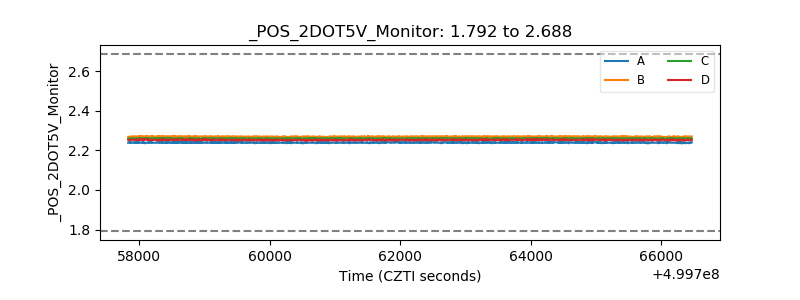 |
| +5 Volts monitor | 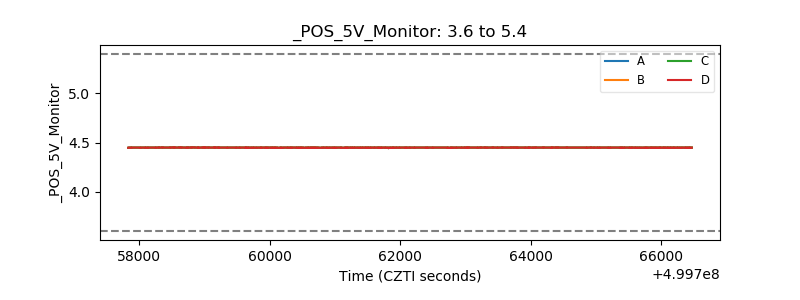 |
| _ROLL_ROT | 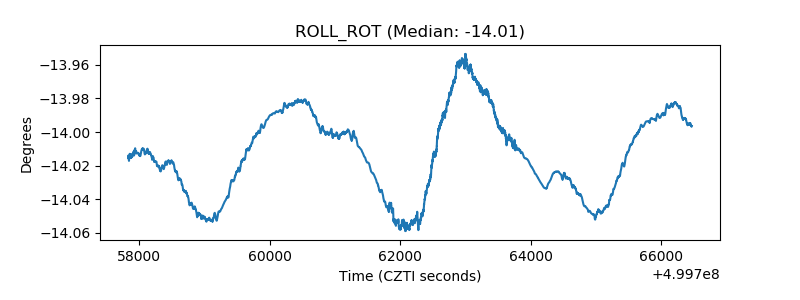 |
| _Roll_DEC | 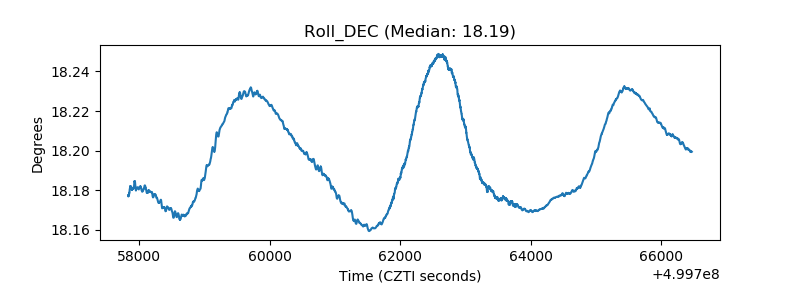 |
| _Roll_RA | 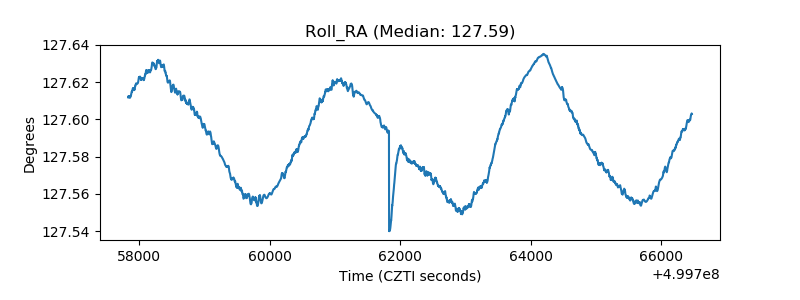 |
| Veto Counter | 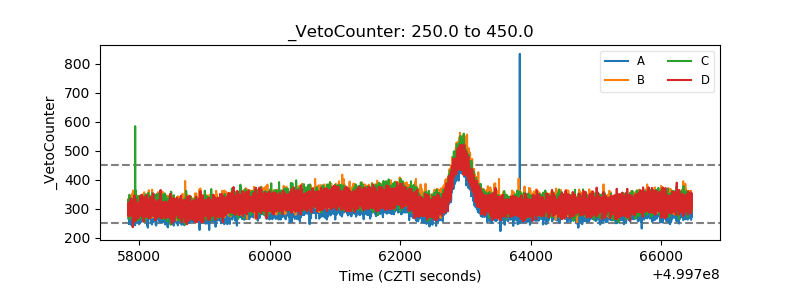 |