| Param | Original file | Final file |
|---|---|---|
| Filename | modeM0/AS1A14_066T07_9000006522_54627cztM0_level2.fits | modeM0/AS1A14_066T07_9000006522_54627cztM0_level2_quad_clean.evt |
| Size (bytes) | 1,041,068,160 | 219,582,720 |
| Size | 992.8 MB | 209.4 MB |
| Events in quadrant A | 10,282,912 | 1,401,745 |
| Events in quadrant B | 7,315,177 | 1,561,484 |
| Events in quadrant C | 9,879,598 | 1,354,224 |
| Events in quadrant D | 9,827,831 | 1,234,547 |
| Mode M9 | |||
|---|---|---|---|
| Quadrant | BADHDUFLAG | Total packets | Discarded packets |
| A | 0 | 15 | 0 |
| B | 0 | 15 | 0 |
| C | 0 | 15 | 0 |
| D | 0 | 15 | 0 |
| Mode M0 | |||
|---|---|---|---|
| Quadrant | BADHDUFLAG | Total packets | Discarded packets |
| A | 0 | 41753 | 5 |
| B | 0 | 33376 | 4 |
| C | 0 | 40821 | 4 |
| D | 0 | 40330 | 4 |
| Mode SS | |||
|---|---|---|---|
| Quadrant | BADHDUFLAG | Total packets | Discarded packets |
| A | 0 | 324 | 0 |
| B | 0 | 324 | 0 |
| C | 0 | 324 | 0 |
| D | 0 | 324 | 0 |
| Quadrant | Total seconds | Saturated seconds | Saturation percentage |
|---|---|---|---|
| A | 15885 | 1128 | 7.101039% |
| B | 15887 | 388 | 2.442248% |
| C | 15887 | 772 | 4.859319% |
| D | 15887 | 961 | 6.048971% |
Noise dominated data is calculated using 1-second bins in cleaned event files. If a bin has >2000 counts, and if more than 50% of those come from <1% of pixels, then it is considered to be noise-dominated and hence unusable.
| Quadrant | # 1 sec bins | Bins with >0 counts | Bins with >2000 counts | High rate bins dominated by noise | Noise dominated (total time) | Noise dominated (detector-on time) | Marked lightcurve |
|---|---|---|---|---|---|---|---|
| A | 17341 | 15890 | 741 | 741 | 4.27% | 4.66% | 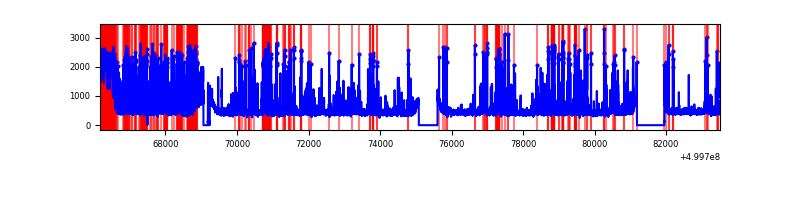 |
| B | 17342 | 15891 | 35 | 35 | 0.20% | 0.22% | 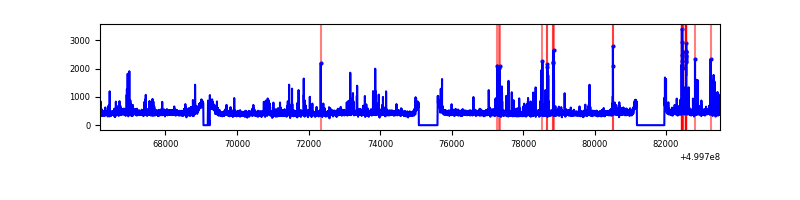 |
| C | 17342 | 15891 | 488 | 488 | 2.81% | 3.07% | 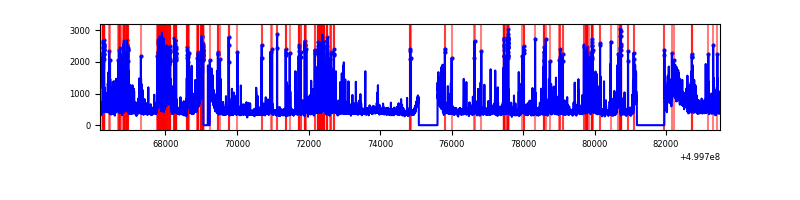 |
| D | 17342 | 15891 | 693 | 693 | 4.00% | 4.36% | 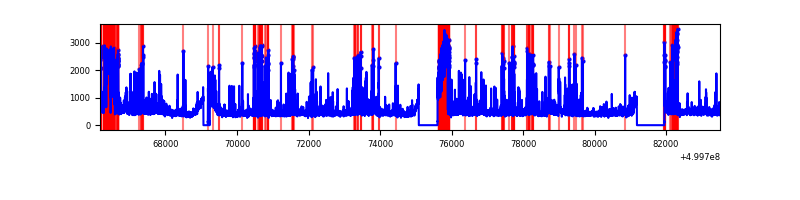 |
Top three noisy pixels from each quadrant. If the there are fewer than three noisy pixels in the level2.evt file, extra rows are filled as -1
| Pixel properties | Quadrant properties | ||||||
|---|---|---|---|---|---|---|---|
| Quadrant | DetID | PixID | Counts | Sigma | Mean | Median | Sigma |
| A | 7 | 190 | 1075297 | 2557.88 | 1715 | 1671 | 419.7 |
| A | 7 | 14 | 729584 | 1734.23 | 1715 | 1671 | 419.7 |
| A | 0 | 8 | 648408 | 1540.83 | 1715 | 1671 | 419.7 |
| B | 1 | 207 | 119089 | 316.96 | 1723 | 1655 | 370.5 |
| B | 5 | 172 | 71643 | 188.9 | 1723 | 1655 | 370.5 |
| B | 10 | 247 | 70585 | 186.05 | 1723 | 1655 | 370.5 |
| C | 13 | 3 | 1095780 | 2380.69 | 1675 | 1662 | 459.6 |
| C | 4 | 5 | 1060178 | 2303.22 | 1675 | 1662 | 459.6 |
| C | 15 | 157 | 283726 | 613.74 | 1675 | 1662 | 459.6 |
| D | 8 | 240 | 794090 | 1686.61 | 1671 | 1604 | 469.9 |
| D | 8 | 160 | 742189 | 1576.15 | 1671 | 1604 | 469.9 |
| D | 2 | 249 | 627314 | 1331.67 | 1671 | 1604 | 469.9 |
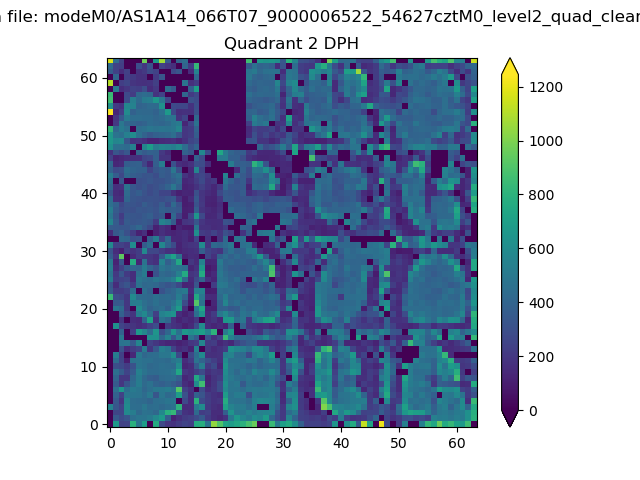
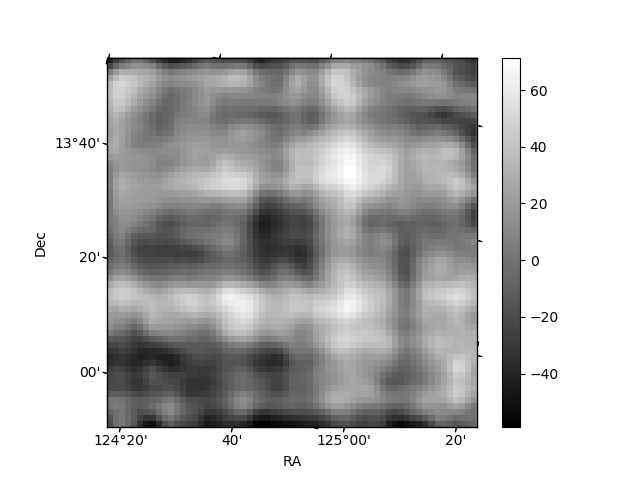
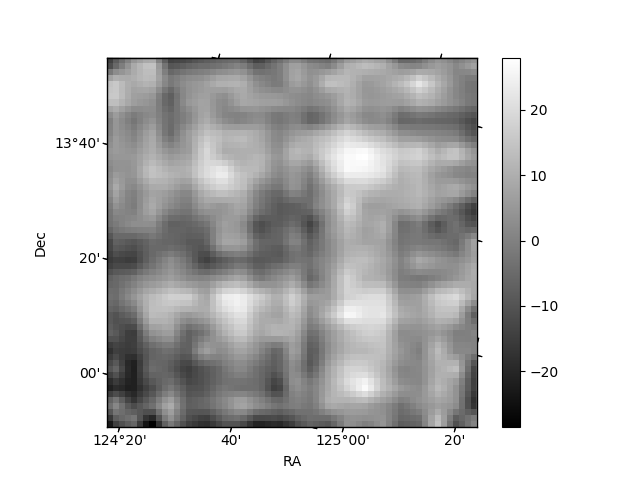
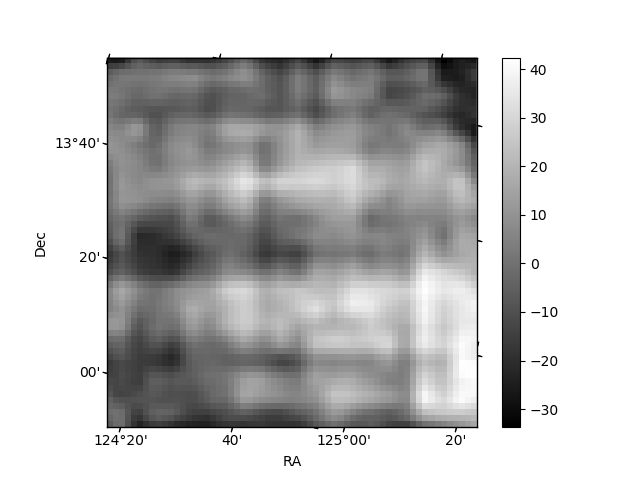
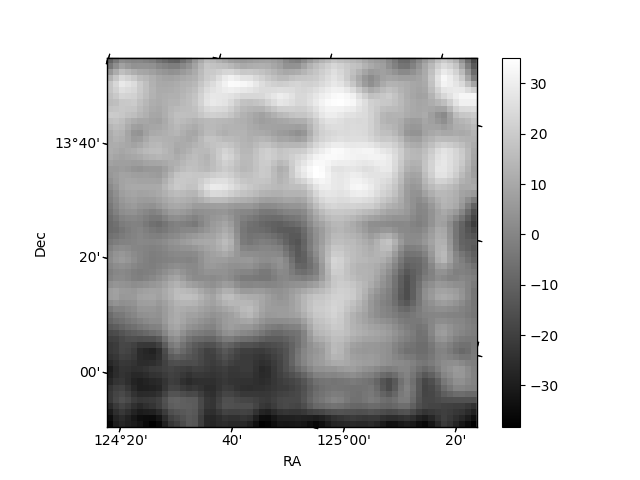
Histogram calculated using DETX and DETY for each event in the final _common_clean file
| Quadrant A | 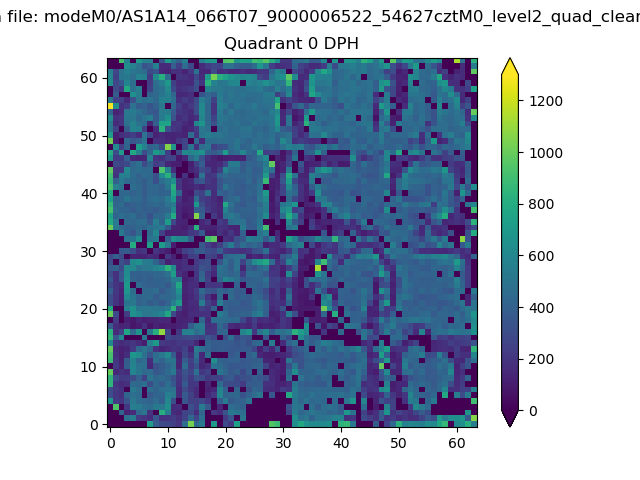 |
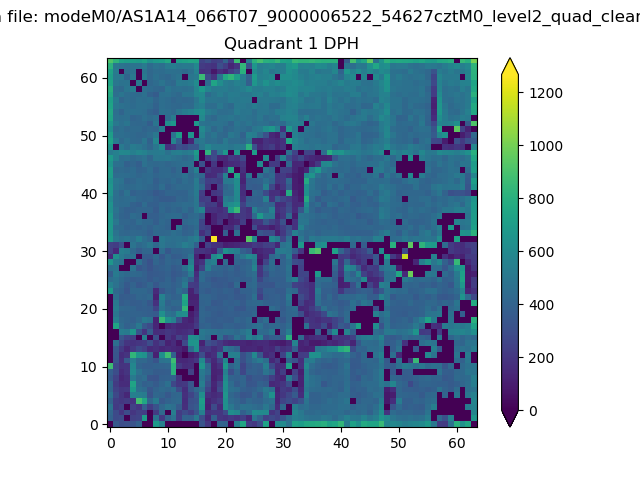 |
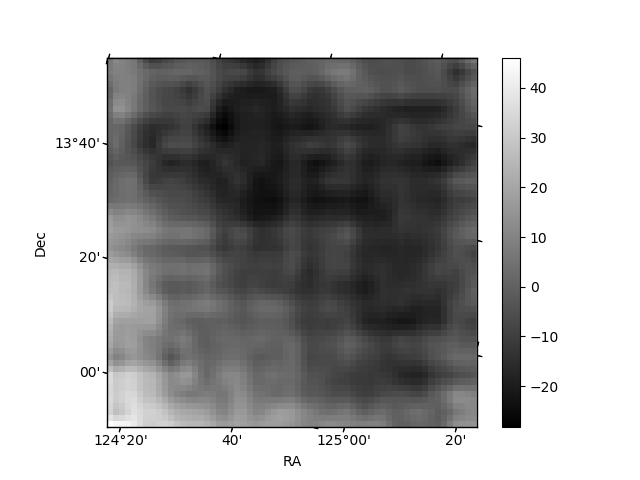
Quadrant B |
|---|---|---|---|
| Quadrant D | 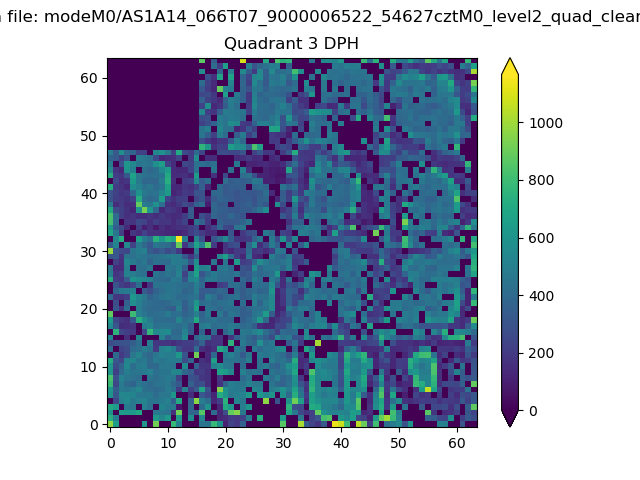 |
 |
Quadrant C |
| Plot type | Count rate plots | Images |
|---|---|---|
| Comparison with Poisson distribution Blue bars denote a histogram of data divided into 1 sec bins. Red curve is a Poisson curve with rate = median count rate of data. |
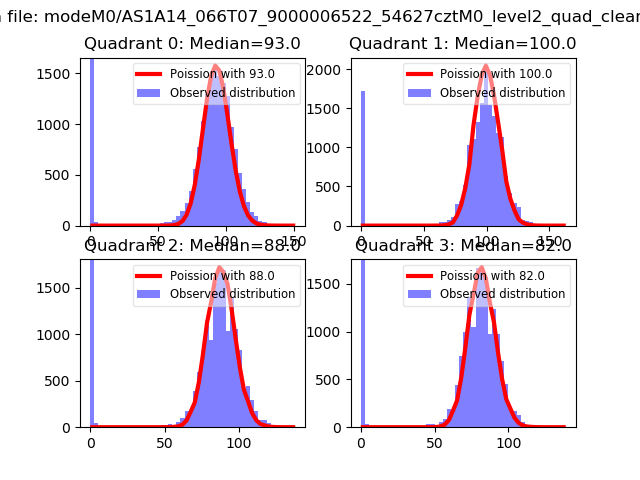 |
 |
| Quadrant-wise count rates Data is divided into 100 sec bins |
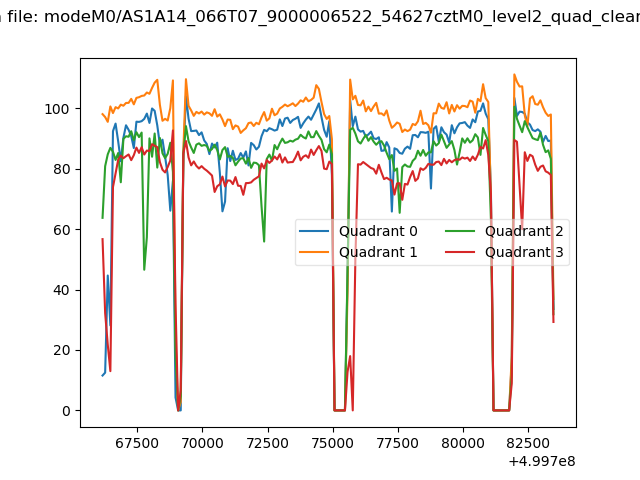 |
|
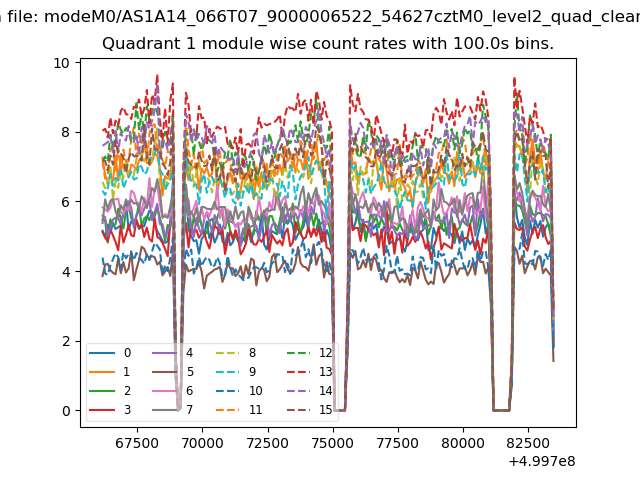
| Module-wise count rates for Quadrant A Data is divided into 100 sec bins |
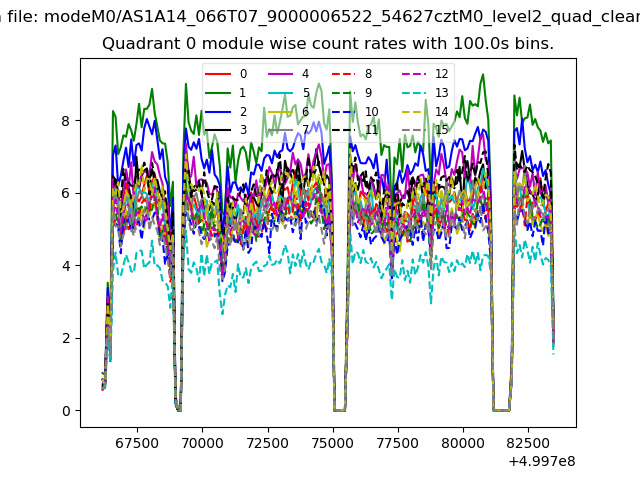 |
 |
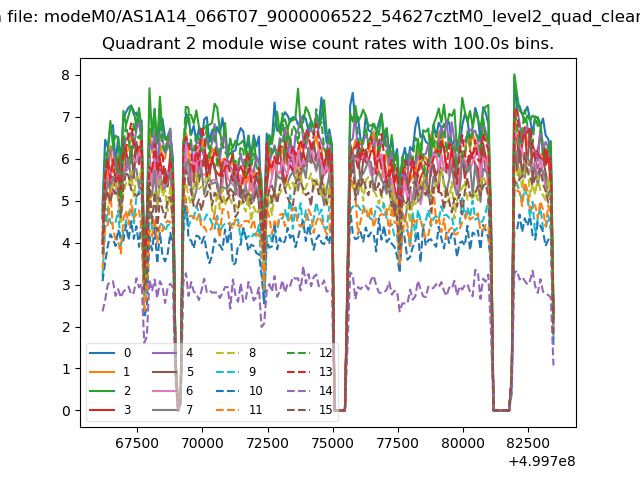
| Module-wise count rates for Quadrant B Data is divided into 100 sec bins |
 |
 |
| Module-wise count rates for Quadrant C Data is divided into 100 sec bins |
 |
 |
| Module-wise count rates for Quadrant D Data is divided into 100 sec bins |
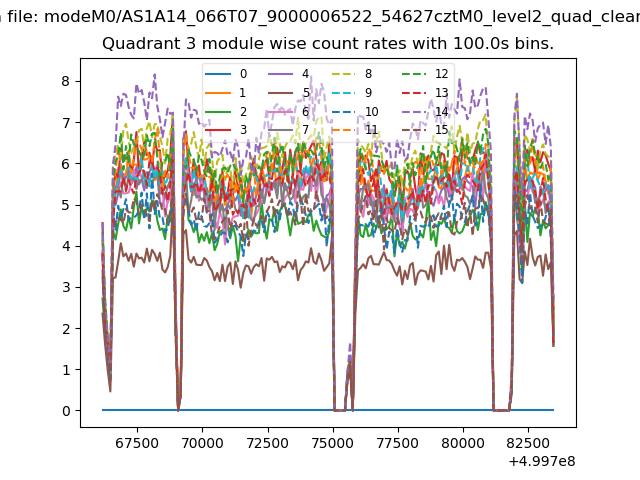 |
 |
| Parameter | Plot |
|---|---|
| CZT HV Monitor | 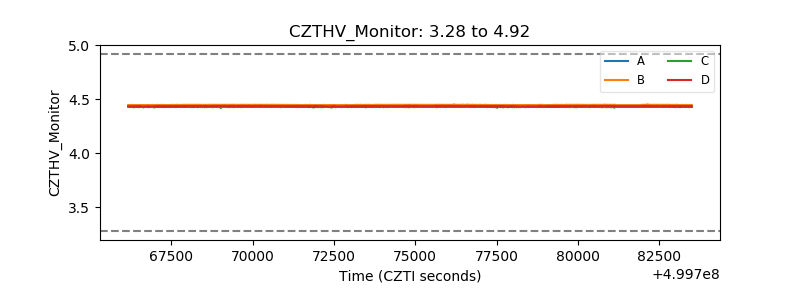 |
| D_VDD | 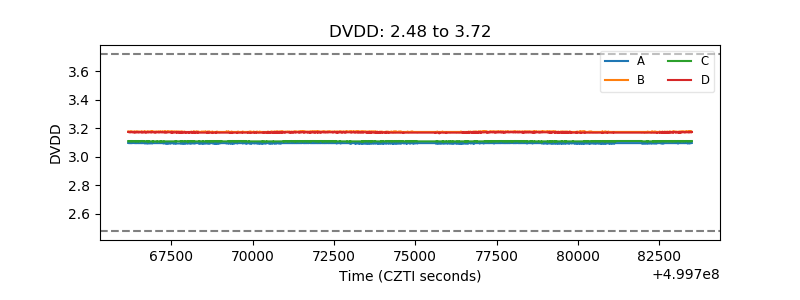 |
| Temperature 1 | 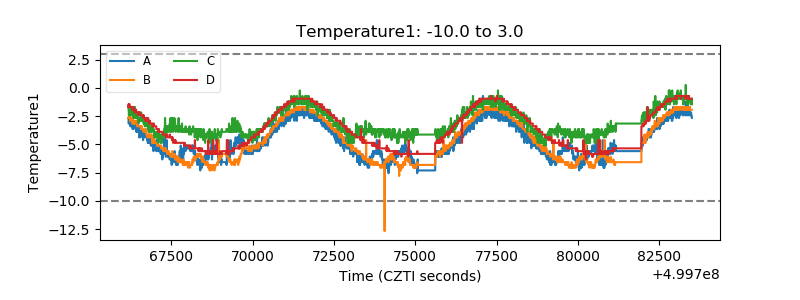 |
| Veto HV Monitor |  |
| Veto LLD | 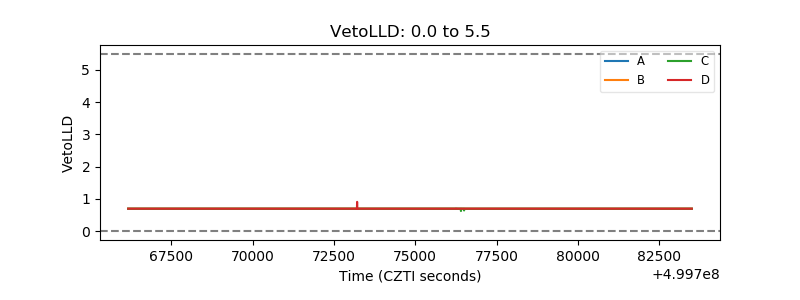 |
| Alpha Counter | 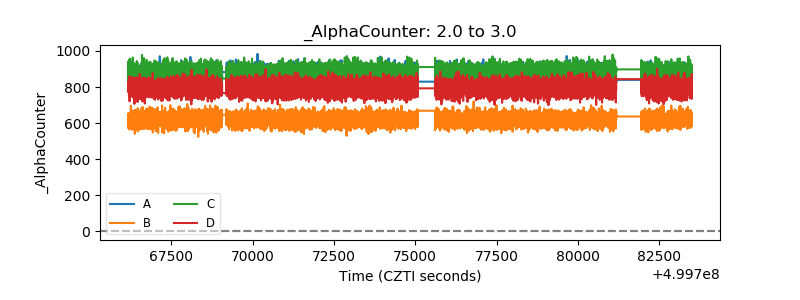 |
| _CPM_Rate | 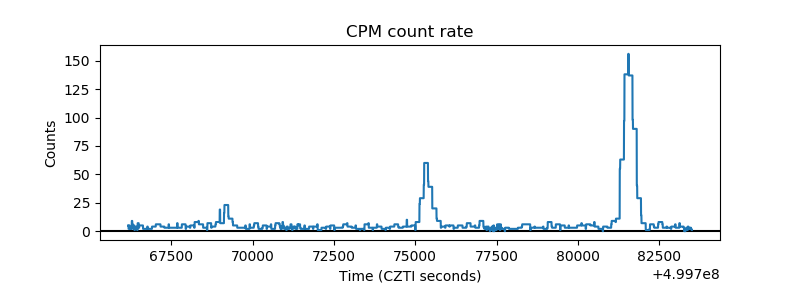 |
| CZT Counter | 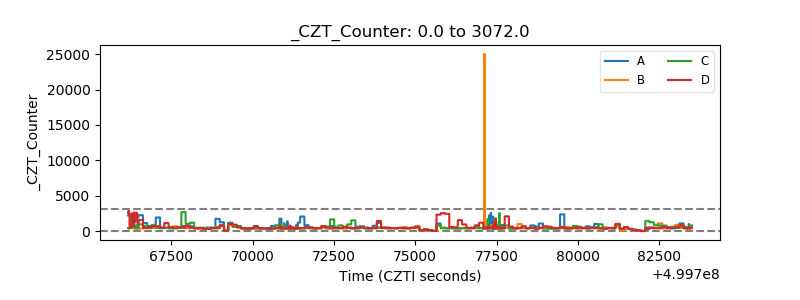 |
| +2.5 Volts monitor | 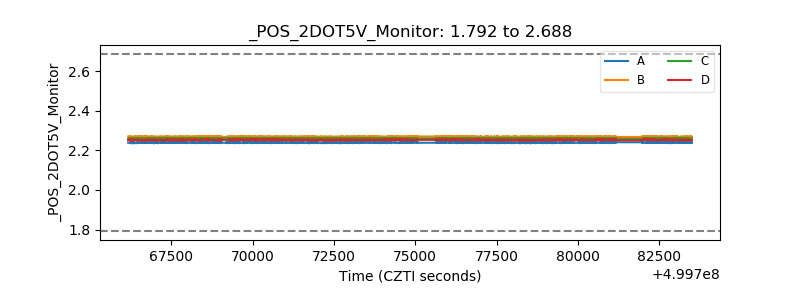 |
| +5 Volts monitor | 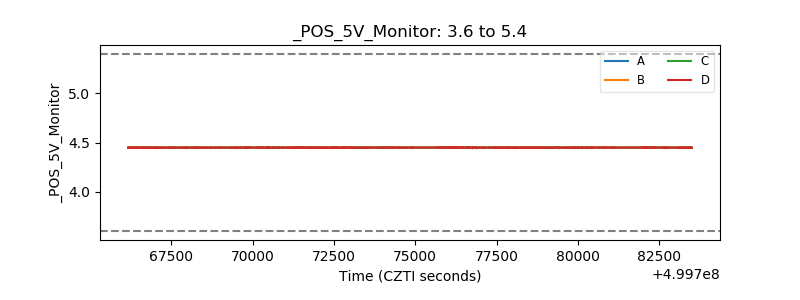 |
| _ROLL_ROT | 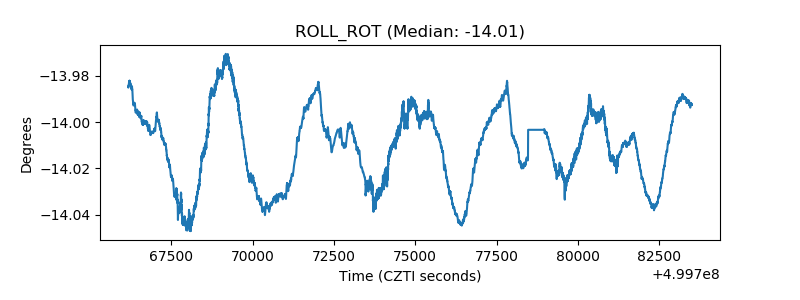 |
| _Roll_DEC | 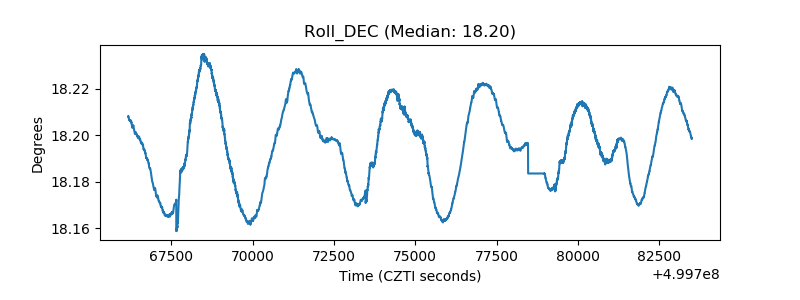 |
| _Roll_RA | 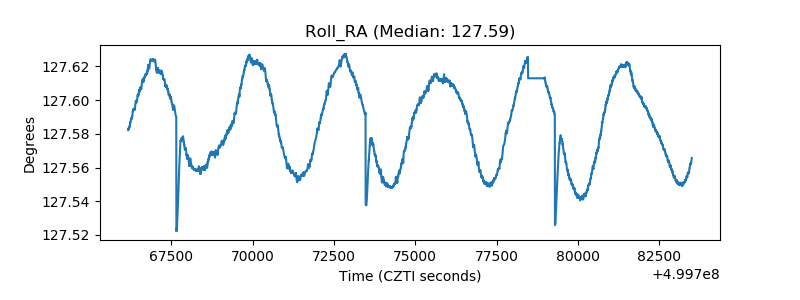 |
| Veto Counter | 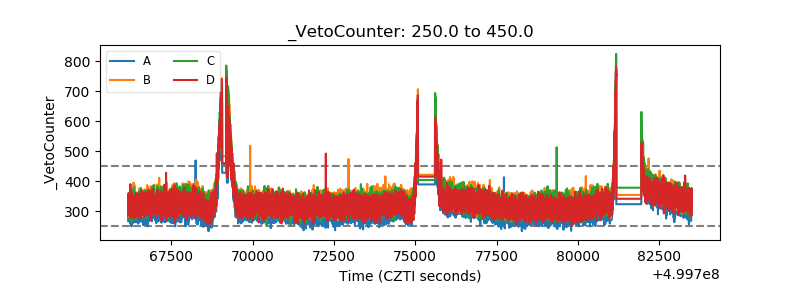 |