| Param | Original file | Final file |
|---|---|---|
| Filename | modeM0/AS1A14_066T07_9000006522_54628cztM0_level2.fits | modeM0/AS1A14_066T07_9000006522_54628cztM0_level2_quad_clean.evt |
| Size (bytes) | 432,103,680 | 99,990,720 |
| Size | 412.1 MB | 95.4 MB |
| Events in quadrant A | 3,838,783 | 652,557 |
| Events in quadrant B | 3,505,620 | 698,240 |
| Events in quadrant C | 4,608,018 | 604,779 |
| Events in quadrant D | 3,503,394 | 589,178 |
| Mode M9 | |||
|---|---|---|---|
| Quadrant | BADHDUFLAG | Total packets | Discarded packets |
| A | 0 | 12 | 0 |
| B | 0 | 12 | 0 |
| C | 0 | 13 | 0 |
| D | 0 | 13 | 0 |
| Mode M0 | |||
|---|---|---|---|
| Quadrant | BADHDUFLAG | Total packets | Discarded packets |
| A | 0 | 16178 | 2 |
| B | 0 | 15254 | 2 |
| C | 0 | 18573 | 2 |
| D | 0 | 15288 | 2 |
| Mode SS | |||
|---|---|---|---|
| Quadrant | BADHDUFLAG | Total packets | Discarded packets |
| A | 0 | 142 | 0 |
| B | 0 | 142 | 0 |
| C | 0 | 142 | 0 |
| D | 0 | 142 | 0 |
| Quadrant | Total seconds | Saturated seconds | Saturation percentage |
|---|---|---|---|
| A | 6929 | 211 | 3.045172% |
| B | 6929 | 185 | 2.669938% |
| C | 6929 | 353 | 5.094530% |
| D | 6929 | 131 | 1.890605% |
Noise dominated data is calculated using 1-second bins in cleaned event files. If a bin has >2000 counts, and if more than 50% of those come from <1% of pixels, then it is considered to be noise-dominated and hence unusable.
| Quadrant | # 1 sec bins | Bins with >0 counts | Bins with >2000 counts | High rate bins dominated by noise | Noise dominated (total time) | Noise dominated (detector-on time) | Marked lightcurve |
|---|---|---|---|---|---|---|---|
| A | 7834 | 6930 | 113 | 113 | 1.44% | 1.63% | 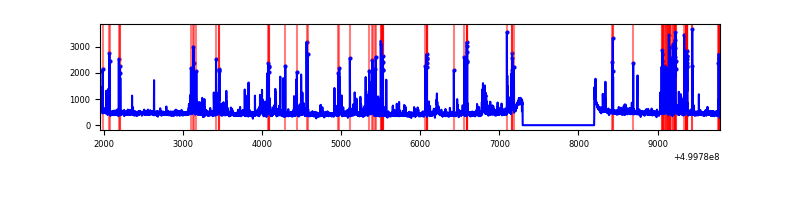 |
| B | 7834 | 6930 | 86 | 86 | 1.10% | 1.24% | 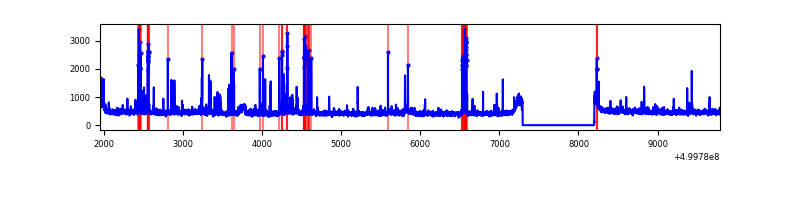 |
| C | 7834 | 6930 | 184 | 184 | 2.35% | 2.66% | 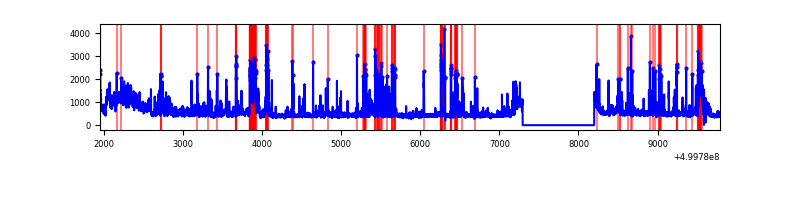 |
| D | 7834 | 6930 | 62 | 62 | 0.79% | 0.89% | 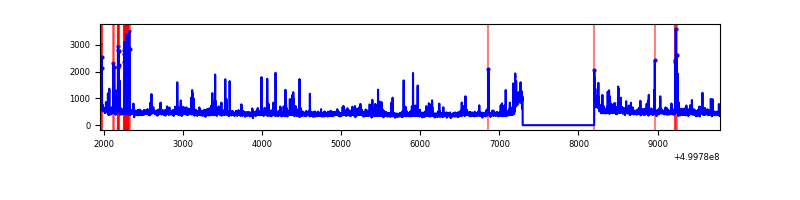 |
Top three noisy pixels from each quadrant. If the there are fewer than three noisy pixels in the level2.evt file, extra rows are filled as -1
| Pixel properties | Quadrant properties | ||||||
|---|---|---|---|---|---|---|---|
| Quadrant | DetID | PixID | Counts | Sigma | Mean | Median | Sigma |
| A | 5 | 243 | 203592 | 1082.93 | 767 | 749 | 187.3 |
| A | 11 | 3 | 190903 | 1015.19 | 767 | 749 | 187.3 |
| A | 13 | 248 | 132204 | 701.81 | 767 | 749 | 187.3 |
| B | 1 | 207 | 200694 | 1217.01 | 755 | 728 | 164.3 |
| B | 10 | 247 | 116026 | 701.71 | 755 | 728 | 164.3 |
| B | 7 | 0 | 86756 | 523.57 | 755 | 728 | 164.3 |
| C | 4 | 5 | 696230 | 3402.08 | 736 | 728 | 204.4 |
| C | 13 | 3 | 632287 | 3089.3 | 736 | 728 | 204.4 |
| C | 12 | 249 | 152681 | 743.28 | 736 | 728 | 204.4 |
| D | 3 | 144 | 122017 | 566.71 | 751 | 719 | 214.0 |
| D | 1 | 232 | 90973 | 421.67 | 751 | 719 | 214.0 |
| D | 8 | 160 | 70008 | 323.72 | 751 | 719 | 214.0 |
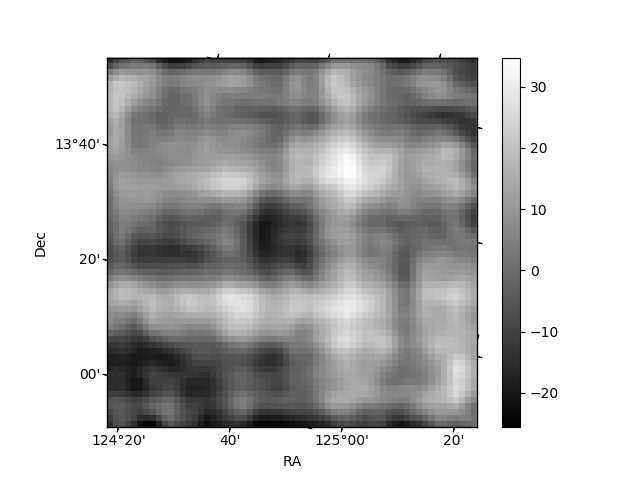
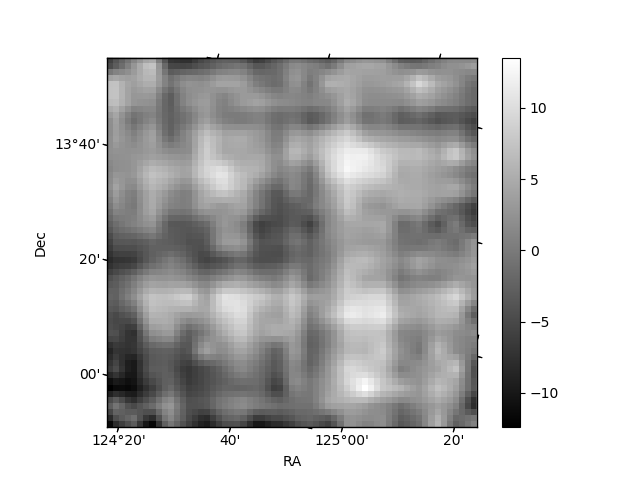
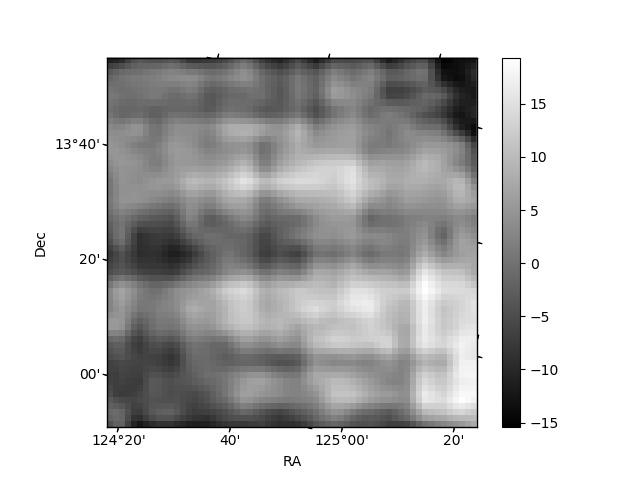
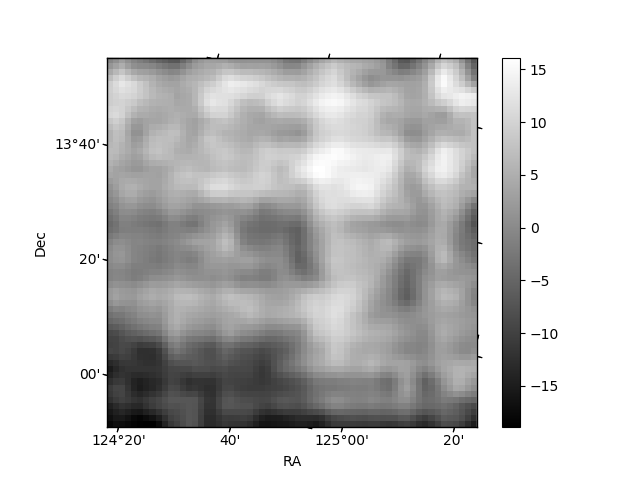
Histogram calculated using DETX and DETY for each event in the final _common_clean file
| Quadrant A | 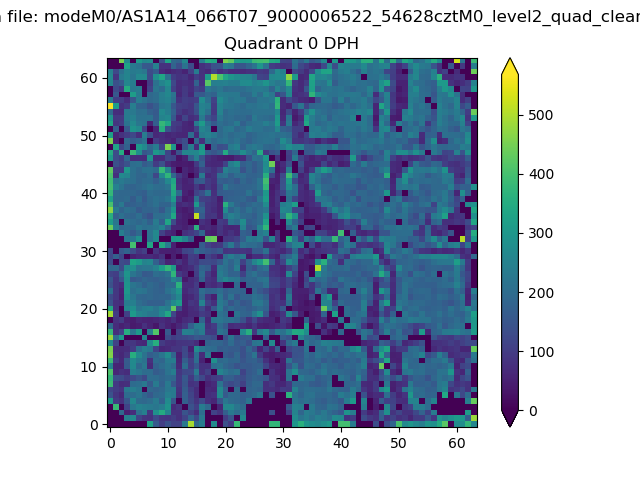 |
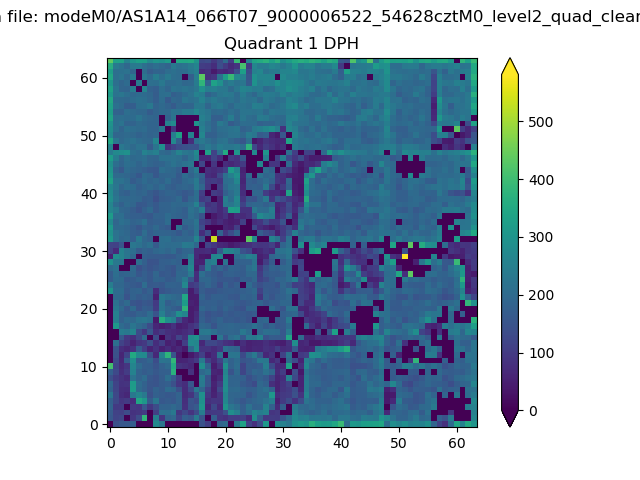 |
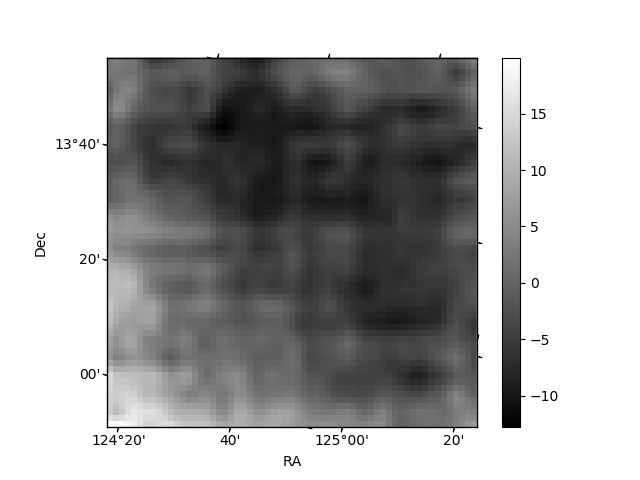
Quadrant B |
|---|---|---|---|
| Quadrant D | 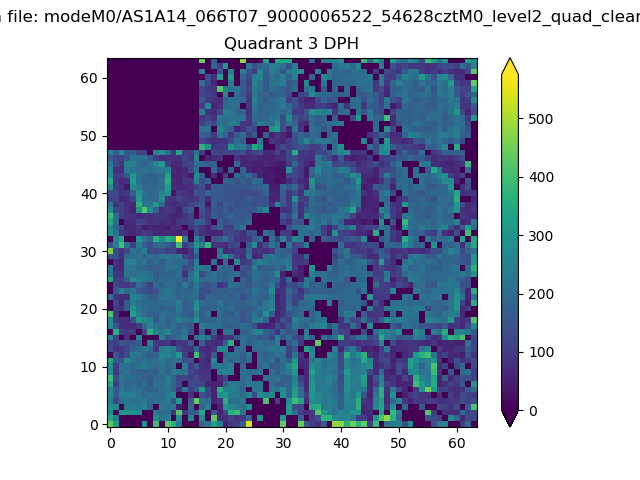 |
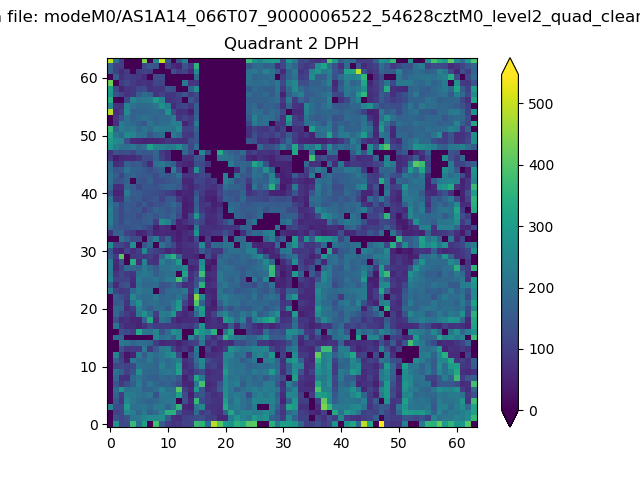 |
Quadrant C |
| Plot type | Count rate plots | Images |
|---|---|---|
| Comparison with Poisson distribution Blue bars denote a histogram of data divided into 1 sec bins. Red curve is a Poisson curve with rate = median count rate of data. |
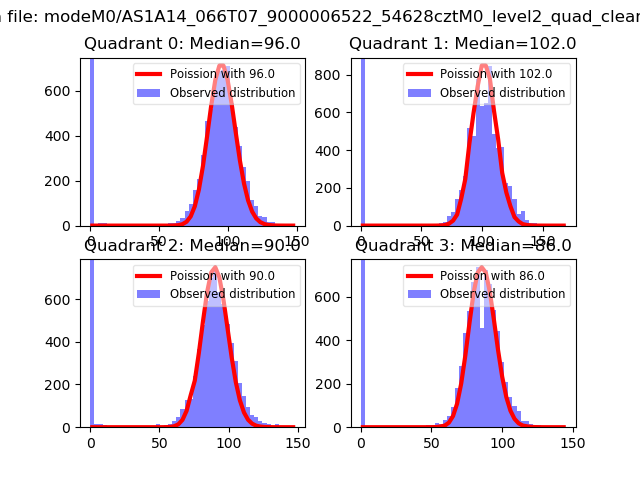 |
 |
| Quadrant-wise count rates Data is divided into 100 sec bins |
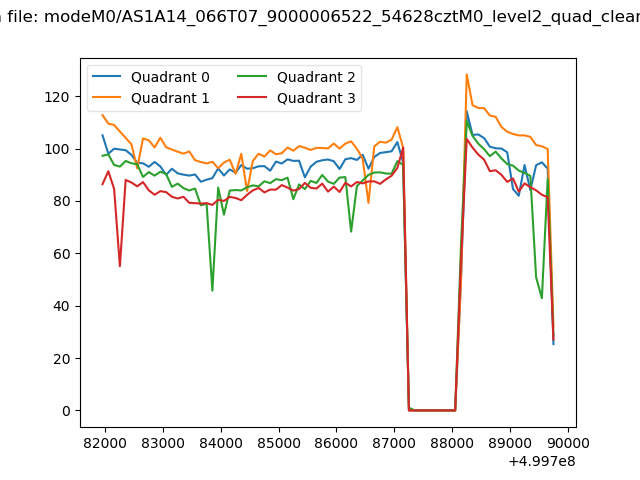 |
|
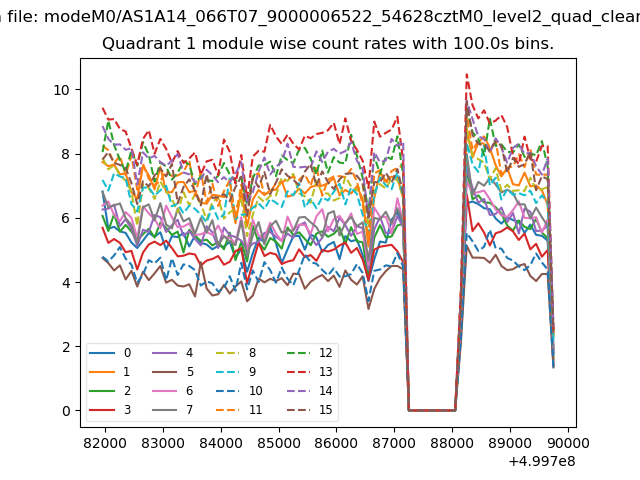
| Module-wise count rates for Quadrant A Data is divided into 100 sec bins |
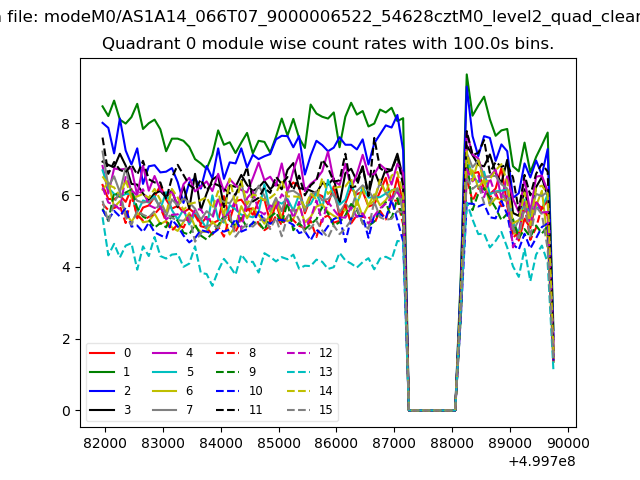 |
 |
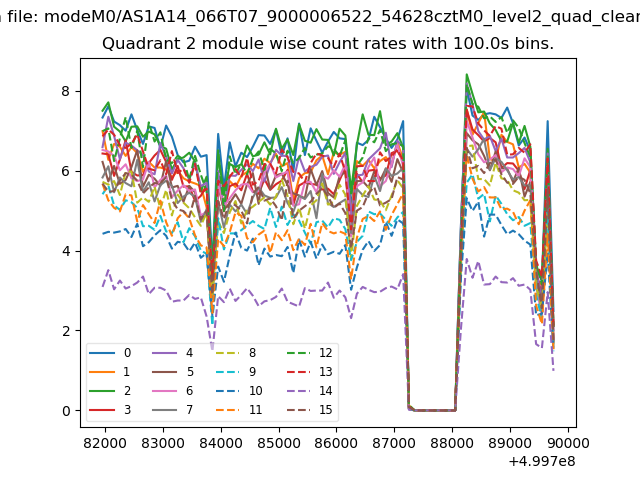
| Module-wise count rates for Quadrant B Data is divided into 100 sec bins |
 |
 |
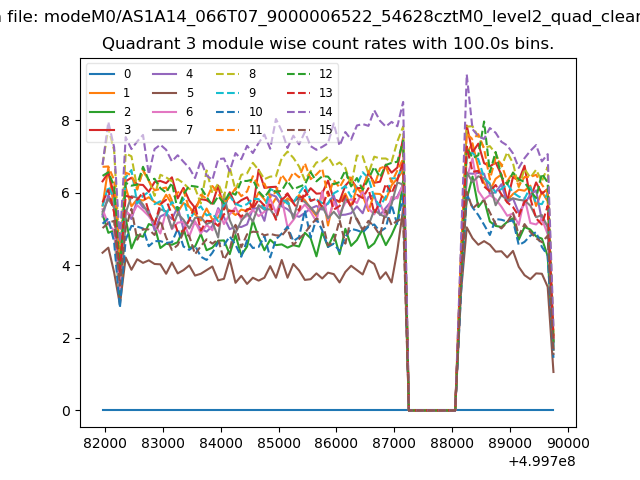
| Module-wise count rates for Quadrant C Data is divided into 100 sec bins |
 |
 |
| Module-wise count rates for Quadrant D Data is divided into 100 sec bins |
 |
 |
| Parameter | Plot |
|---|---|
| CZT HV Monitor | 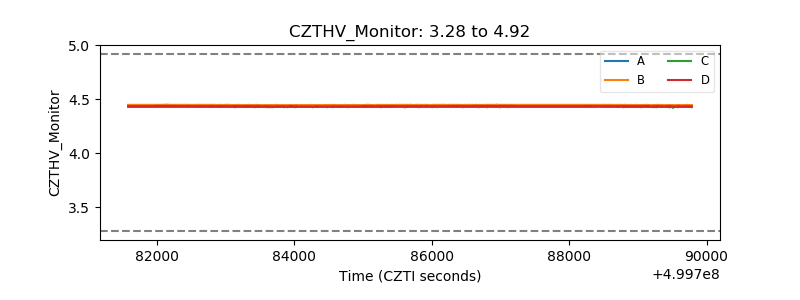 |
| D_VDD | 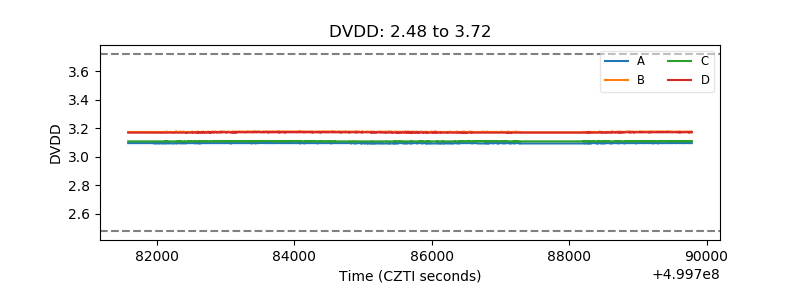 |
| Temperature 1 | 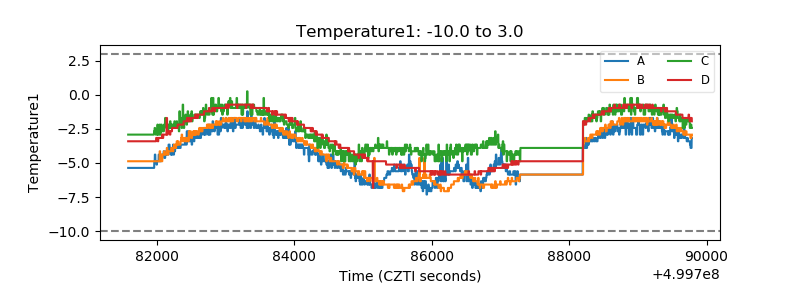 |
| Veto HV Monitor | 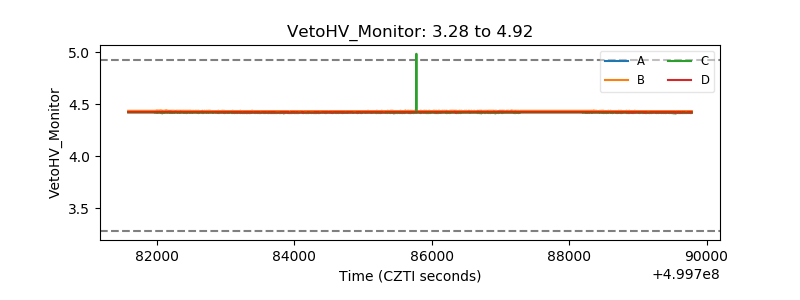 |
| Veto LLD | 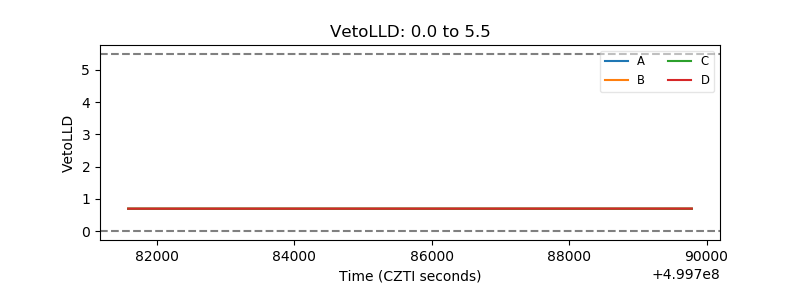 |
| Alpha Counter | 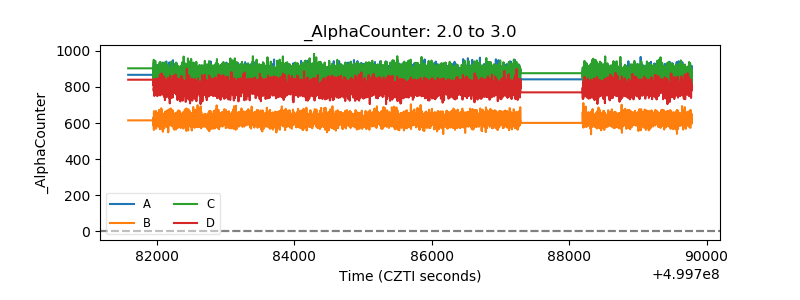 |
| _CPM_Rate | 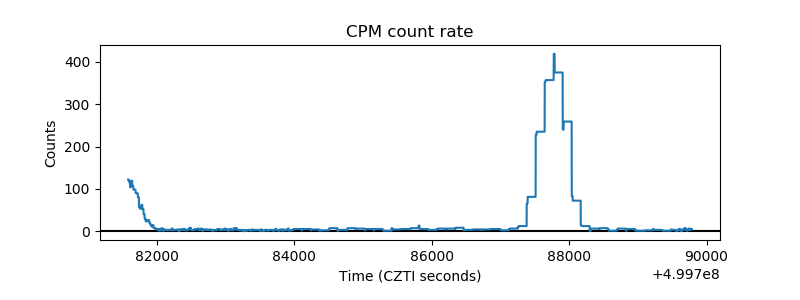 |
| CZT Counter | 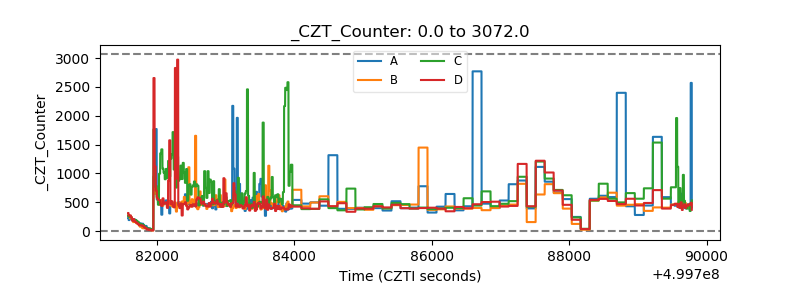 |
| +2.5 Volts monitor |  |
| +5 Volts monitor | 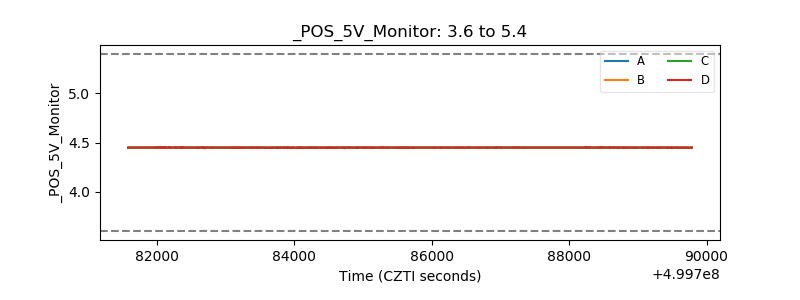 |
| _ROLL_ROT | 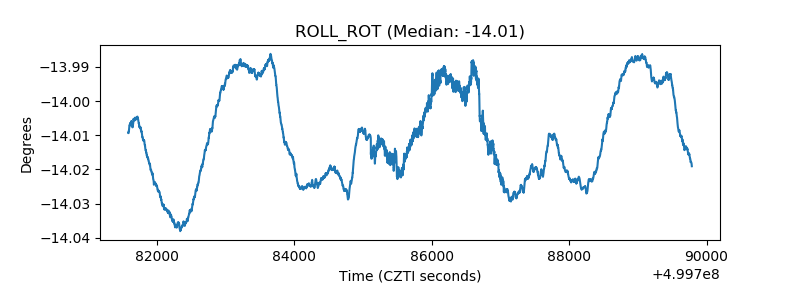 |
| _Roll_DEC | 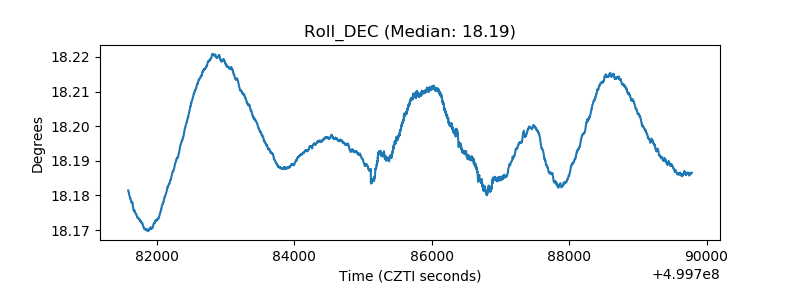 |
| _Roll_RA | 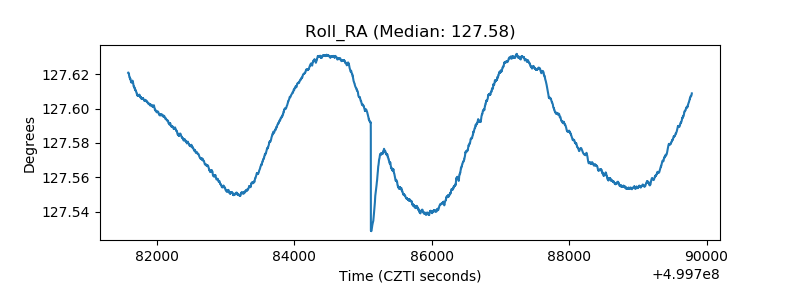 |
| Veto Counter | 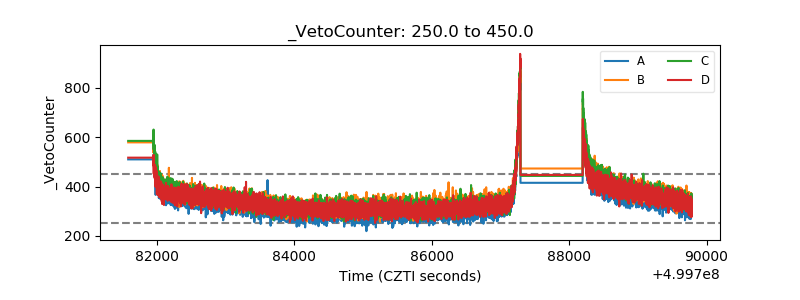 |