| Param | Original file | Final file |
|---|---|---|
| Filename | modeM0/AS1A14_066T07_9000006522_54630cztM0_level2.fits | modeM0/AS1A14_066T07_9000006522_54630cztM0_level2_quad_clean.evt |
| Size (bytes) | 402,883,200 | 100,543,680 |
| Size | 384.2 MB | 95.9 MB |
| Events in quadrant A | 3,564,746 | 656,270 |
| Events in quadrant B | 3,359,719 | 705,470 |
| Events in quadrant C | 3,803,310 | 618,420 |
| Events in quadrant D | 3,662,026 | 595,664 |
| Mode M9 | |||
|---|---|---|---|
| Quadrant | BADHDUFLAG | Total packets | Discarded packets |
| A | 0 | 14 | 0 |
| B | 0 | 14 | 0 |
| C | 0 | 15 | 0 |
| D | 0 | 15 | 0 |
| Mode M0 | |||
|---|---|---|---|
| Quadrant | BADHDUFLAG | Total packets | Discarded packets |
| A | 0 | 15265 | 2 |
| B | 0 | 14731 | 2 |
| C | 0 | 15967 | 2 |
| D | 0 | 15539 | 2 |
| Mode SS | |||
|---|---|---|---|
| Quadrant | BADHDUFLAG | Total packets | Discarded packets |
| A | 0 | 136 | 0 |
| B | 0 | 136 | 0 |
| C | 0 | 136 | 0 |
| D | 0 | 136 | 0 |
| Quadrant | Total seconds | Saturated seconds | Saturation percentage |
|---|---|---|---|
| A | 6724 | 214 | 3.182629% |
| B | 6724 | 148 | 2.201071% |
| C | 6724 | 243 | 3.613920% |
| D | 6723 | 120 | 1.784917% |
Noise dominated data is calculated using 1-second bins in cleaned event files. If a bin has >2000 counts, and if more than 50% of those come from <1% of pixels, then it is considered to be noise-dominated and hence unusable.
| Quadrant | # 1 sec bins | Bins with >0 counts | Bins with >2000 counts | High rate bins dominated by noise | Noise dominated (total time) | Noise dominated (detector-on time) | Marked lightcurve |
|---|---|---|---|---|---|---|---|
| A | 7779 | 6725 | 104 | 104 | 1.34% | 1.55% | 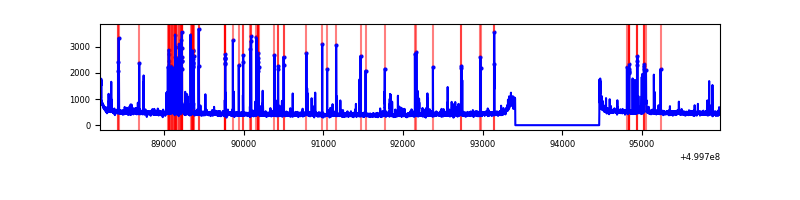 |
| B | 7779 | 6725 | 25 | 25 | 0.32% | 0.37% | 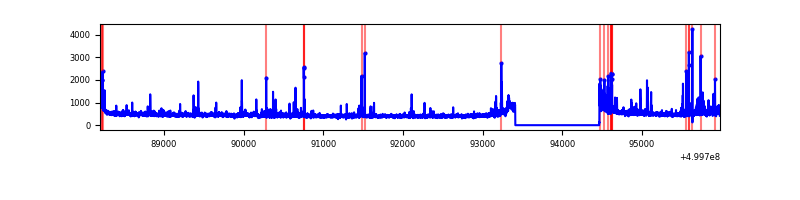 |
| C | 7779 | 6725 | 98 | 98 | 1.26% | 1.46% | 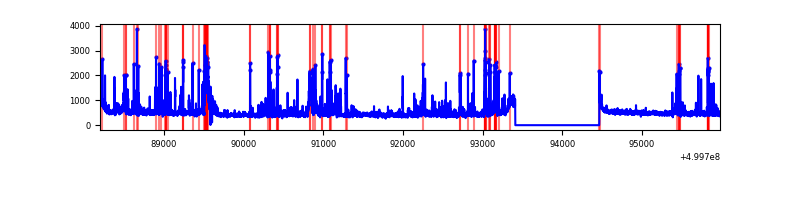 |
| D | 7778 | 6724 | 51 | 51 | 0.66% | 0.76% | 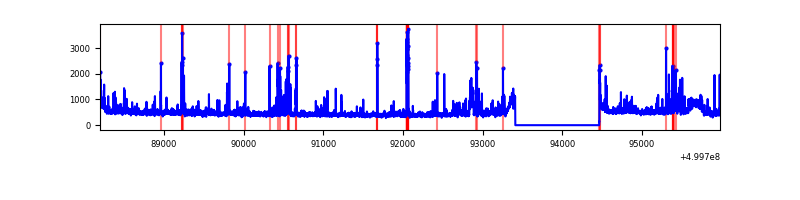 |
Top three noisy pixels from each quadrant. If the there are fewer than three noisy pixels in the level2.evt file, extra rows are filled as -1
| Pixel properties | Quadrant properties | ||||||
|---|---|---|---|---|---|---|---|
| Quadrant | DetID | PixID | Counts | Sigma | Mean | Median | Sigma |
| A | 11 | 3 | 218593 | 1170.99 | 759 | 740 | 186.0 |
| A | 5 | 240 | 105940 | 565.46 | 759 | 740 | 186.0 |
| A | 5 | 243 | 100650 | 537.03 | 759 | 740 | 186.0 |
| B | 5 | 172 | 185663 | 1150.53 | 751 | 724 | 160.7 |
| B | 10 | 247 | 64321 | 395.65 | 751 | 724 | 160.7 |
| B | 7 | 0 | 39580 | 241.73 | 751 | 724 | 160.7 |
| C | 13 | 3 | 535270 | 2642.72 | 733 | 725 | 202.3 |
| C | 6 | 223 | 154795 | 761.7 | 733 | 725 | 202.3 |
| C | 1 | 93 | 107219 | 526.49 | 733 | 725 | 202.3 |
| D | 3 | 144 | 183642 | 876.85 | 744 | 712 | 208.6 |
| D | 8 | 160 | 129319 | 616.46 | 744 | 712 | 208.6 |
| D | 8 | 240 | 92836 | 441.58 | 744 | 712 | 208.6 |
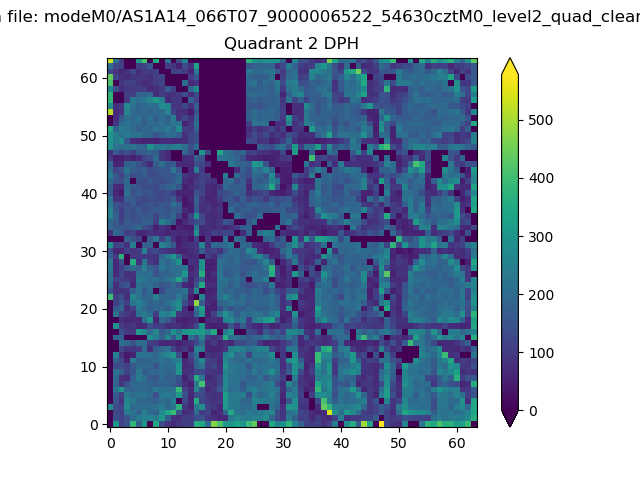
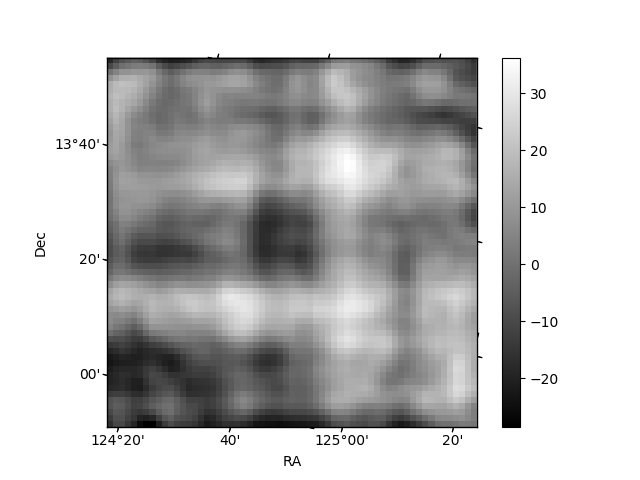
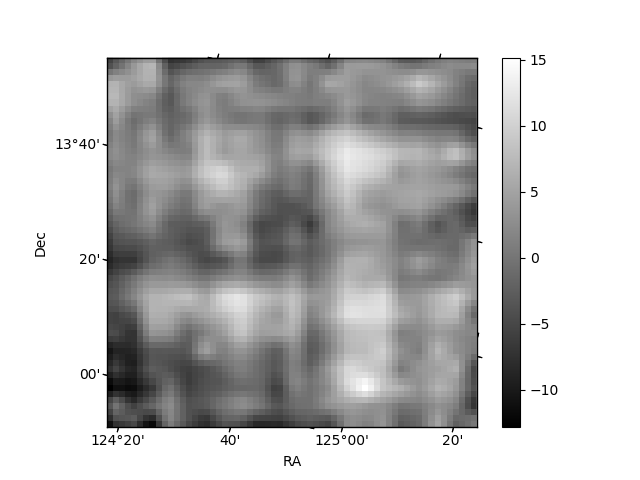
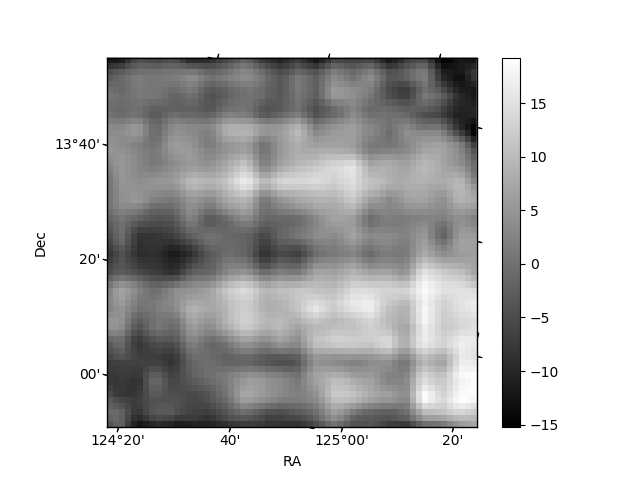
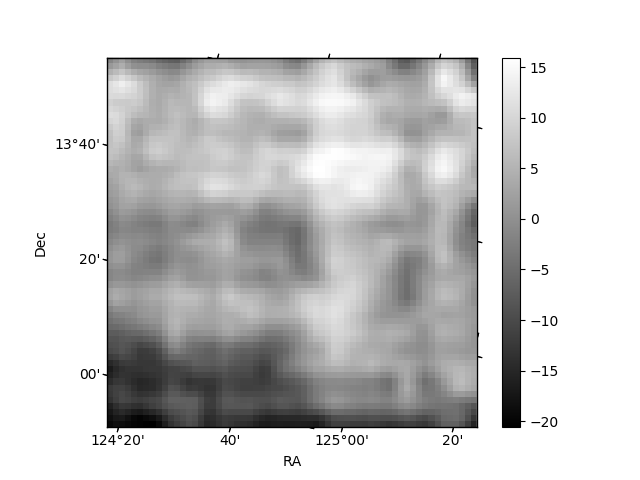
Histogram calculated using DETX and DETY for each event in the final _common_clean file
| Quadrant A | 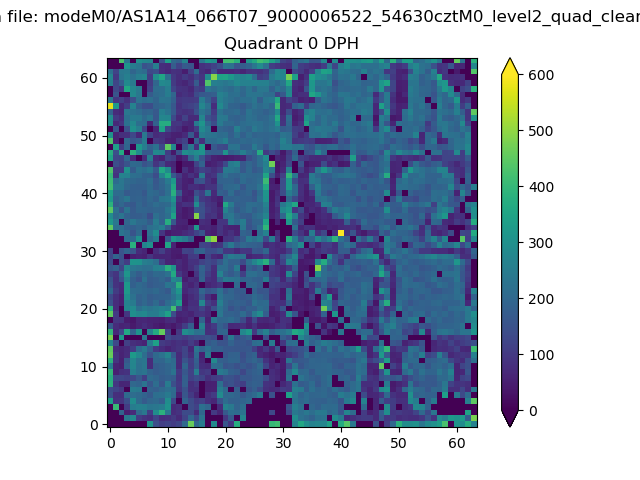 |
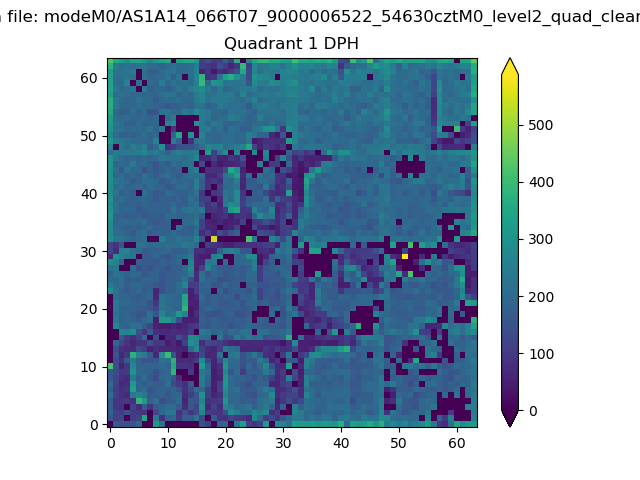 |
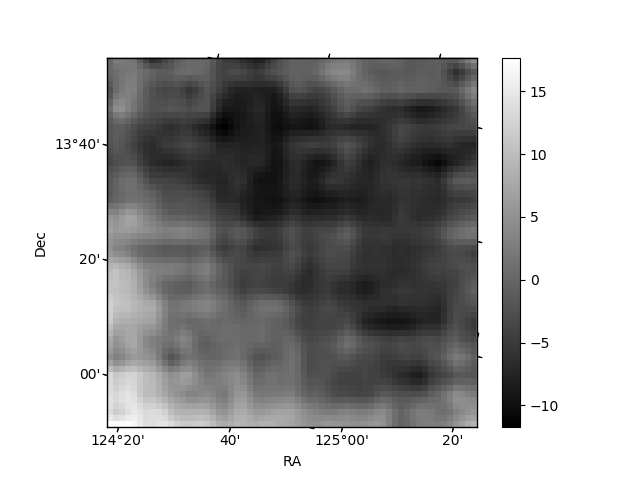
Quadrant B |
|---|---|---|---|
| Quadrant D | 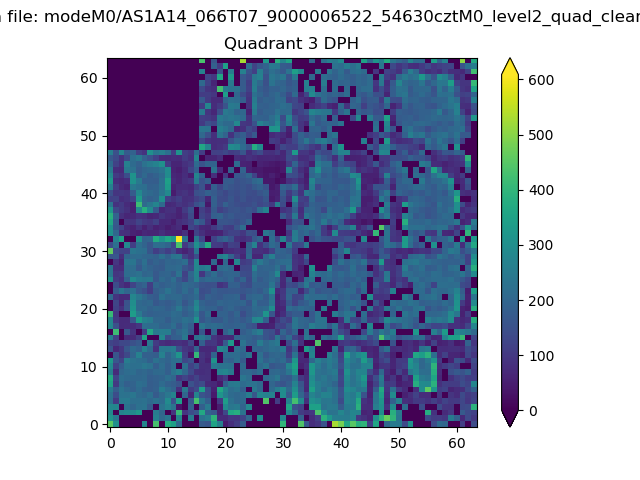 |
 |
Quadrant C |
| Plot type | Count rate plots | Images |
|---|---|---|
| Comparison with Poisson distribution Blue bars denote a histogram of data divided into 1 sec bins. Red curve is a Poisson curve with rate = median count rate of data. |
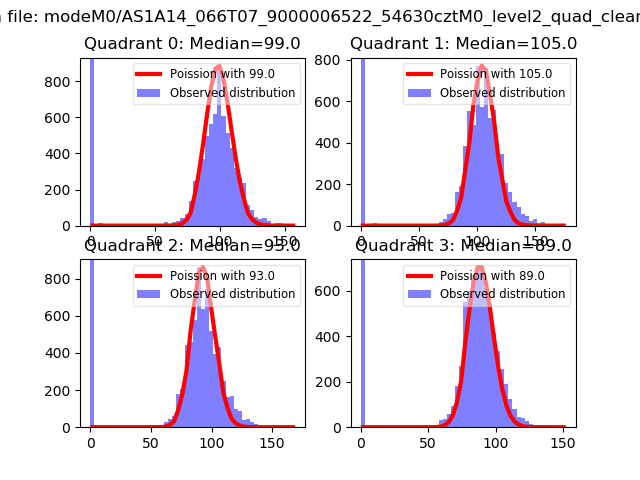 |
 |
| Quadrant-wise count rates Data is divided into 100 sec bins |
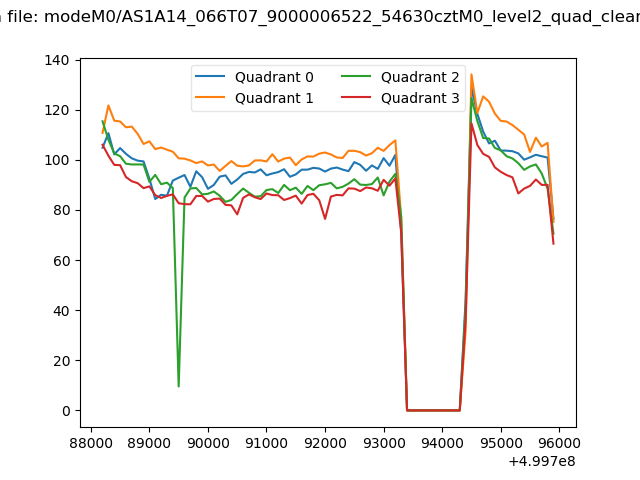 |
|
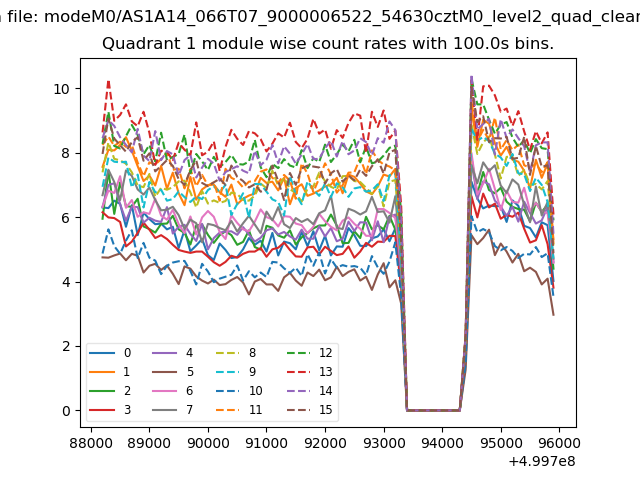
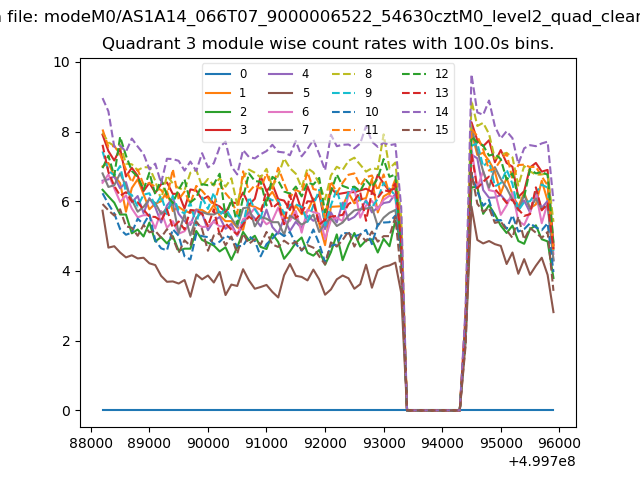
| Module-wise count rates for Quadrant A Data is divided into 100 sec bins |
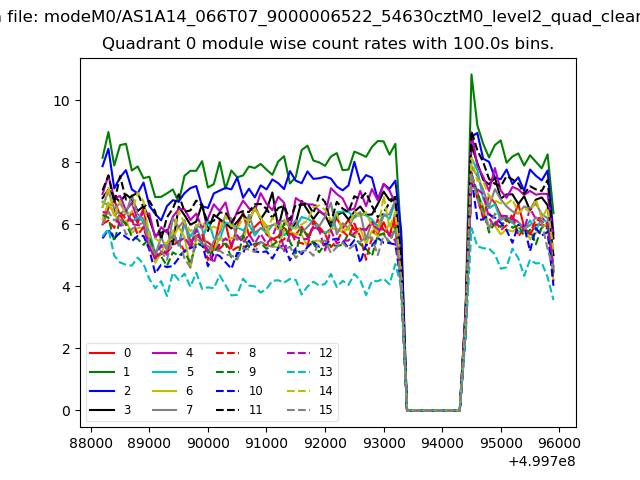 |
 |
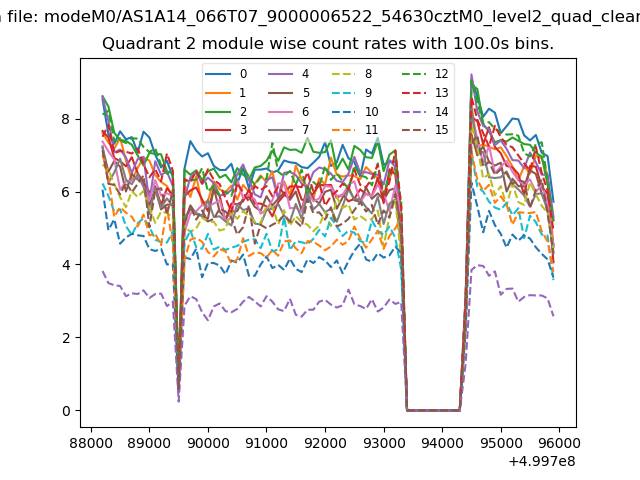
| Module-wise count rates for Quadrant B Data is divided into 100 sec bins |
 |
 |
| Module-wise count rates for Quadrant C Data is divided into 100 sec bins |
 |
 |
| Module-wise count rates for Quadrant D Data is divided into 100 sec bins |
 |
 |
| Parameter | Plot |
|---|---|
| CZT HV Monitor | 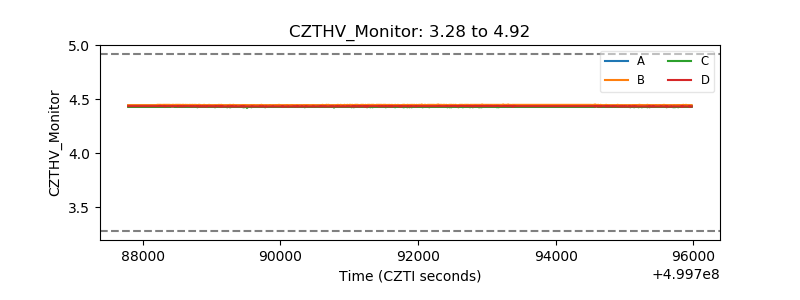 |
| D_VDD | 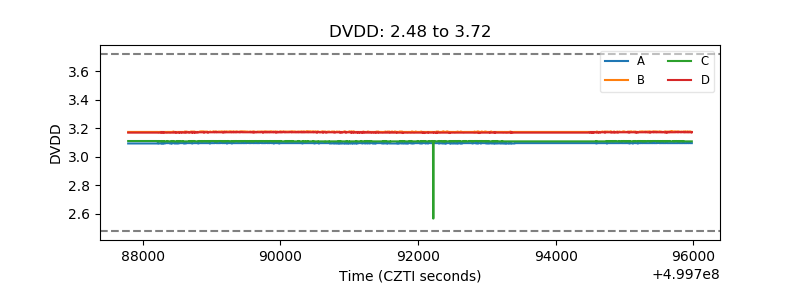 |
| Temperature 1 | 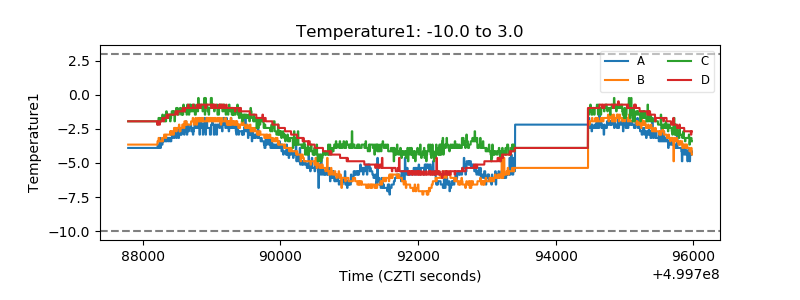 |
| Veto HV Monitor |  |
| Veto LLD | 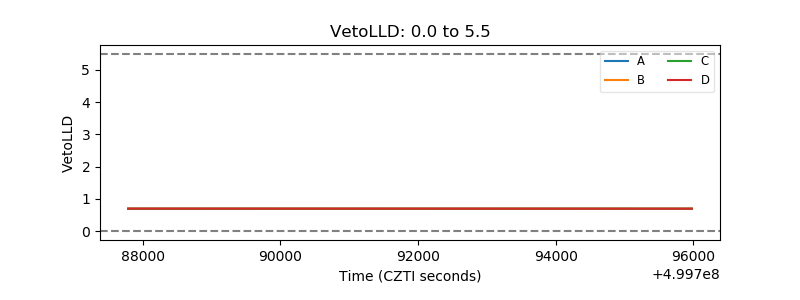 |
| Alpha Counter | 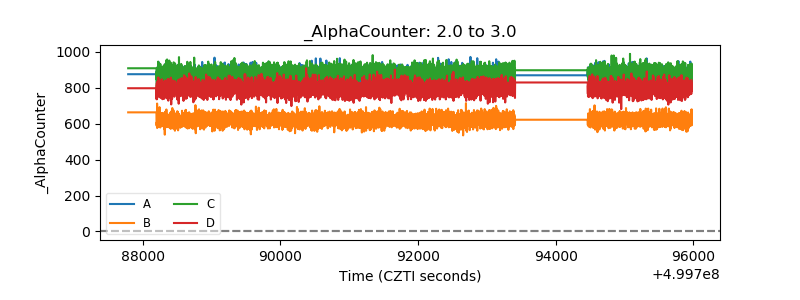 |
| _CPM_Rate | 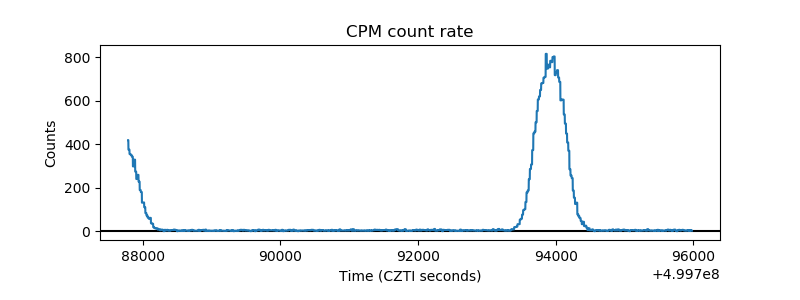 |
| CZT Counter | 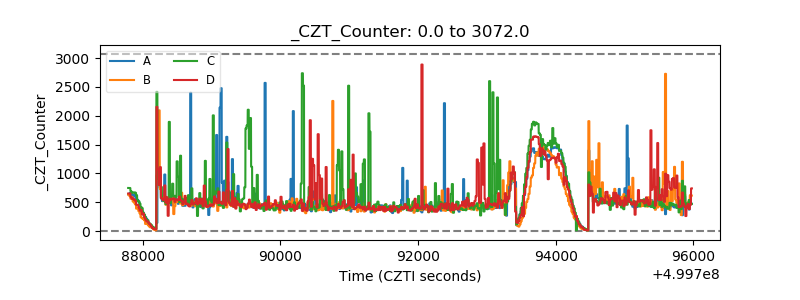 |
| +2.5 Volts monitor |  |
| +5 Volts monitor | 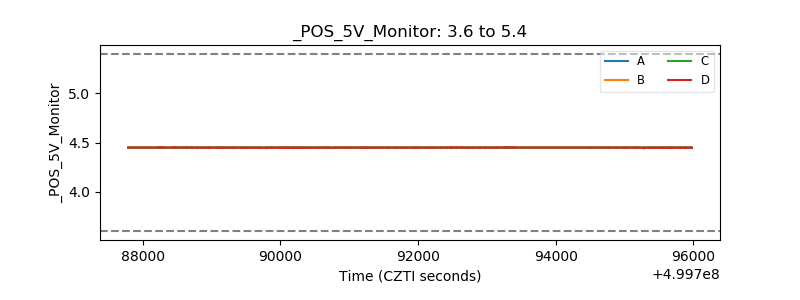 |
| _ROLL_ROT | 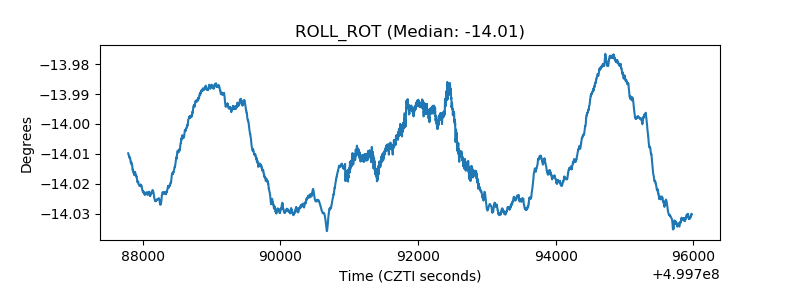 |
| _Roll_DEC | 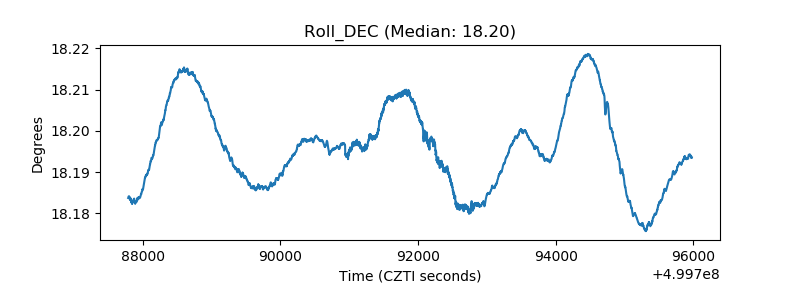 |
| _Roll_RA | 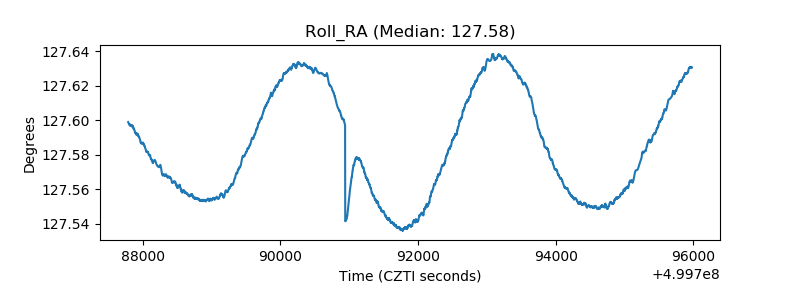 |
| Veto Counter | 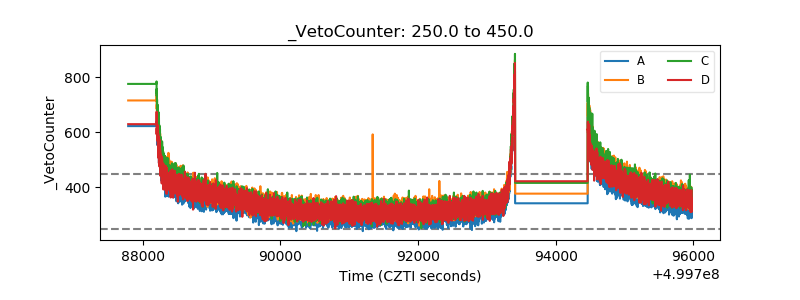 |