| Param | Original file | Final file |
|---|---|---|
| Filename | modeM0/AS1A14_066T07_9000006522_54631cztM0_level2.fits | modeM0/AS1A14_066T07_9000006522_54631cztM0_level2_quad_clean.evt |
| Size (bytes) | 395,447,040 | 94,371,840 |
| Size | 377.1 MB | 90.0 MB |
| Events in quadrant A | 3,358,908 | 629,224 |
| Events in quadrant B | 3,362,555 | 662,171 |
| Events in quadrant C | 4,139,028 | 566,308 |
| Events in quadrant D | 3,294,722 | 567,456 |
| Mode M9 | |||
|---|---|---|---|
| Quadrant | BADHDUFLAG | Total packets | Discarded packets |
| A | 0 | 12 | 0 |
| B | 0 | 12 | 0 |
| C | 0 | 12 | 0 |
| D | 0 | 12 | 0 |
| Mode M0 | |||
|---|---|---|---|
| Quadrant | BADHDUFLAG | Total packets | Discarded packets |
| A | 0 | 14203 | 1 |
| B | 0 | 14311 | 1 |
| C | 0 | 16676 | 1 |
| D | 0 | 14198 | 1 |
| Mode SS | |||
|---|---|---|---|
| Quadrant | BADHDUFLAG | Total packets | Discarded packets |
| A | 0 | 124 | 0 |
| B | 0 | 124 | 0 |
| C | 0 | 124 | 0 |
| D | 0 | 124 | 0 |
| Quadrant | Total seconds | Saturated seconds | Saturation percentage |
|---|---|---|---|
| A | 6203 | 141 | 2.273094% |
| B | 6202 | 191 | 3.079652% |
| C | 6202 | 466 | 7.513705% |
| D | 6203 | 89 | 1.434790% |
Noise dominated data is calculated using 1-second bins in cleaned event files. If a bin has >2000 counts, and if more than 50% of those come from <1% of pixels, then it is considered to be noise-dominated and hence unusable.
| Quadrant | # 1 sec bins | Bins with >0 counts | Bins with >2000 counts | High rate bins dominated by noise | Noise dominated (total time) | Noise dominated (detector-on time) | Marked lightcurve |
|---|---|---|---|---|---|---|---|
| A | 7348 | 6204 | 68 | 68 | 0.93% | 1.10% | 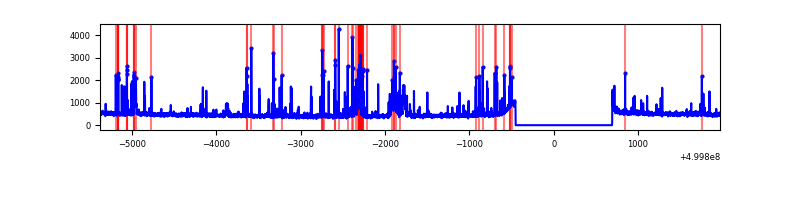 |
| B | 7347 | 6203 | 39 | 39 | 0.53% | 0.63% | 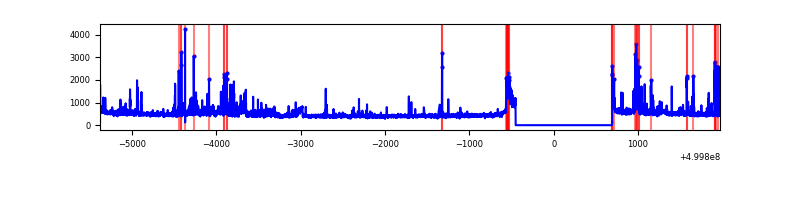 |
| C | 7347 | 6203 | 376 | 376 | 5.12% | 6.06% | 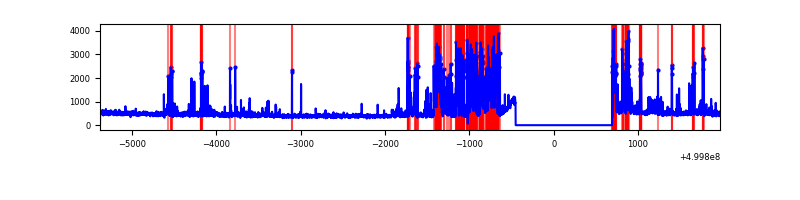 |
| D | 7348 | 6204 | 31 | 31 | 0.42% | 0.50% | 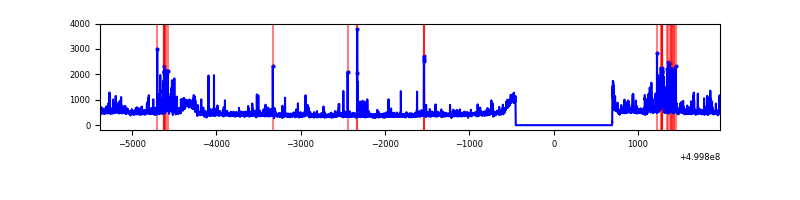 |
Top three noisy pixels from each quadrant. If the there are fewer than three noisy pixels in the level2.evt file, extra rows are filled as -1
| Pixel properties | Quadrant properties | ||||||
|---|---|---|---|---|---|---|---|
| Quadrant | DetID | PixID | Counts | Sigma | Mean | Median | Sigma |
| A | 1 | 241 | 232847 | 1331.43 | 708 | 691 | 174.4 |
| A | 11 | 3 | 156950 | 896.16 | 708 | 691 | 174.4 |
| A | 3 | 62 | 47705 | 269.63 | 708 | 691 | 174.4 |
| B | 5 | 172 | 432452 | 2886.74 | 695 | 671 | 149.6 |
| B | 1 | 207 | 44833 | 295.25 | 695 | 671 | 149.6 |
| B | 10 | 247 | 43479 | 286.2 | 695 | 671 | 149.6 |
| C | 4 | 5 | 1154757 | 6238.66 | 674 | 672 | 185.0 |
| C | 6 | 223 | 106159 | 570.23 | 674 | 672 | 185.0 |
| C | 13 | 3 | 50269 | 268.11 | 674 | 672 | 185.0 |
| D | 8 | 240 | 162167 | 817.08 | 695 | 664 | 197.7 |
| D | 8 | 160 | 116148 | 584.26 | 695 | 664 | 197.7 |
| D | 15 | 94 | 80103 | 401.9 | 695 | 664 | 197.7 |
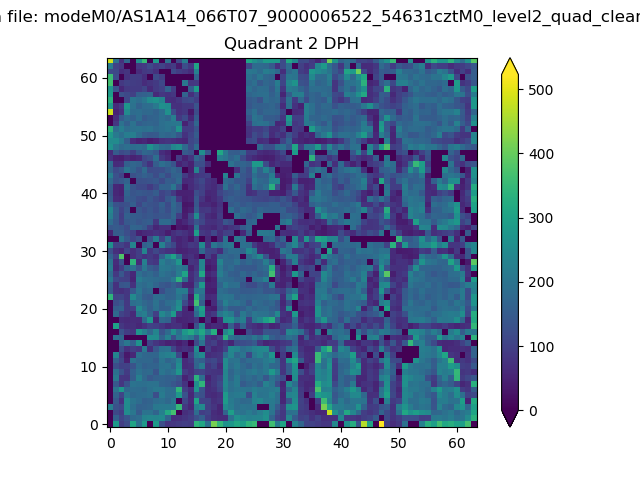
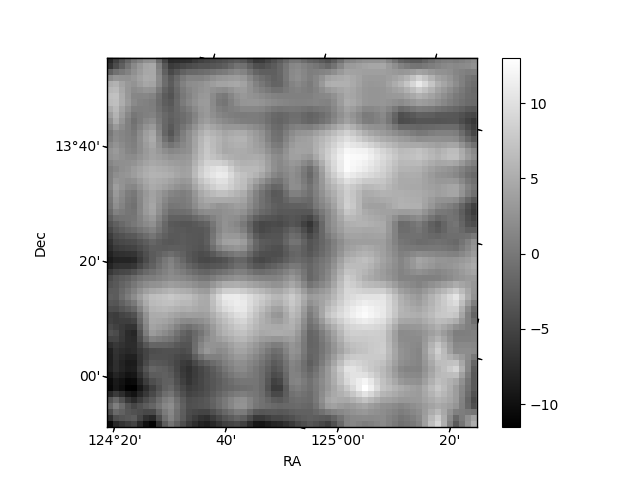
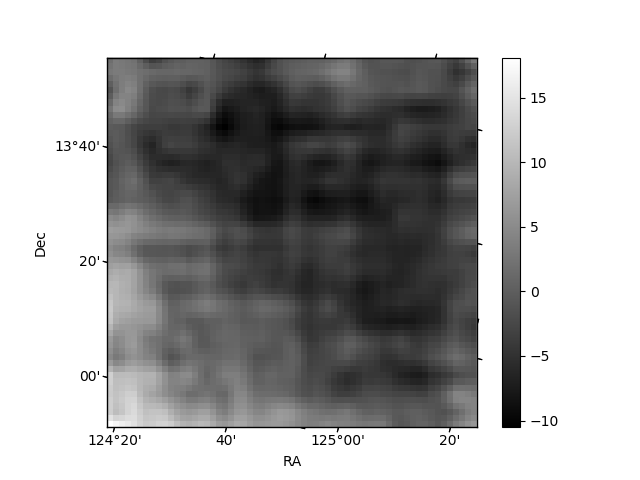
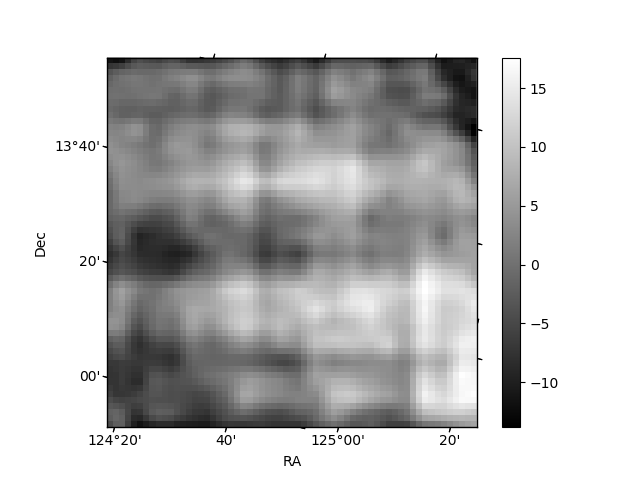
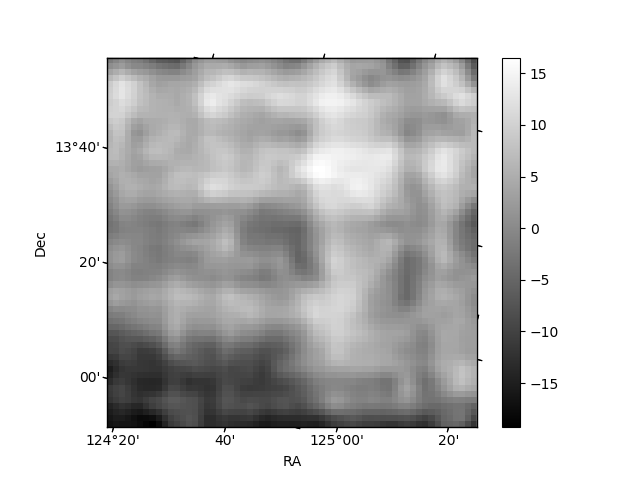
Histogram calculated using DETX and DETY for each event in the final _common_clean file
| Quadrant A | 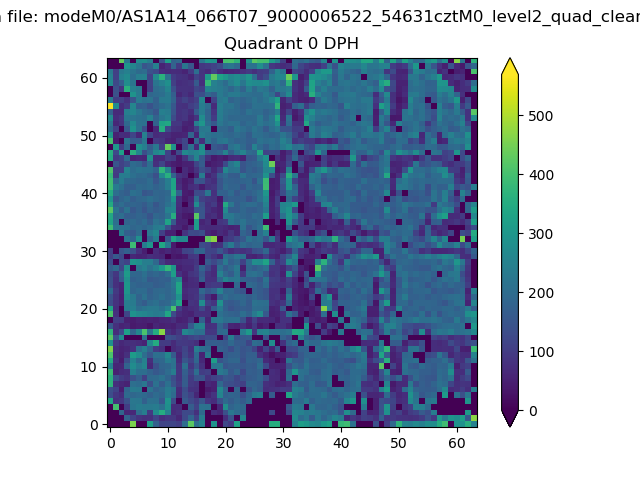 |
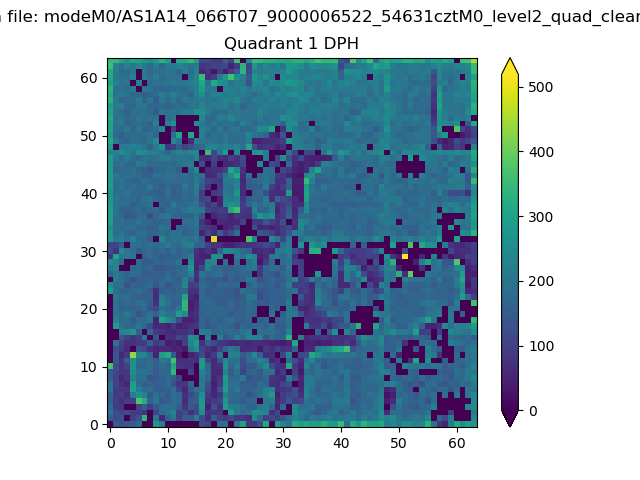 |
Quadrant B |
|---|---|---|---|
| Quadrant D | 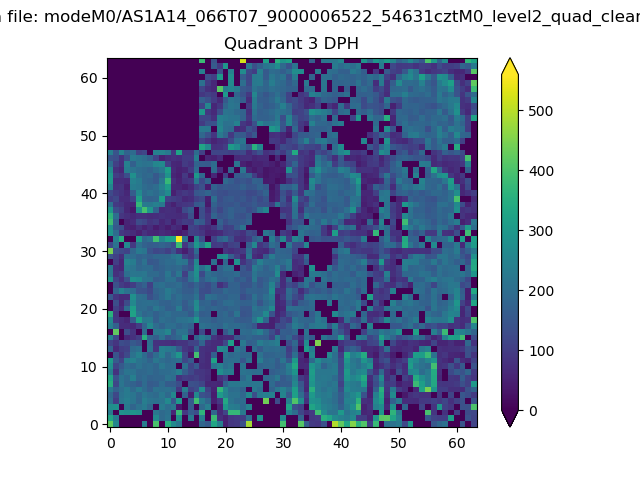 |
 |
Quadrant C |
| Plot type | Count rate plots | Images |
|---|---|---|
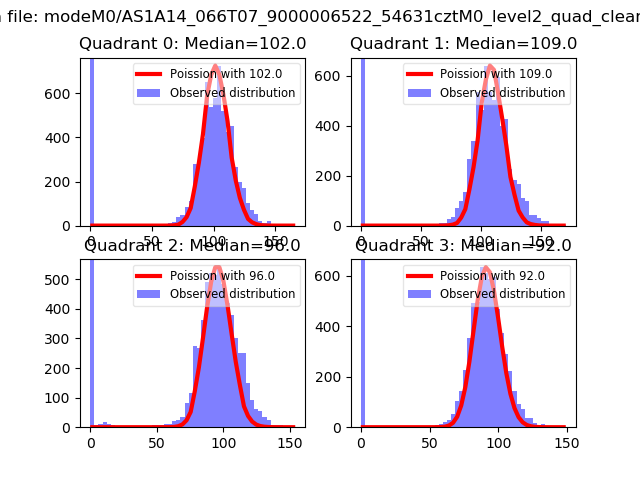
| Comparison with Poisson distribution Blue bars denote a histogram of data divided into 1 sec bins. Red curve is a Poisson curve with rate = median count rate of data. |
 |
 |
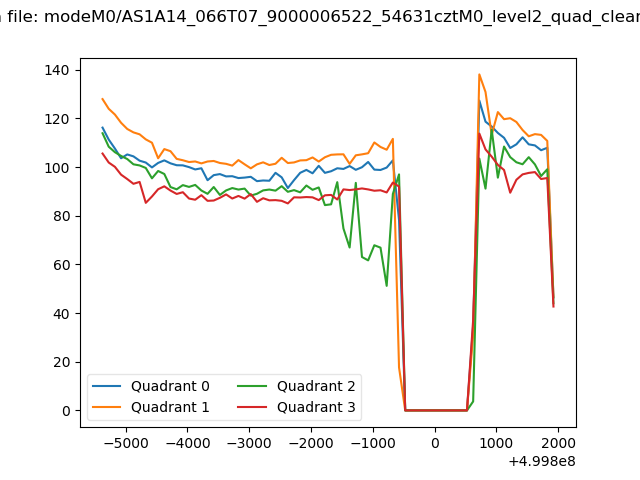
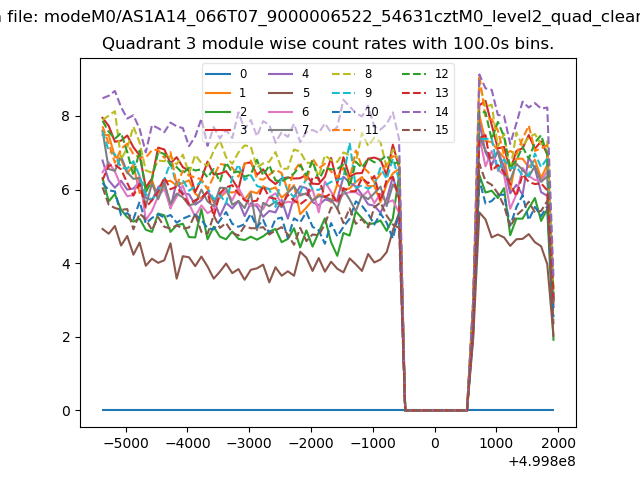
| Quadrant-wise count rates Data is divided into 100 sec bins |
 |
|
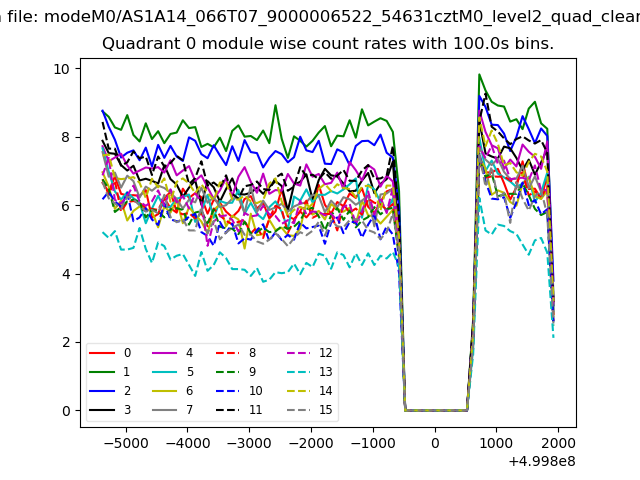
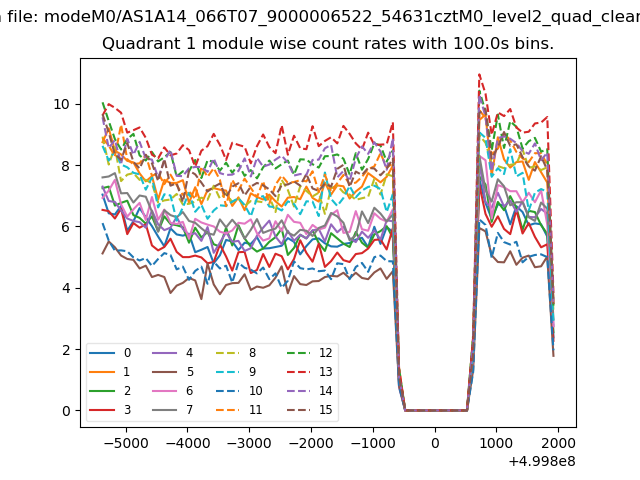
| Module-wise count rates for Quadrant A Data is divided into 100 sec bins |
 |
 |
| Module-wise count rates for Quadrant B Data is divided into 100 sec bins |
 |
 |
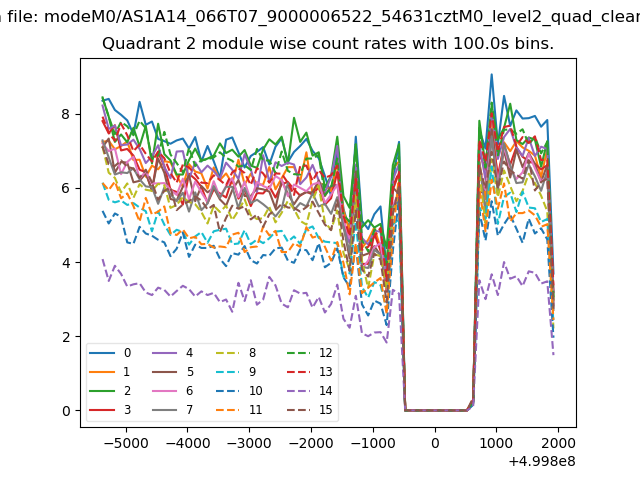
| Module-wise count rates for Quadrant C Data is divided into 100 sec bins |
 |
 |
| Module-wise count rates for Quadrant D Data is divided into 100 sec bins |
 |
 |
| Parameter | Plot |
|---|---|
| CZT HV Monitor | 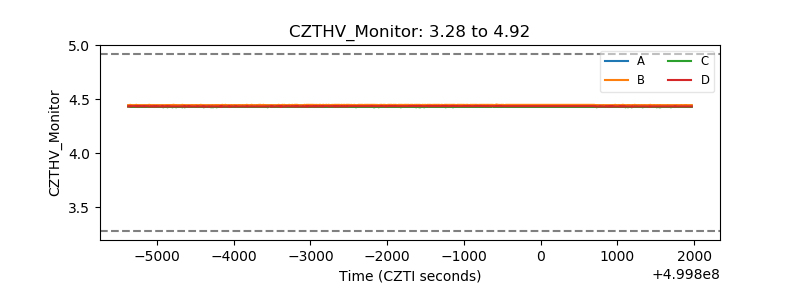 |
| D_VDD | 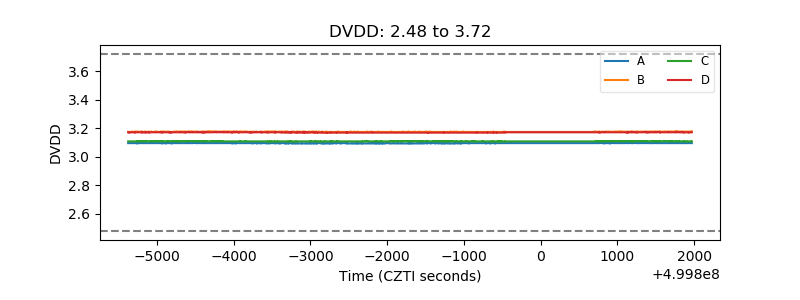 |
| Temperature 1 | 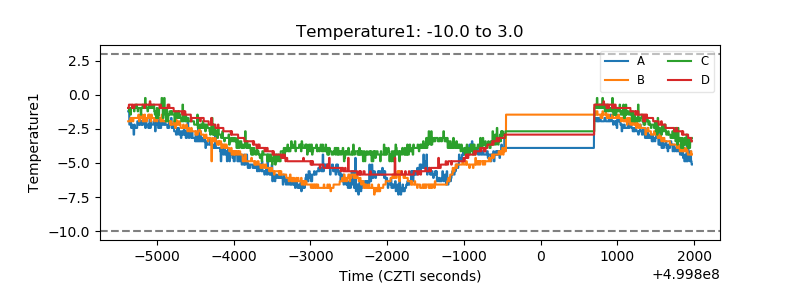 |
| Veto HV Monitor | 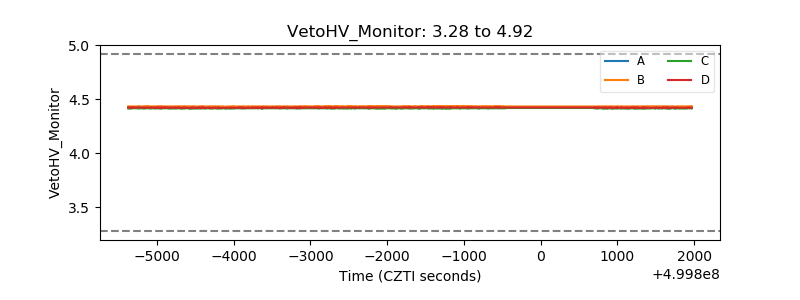 |
| Veto LLD | 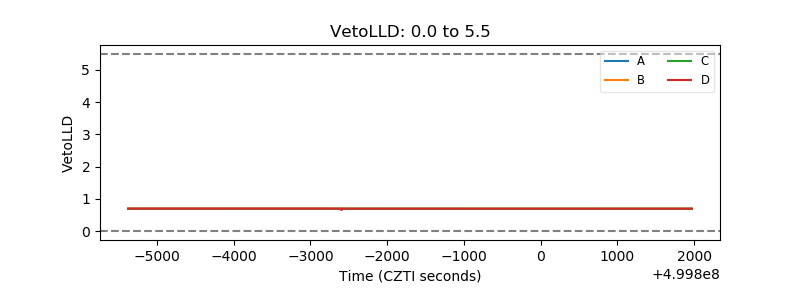 |
| Alpha Counter | 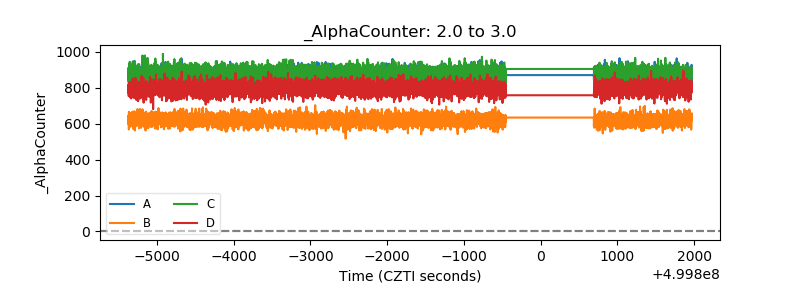 |
| _CPM_Rate | 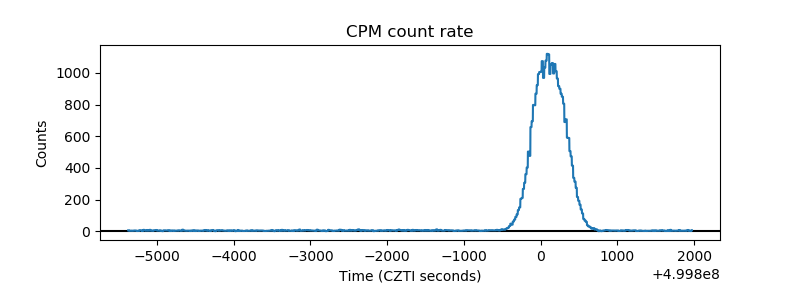 |
| CZT Counter | 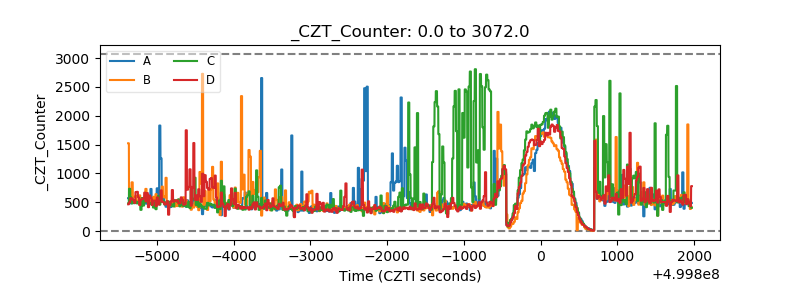 |
| +2.5 Volts monitor |  |
| +5 Volts monitor | 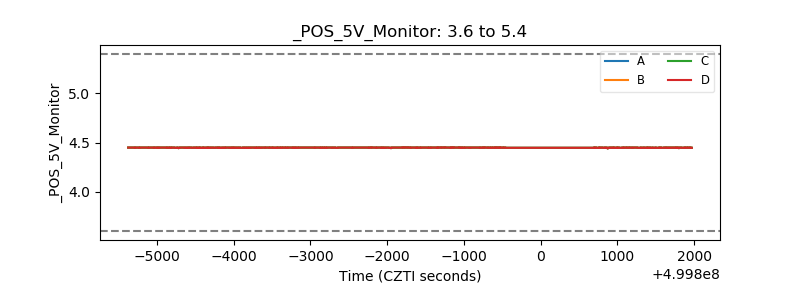 |
| _ROLL_ROT | 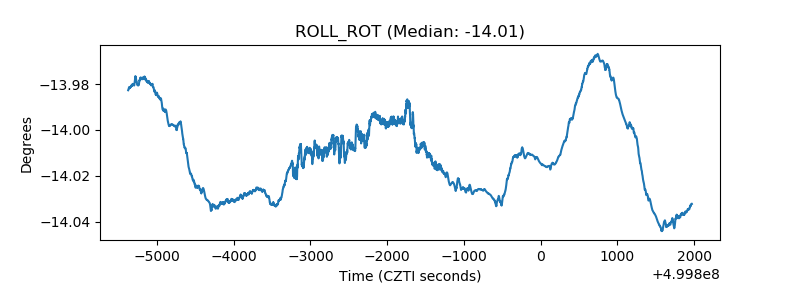 |
| _Roll_DEC | 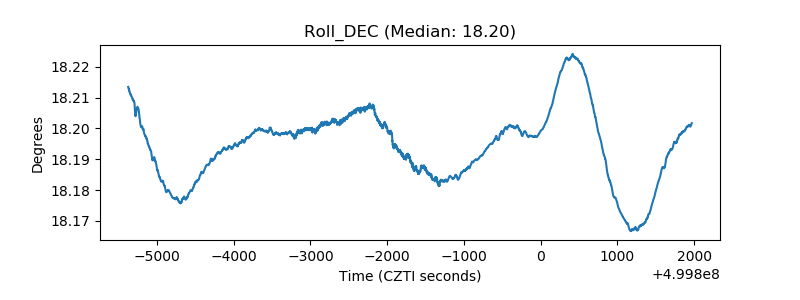 |
| _Roll_RA | 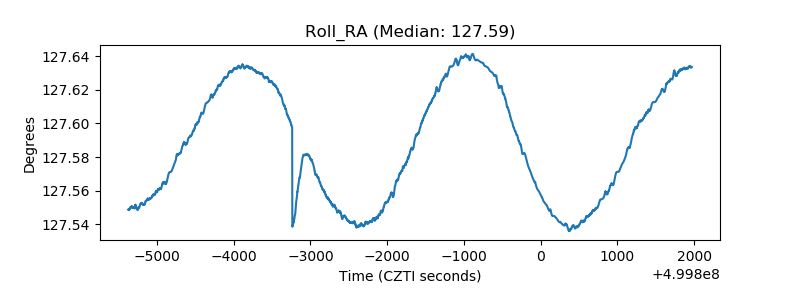 |
| Veto Counter | 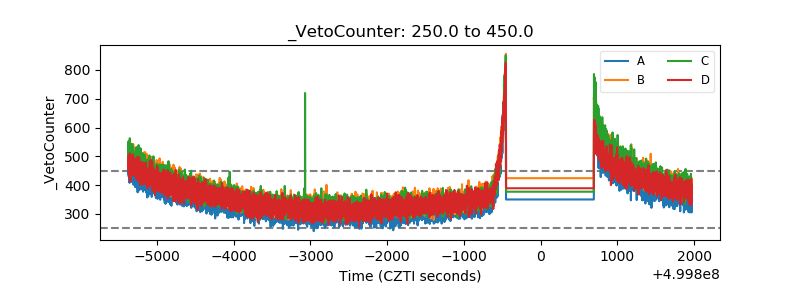 |