| Param | Original file | Final file |
|---|---|---|
| Filename | modeM0/AS1A14_066T07_9000006522_54633cztM0_level2.fits | modeM0/AS1A14_066T07_9000006522_54633cztM0_level2_quad_clean.evt |
| Size (bytes) | 443,563,200 | 95,829,120 |
| Size | 423.0 MB | 91.4 MB |
| Events in quadrant A | 3,528,401 | 641,895 |
| Events in quadrant B | 3,430,118 | 689,701 |
| Events in quadrant C | 3,669,529 | 593,952 |
| Events in quadrant D | 5,295,756 | 531,835 |
| Mode M9 | |||
|---|---|---|---|
| Quadrant | BADHDUFLAG | Total packets | Discarded packets |
| A | 0 | 19 | 0 |
| B | 0 | 20 | 0 |
| C | 0 | 20 | 0 |
| D | 0 | 20 | 0 |
| Mode M0 | |||
|---|---|---|---|
| Quadrant | BADHDUFLAG | Total packets | Discarded packets |
| A | 0 | 15034 | 2 |
| B | 0 | 14567 | 2 |
| C | 0 | 15413 | 2 |
| D | 0 | 20152 | 2 |
| Mode SS | |||
|---|---|---|---|
| Quadrant | BADHDUFLAG | Total packets | Discarded packets |
| A | 0 | 130 | 0 |
| B | 0 | 130 | 0 |
| C | 0 | 130 | 0 |
| D | 0 | 130 | 0 |
| Quadrant | Total seconds | Saturated seconds | Saturation percentage |
|---|---|---|---|
| A | 6370 | 193 | 3.029827% |
| B | 6370 | 187 | 2.935636% |
| C | 6370 | 269 | 4.222920% |
| D | 6369 | 680 | 10.676715% |
Noise dominated data is calculated using 1-second bins in cleaned event files. If a bin has >2000 counts, and if more than 50% of those come from <1% of pixels, then it is considered to be noise-dominated and hence unusable.
| Quadrant | # 1 sec bins | Bins with >0 counts | Bins with >2000 counts | High rate bins dominated by noise | Noise dominated (total time) | Noise dominated (detector-on time) | Marked lightcurve |
|---|---|---|---|---|---|---|---|
| A | 7520 | 6371 | 106 | 106 | 1.41% | 1.66% | 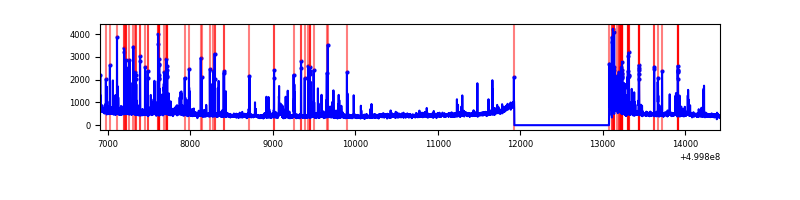 |
| B | 7520 | 6371 | 85 | 85 | 1.13% | 1.33% | 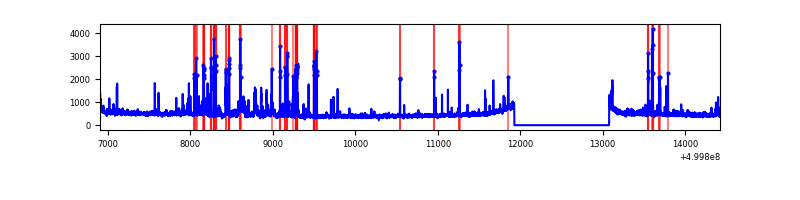 |
| C | 7520 | 6371 | 147 | 147 | 1.95% | 2.31% | 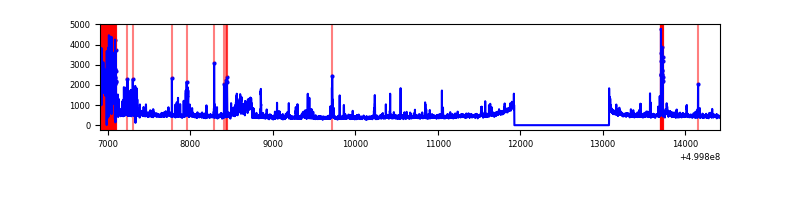 |
| D | 7519 | 6370 | 614 | 614 | 8.17% | 9.64% | 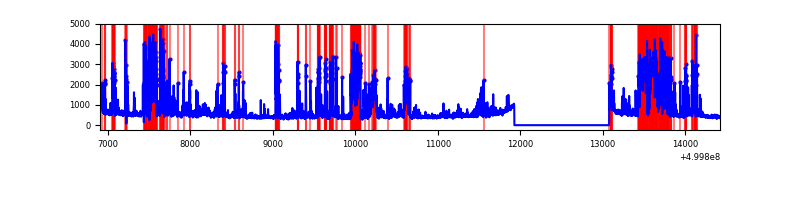 |
Top three noisy pixels from each quadrant. If the there are fewer than three noisy pixels in the level2.evt file, extra rows are filled as -1
| Pixel properties | Quadrant properties | ||||||
|---|---|---|---|---|---|---|---|
| Quadrant | DetID | PixID | Counts | Sigma | Mean | Median | Sigma |
| A | 13 | 248 | 395355 | 2214.38 | 720 | 704 | 178.2 |
| A | 11 | 3 | 179250 | 1001.82 | 720 | 704 | 178.2 |
| A | 3 | 62 | 56260 | 311.72 | 720 | 704 | 178.2 |
| B | 1 | 207 | 343455 | 2228.86 | 716 | 691 | 153.8 |
| B | 5 | 172 | 205975 | 1334.88 | 716 | 691 | 153.8 |
| B | 10 | 247 | 20818 | 130.88 | 716 | 691 | 153.8 |
| C | 4 | 5 | 424980 | 2267.89 | 683 | 681 | 187.1 |
| C | 13 | 3 | 224237 | 1194.91 | 683 | 681 | 187.1 |
| C | 6 | 223 | 108414 | 575.84 | 683 | 681 | 187.1 |
| D | 2 | 16 | 1056780 | 5619.23 | 662 | 633 | 188.0 |
| D | 3 | 12 | 1021237 | 5430.13 | 662 | 633 | 188.0 |
| D | 2 | 172 | 283700 | 1506.06 | 662 | 633 | 188.0 |
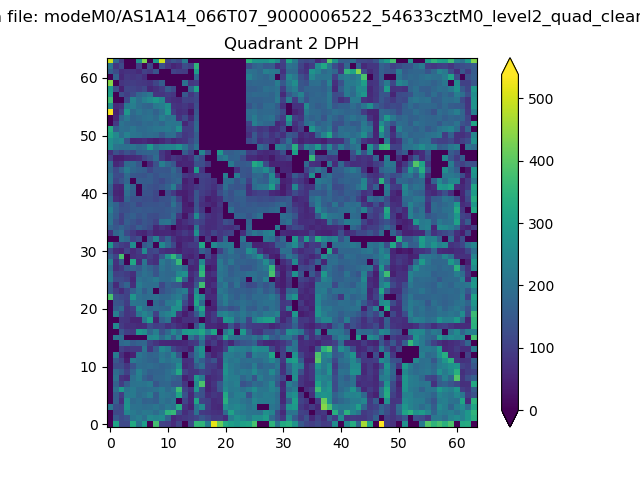
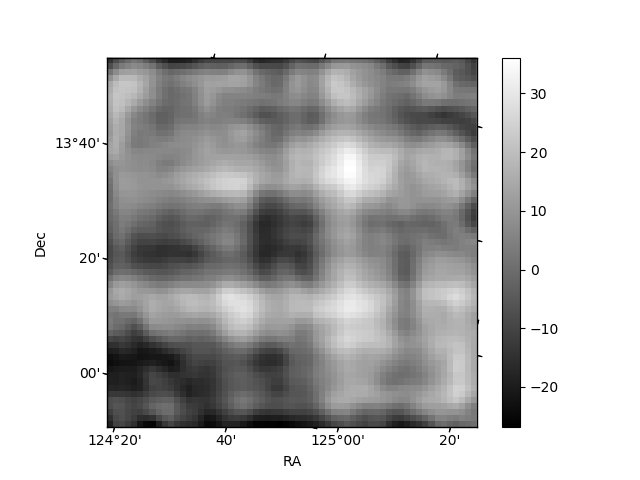
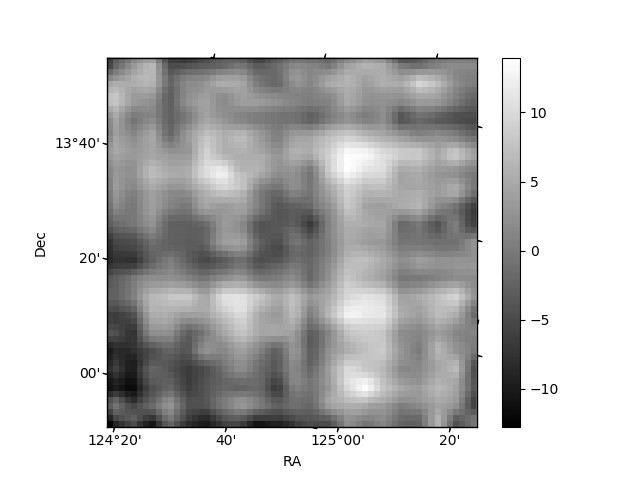
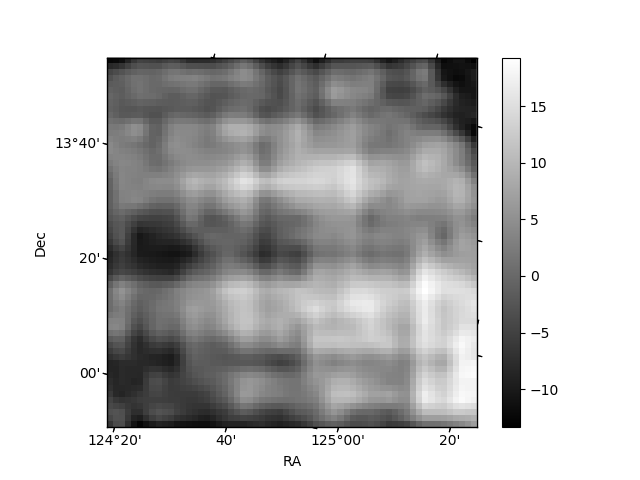
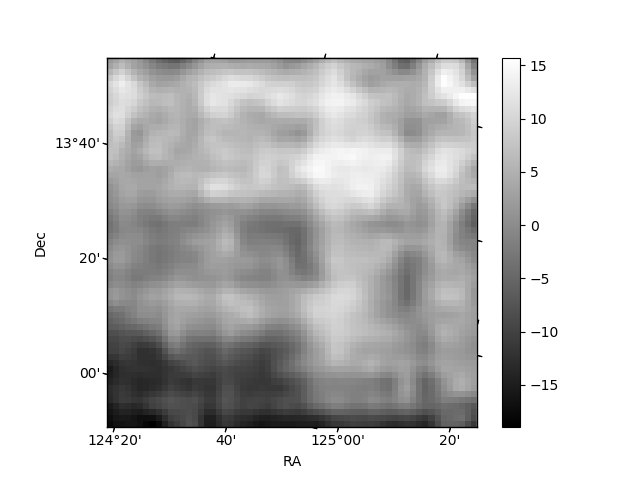
Histogram calculated using DETX and DETY for each event in the final _common_clean file
| Quadrant A | 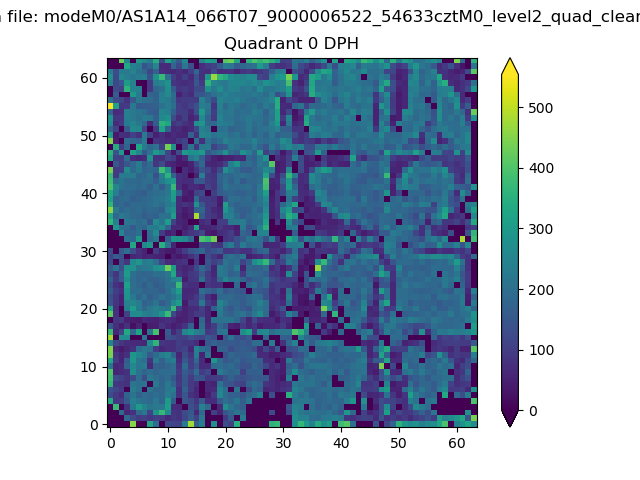 |
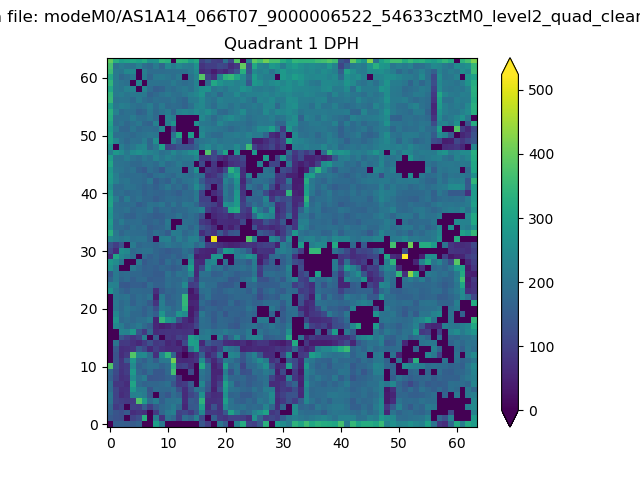 |
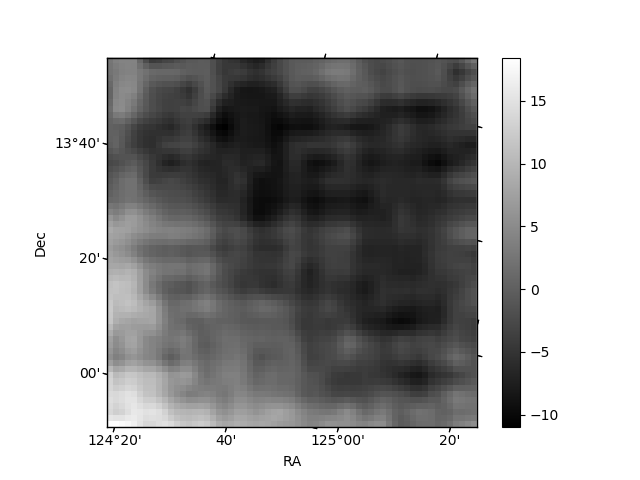
Quadrant B |
|---|---|---|---|
| Quadrant D | 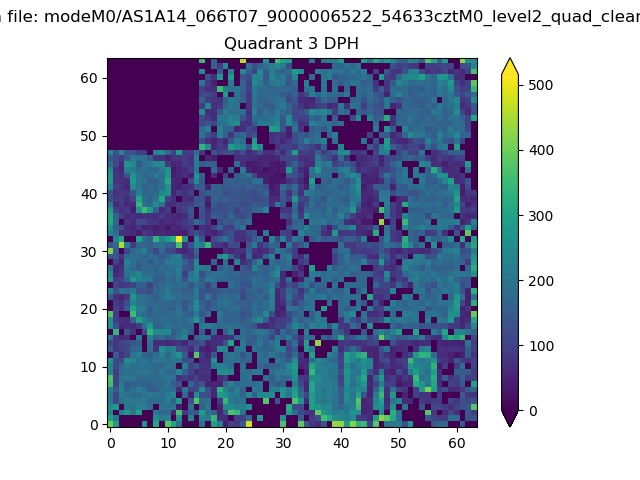 |
 |
Quadrant C |
| Plot type | Count rate plots | Images |
|---|---|---|
| Comparison with Poisson distribution Blue bars denote a histogram of data divided into 1 sec bins. Red curve is a Poisson curve with rate = median count rate of data. |
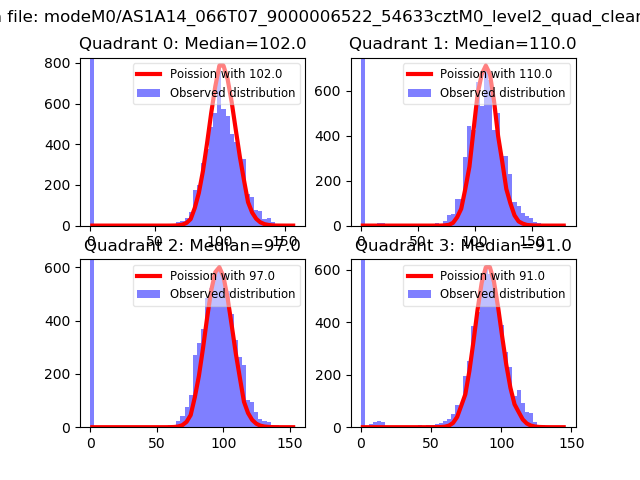 |
 |
| Quadrant-wise count rates Data is divided into 100 sec bins |
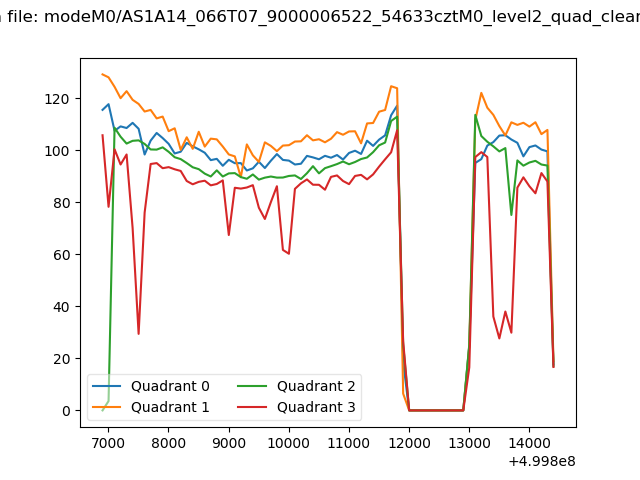 |
|
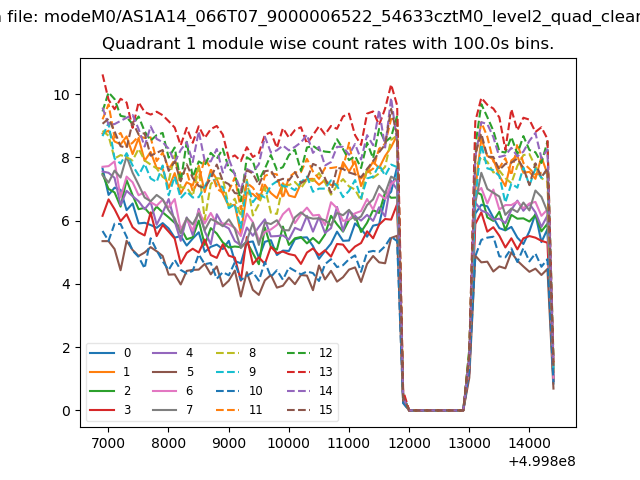
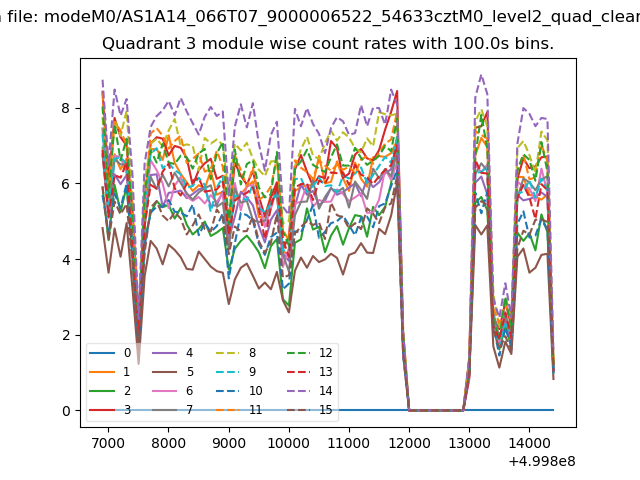
| Module-wise count rates for Quadrant A Data is divided into 100 sec bins |
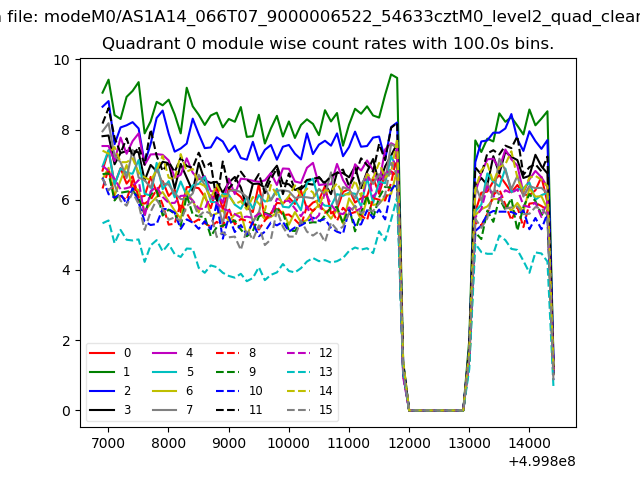 |
 |
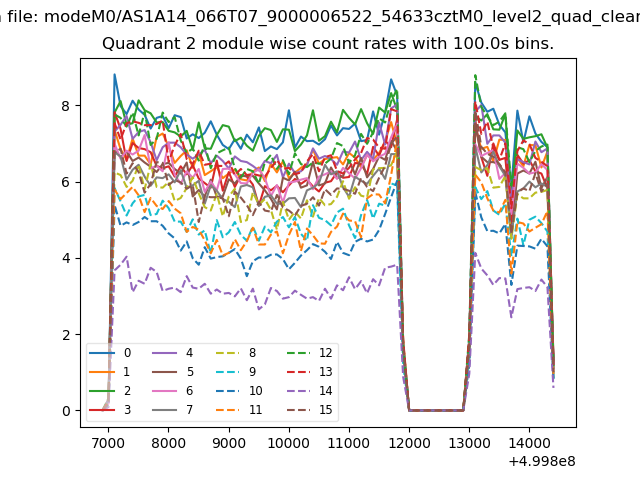
| Module-wise count rates for Quadrant B Data is divided into 100 sec bins |
 |
 |
| Module-wise count rates for Quadrant C Data is divided into 100 sec bins |
 |
 |
| Module-wise count rates for Quadrant D Data is divided into 100 sec bins |
 |
 |
| Parameter | Plot |
|---|---|
| CZT HV Monitor | 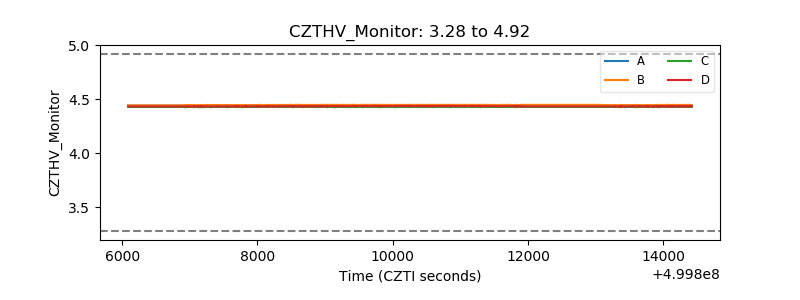 |
| D_VDD | 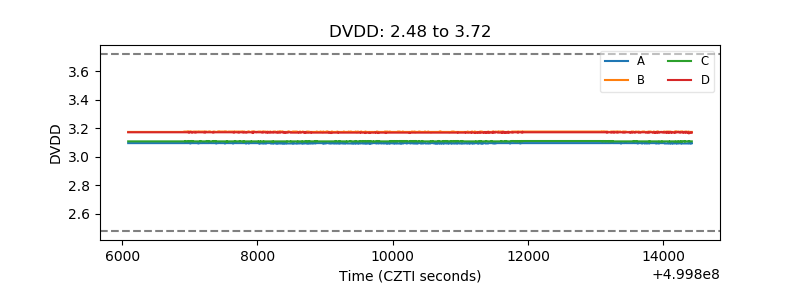 |
| Temperature 1 | 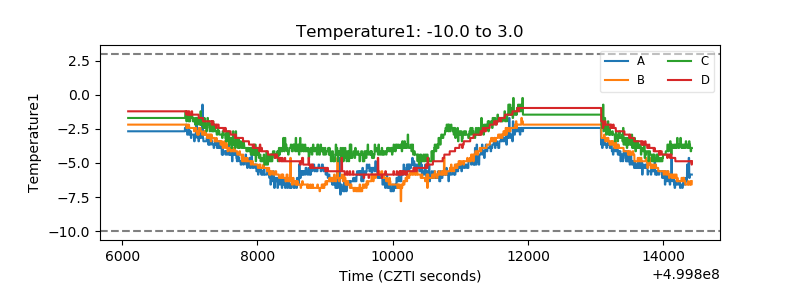 |
| Veto HV Monitor | 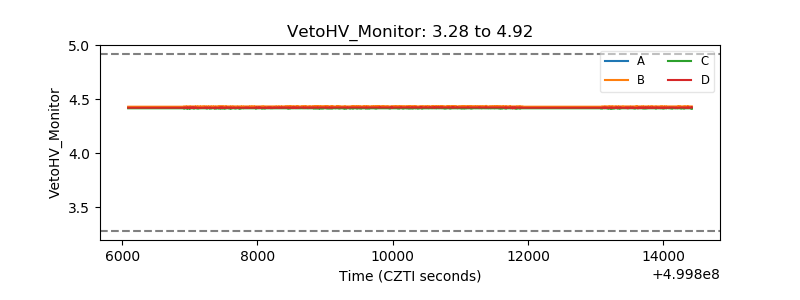 |
| Veto LLD | 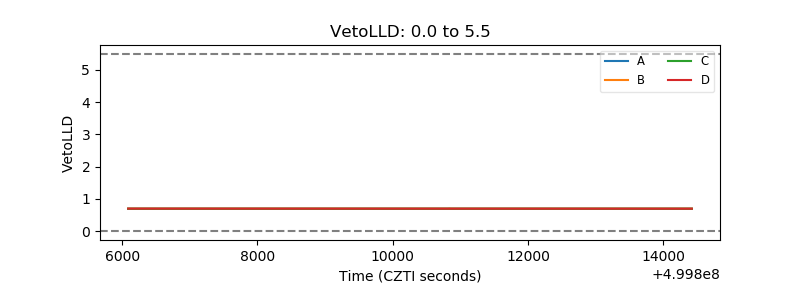 |
| Alpha Counter | 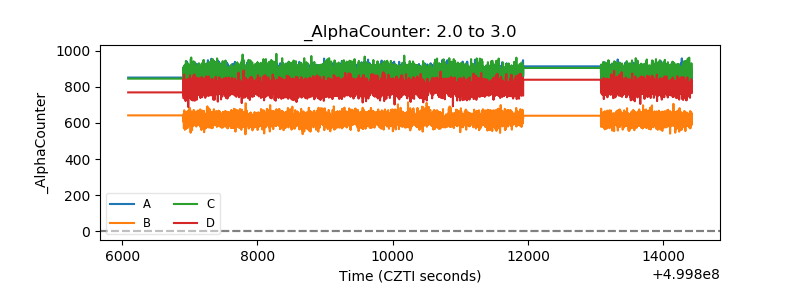 |
| _CPM_Rate | 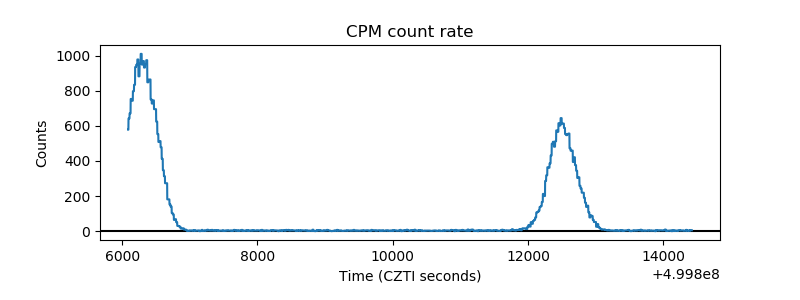 |
| CZT Counter | 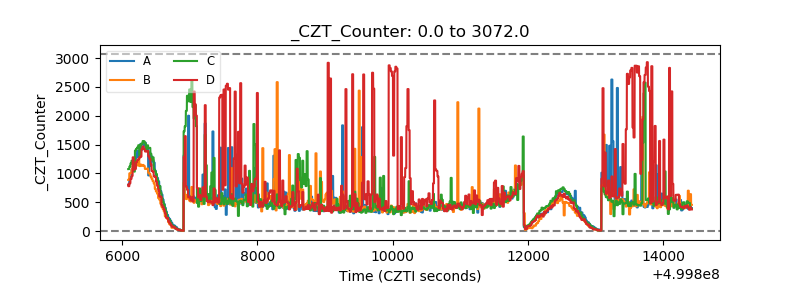 |
| +2.5 Volts monitor | 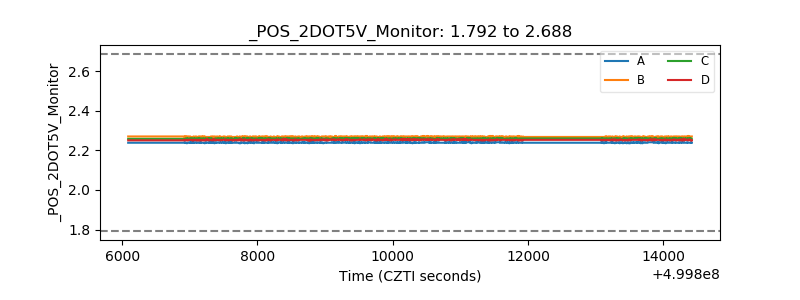 |
| +5 Volts monitor | 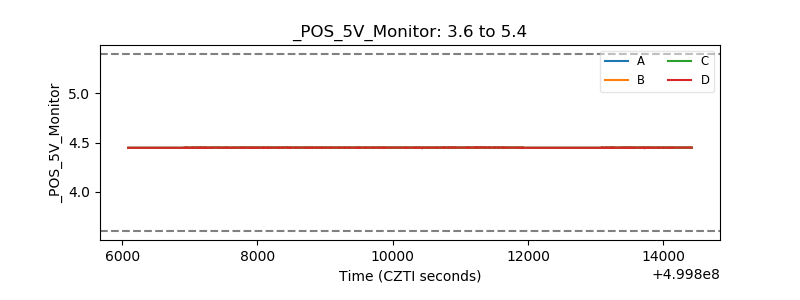 |
| _ROLL_ROT | 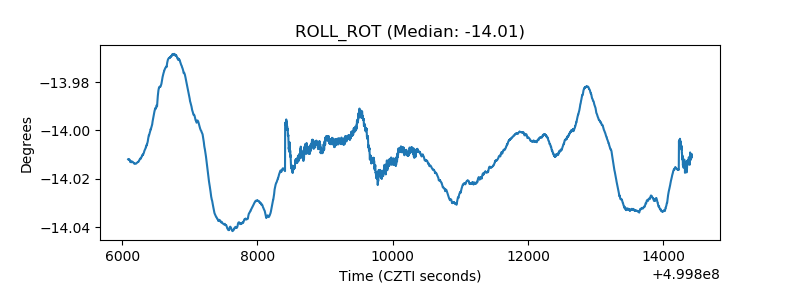 |
| _Roll_DEC | 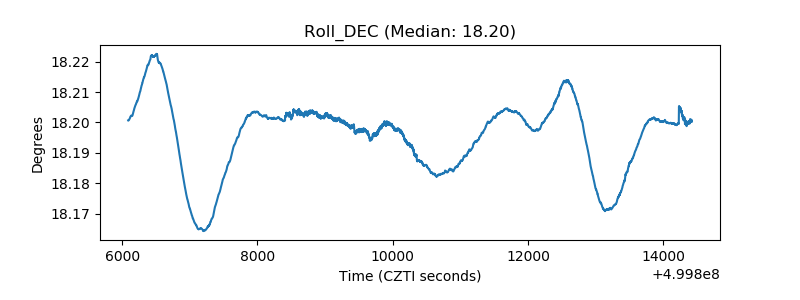 |
| _Roll_RA | 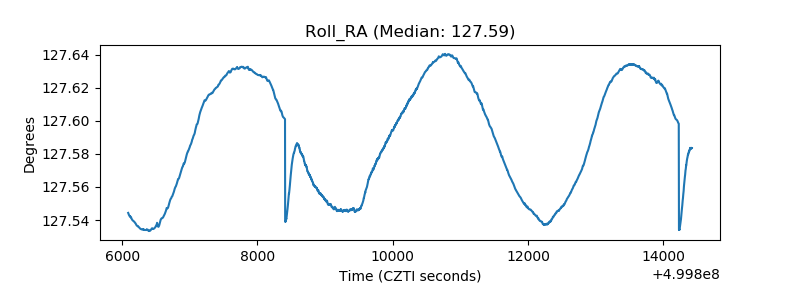 |
| Veto Counter | 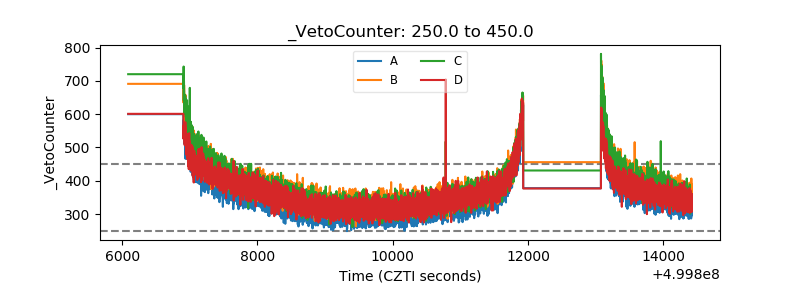 |