| Param | Original file | Final file |
|---|---|---|
| Filename | modeM0/AS1A14_066T07_9000006522_54635cztM0_level2.fits | modeM0/AS1A14_066T07_9000006522_54635cztM0_level2_quad_clean.evt |
| Size (bytes) | 454,417,920 | 116,035,200 |
| Size | 433.4 MB | 110.7 MB |
| Events in quadrant A | 4,002,337 | 757,782 |
| Events in quadrant B | 3,687,298 | 808,794 |
| Events in quadrant C | 4,176,296 | 724,379 |
| Events in quadrant D | 4,348,199 | 680,392 |
| Mode M9 | |||
|---|---|---|---|
| Quadrant | BADHDUFLAG | Total packets | Discarded packets |
| A | 0 | 18 | 0 |
| B | 0 | 18 | 0 |
| C | 0 | 18 | 0 |
| D | 0 | 18 | 0 |
| Mode M0 | |||
|---|---|---|---|
| Quadrant | BADHDUFLAG | Total packets | Discarded packets |
| A | 0 | 17697 | 2 |
| B | 0 | 16714 | 2 |
| C | 0 | 18067 | 2 |
| D | 0 | 18619 | 2 |
| Mode SS | |||
|---|---|---|---|
| Quadrant | BADHDUFLAG | Total packets | Discarded packets |
| A | 0 | 158 | 0 |
| B | 0 | 158 | 0 |
| C | 0 | 158 | 0 |
| D | 0 | 158 | 0 |
| Quadrant | Total seconds | Saturated seconds | Saturation percentage |
|---|---|---|---|
| A | 7803 | 177 | 2.268358% |
| B | 7803 | 187 | 2.396514% |
| C | 7804 | 107 | 1.371092% |
| D | 7804 | 163 | 2.088672% |
Noise dominated data is calculated using 1-second bins in cleaned event files. If a bin has >2000 counts, and if more than 50% of those come from <1% of pixels, then it is considered to be noise-dominated and hence unusable.
| Quadrant | # 1 sec bins | Bins with >0 counts | Bins with >2000 counts | High rate bins dominated by noise | Noise dominated (total time) | Noise dominated (detector-on time) | Marked lightcurve |
|---|---|---|---|---|---|---|---|
| A | 9462 | 7804 | 56 | 56 | 0.59% | 0.72% | 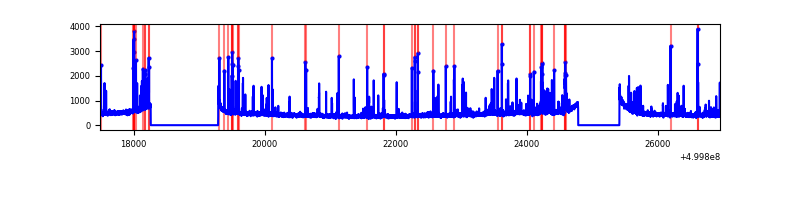 |
| B | 9462 | 7804 | 12 | 12 | 0.13% | 0.15% | 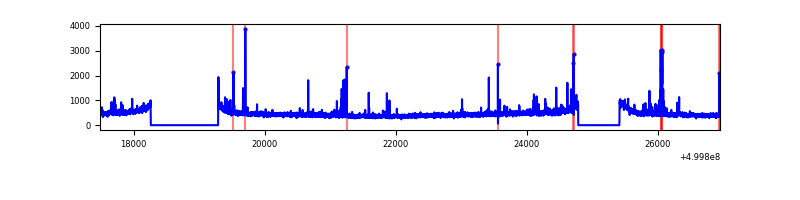 |
| C | 9464 | 7806 | 31 | 31 | 0.33% | 0.40% | 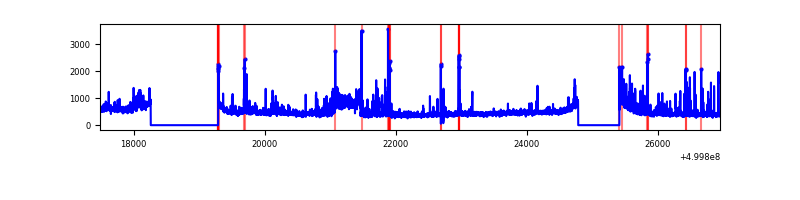 |
| D | 9464 | 7806 | 96 | 96 | 1.01% | 1.23% | 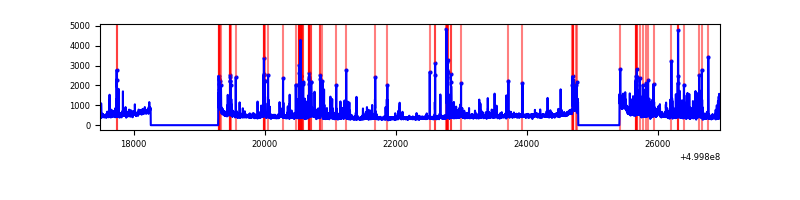 |
Top three noisy pixels from each quadrant. If the there are fewer than three noisy pixels in the level2.evt file, extra rows are filled as -1
| Pixel properties | Quadrant properties | ||||||
|---|---|---|---|---|---|---|---|
| Quadrant | DetID | PixID | Counts | Sigma | Mean | Median | Sigma |
| A | 11 | 3 | 187729 | 859.86 | 883 | 858 | 217.3 |
| A | 13 | 248 | 92473 | 421.55 | 883 | 858 | 217.3 |
| A | 5 | 240 | 82788 | 376.99 | 883 | 858 | 217.3 |
| B | 10 | 247 | 52087 | 270.55 | 878 | 844 | 189.4 |
| B | 5 | 172 | 51807 | 269.07 | 878 | 844 | 189.4 |
| B | 0 | 151 | 37648 | 194.31 | 878 | 844 | 189.4 |
| C | 1 | 16 | 349838 | 1478.61 | 865 | 856 | 236.0 |
| C | 9 | 38 | 124429 | 523.57 | 865 | 856 | 236.0 |
| C | 6 | 223 | 85064 | 356.78 | 865 | 856 | 236.0 |
| D | 8 | 160 | 284266 | 1151.4 | 856 | 815 | 246.2 |
| D | 3 | 12 | 240120 | 972.08 | 856 | 815 | 246.2 |
| D | 6 | 239 | 118086 | 476.36 | 856 | 815 | 246.2 |
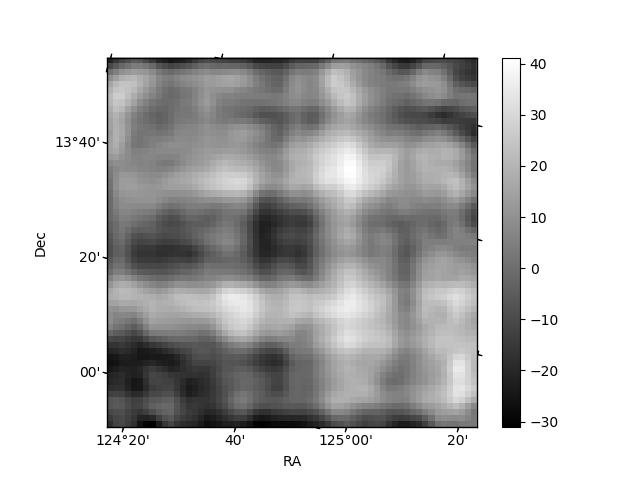
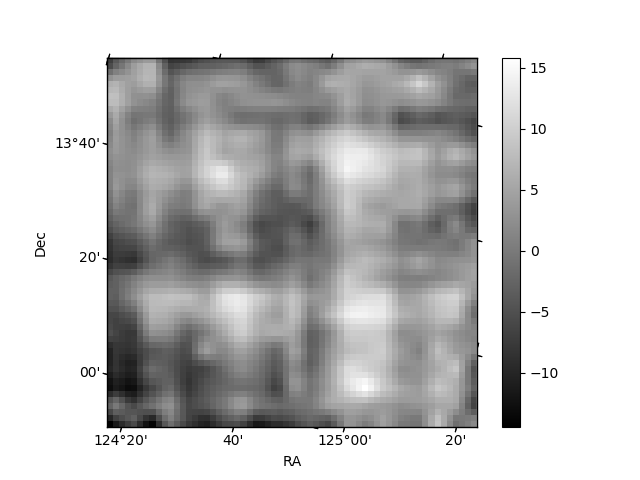
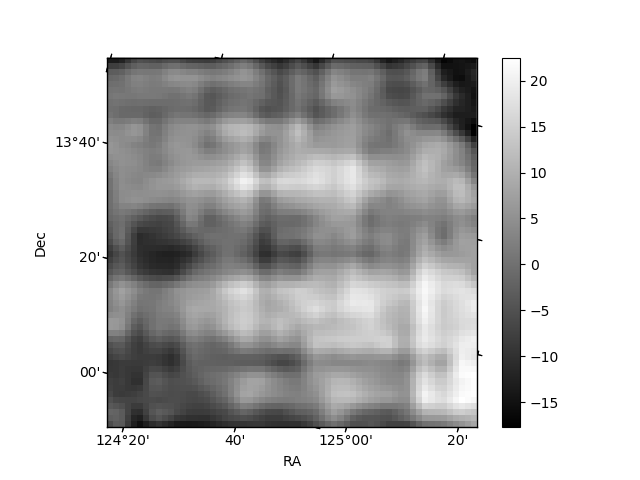
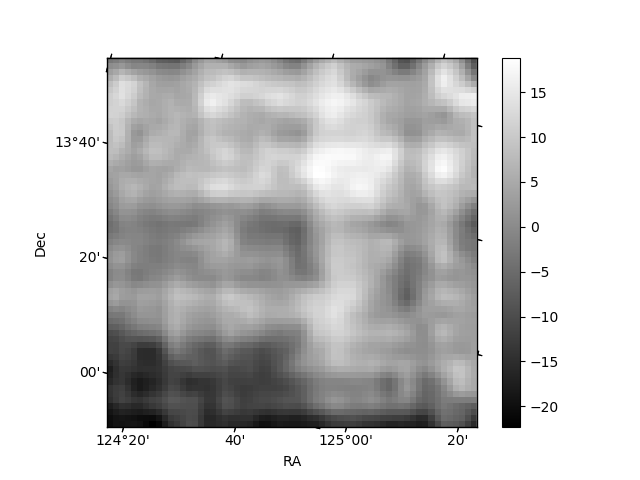
Histogram calculated using DETX and DETY for each event in the final _common_clean file
| Quadrant A | 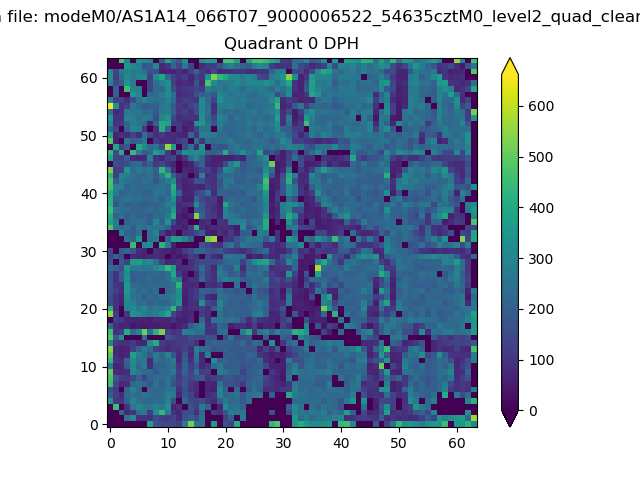 |
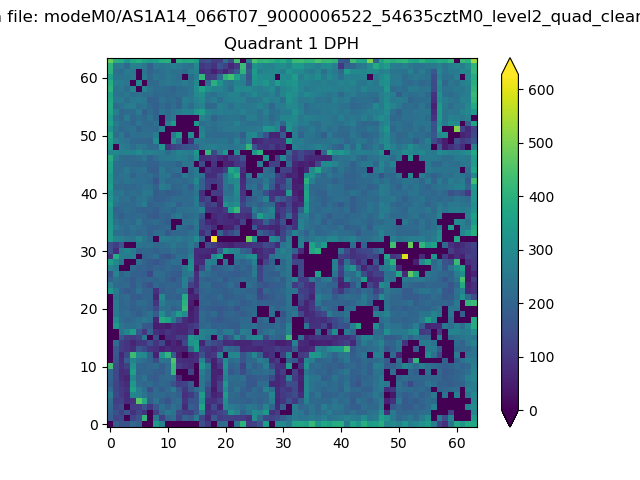 |
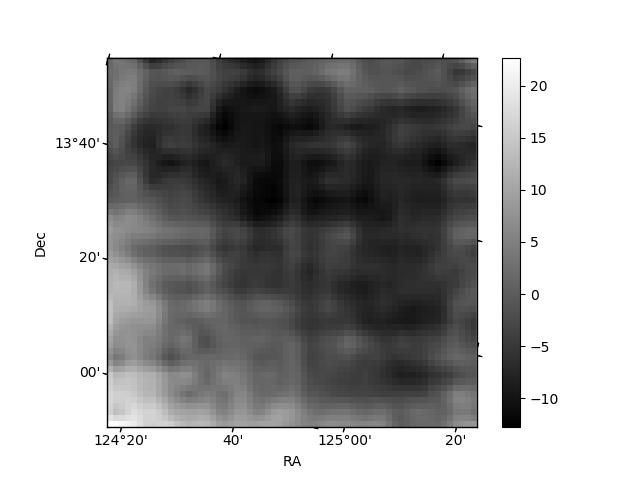
Quadrant B |
|---|---|---|---|
| Quadrant D | 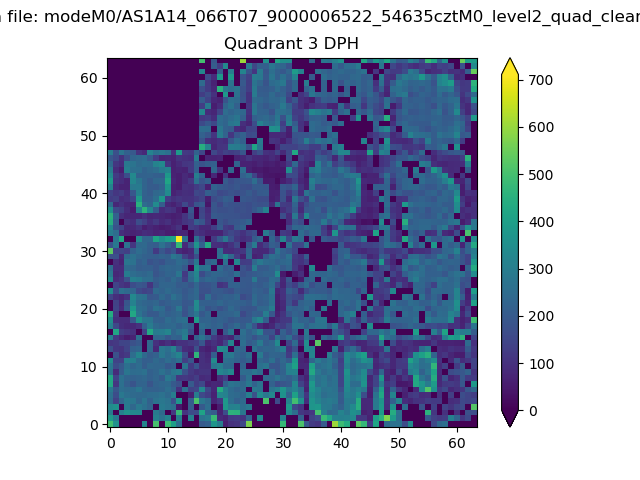 |
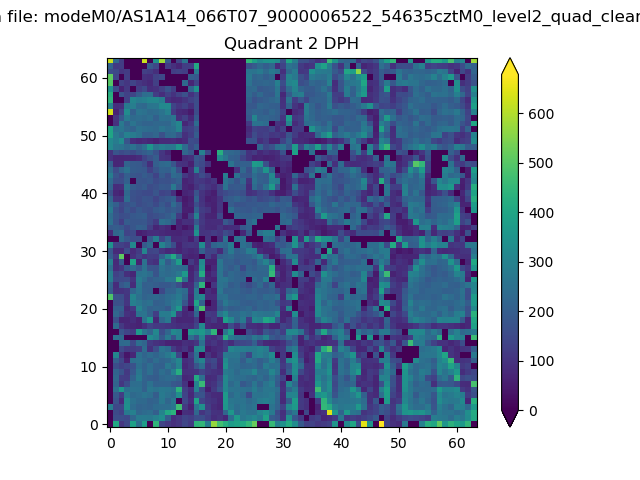 |
Quadrant C |
| Plot type | Count rate plots | Images |
|---|---|---|
| Comparison with Poisson distribution Blue bars denote a histogram of data divided into 1 sec bins. Red curve is a Poisson curve with rate = median count rate of data. |
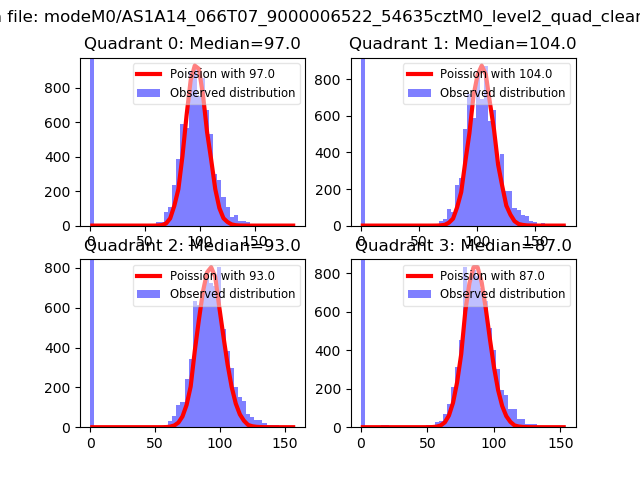 |
 |
| Quadrant-wise count rates Data is divided into 100 sec bins |
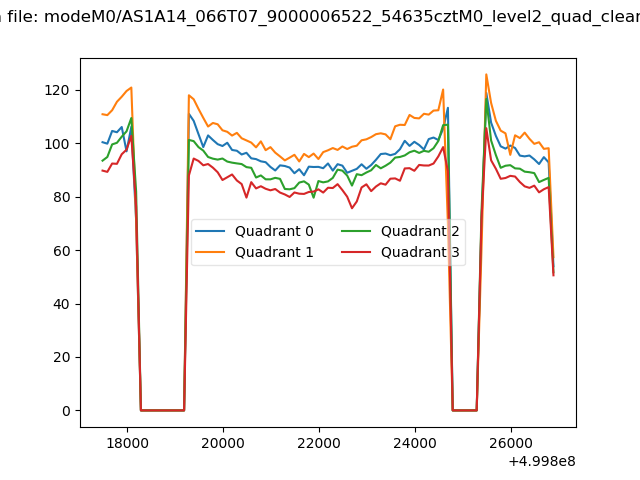 |
|
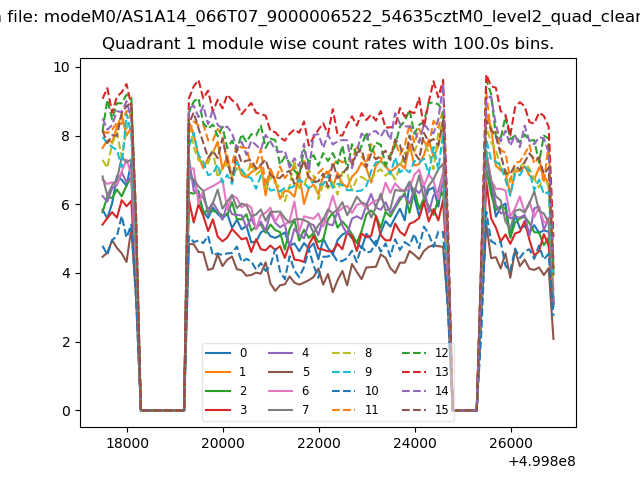
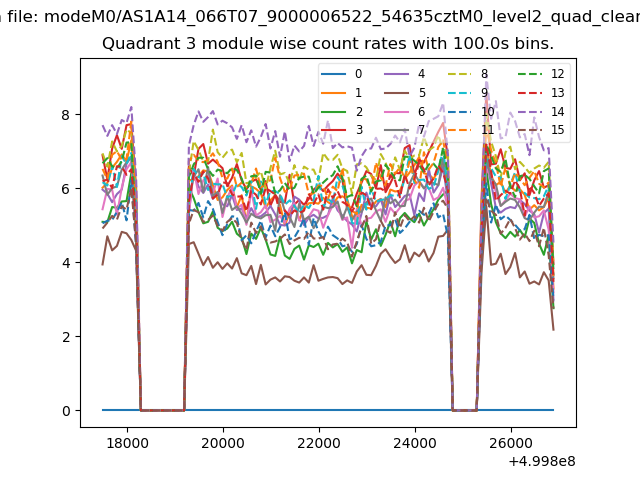
| Module-wise count rates for Quadrant A Data is divided into 100 sec bins |
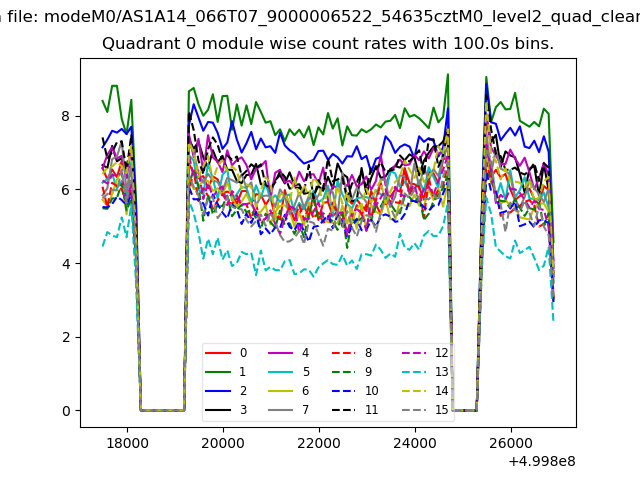 |
 |
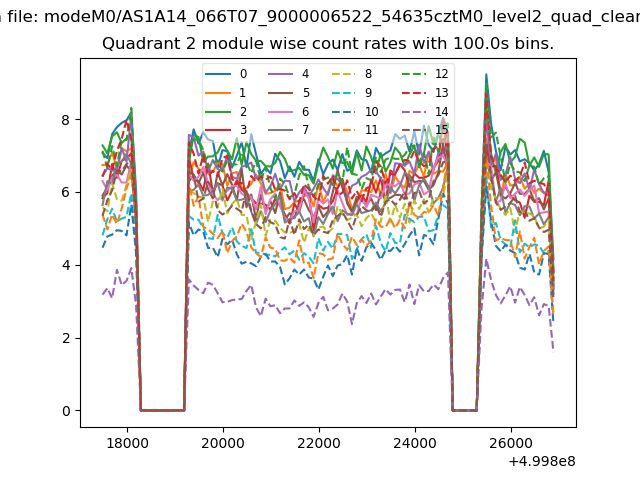
| Module-wise count rates for Quadrant B Data is divided into 100 sec bins |
 |
 |
| Module-wise count rates for Quadrant C Data is divided into 100 sec bins |
 |
 |
| Module-wise count rates for Quadrant D Data is divided into 100 sec bins |
 |
 |
| Parameter | Plot |
|---|---|
| CZT HV Monitor | 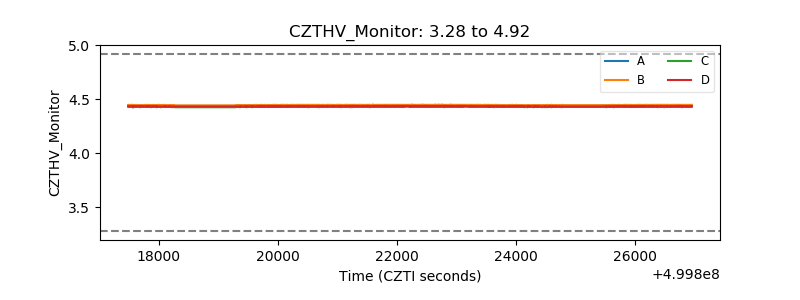 |
| D_VDD | 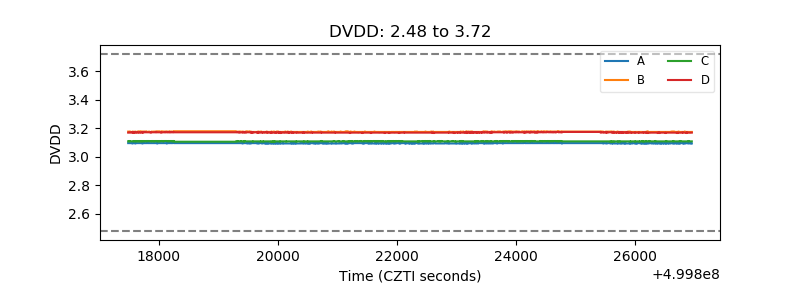 |
| Temperature 1 | 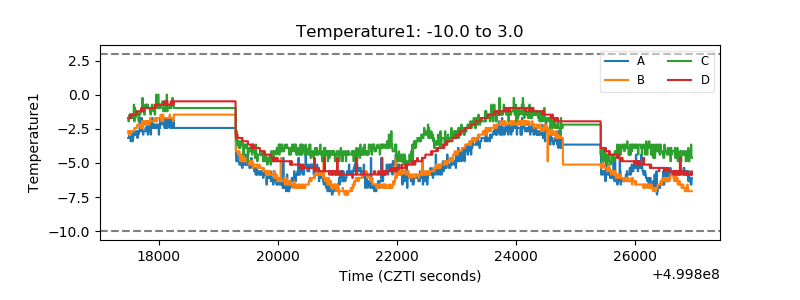 |
| Veto HV Monitor | 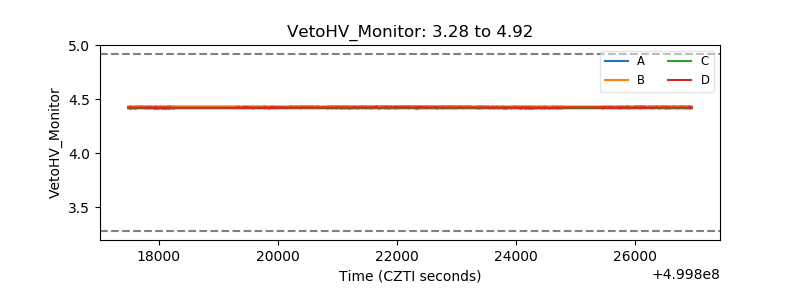 |
| Veto LLD | 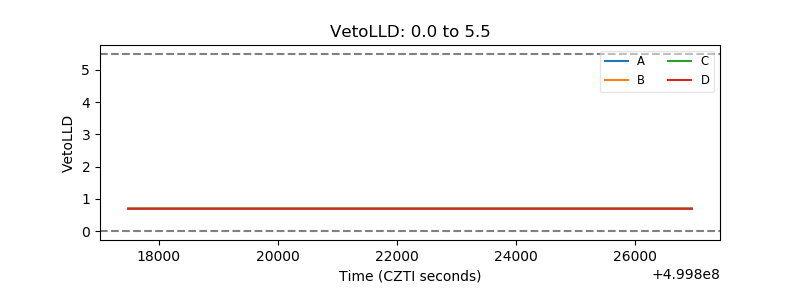 |
| Alpha Counter | 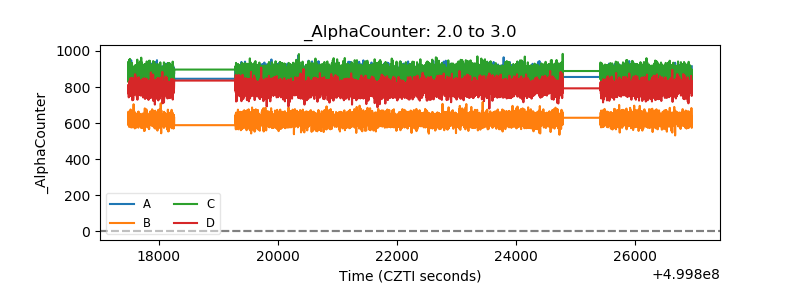 |
| _CPM_Rate | 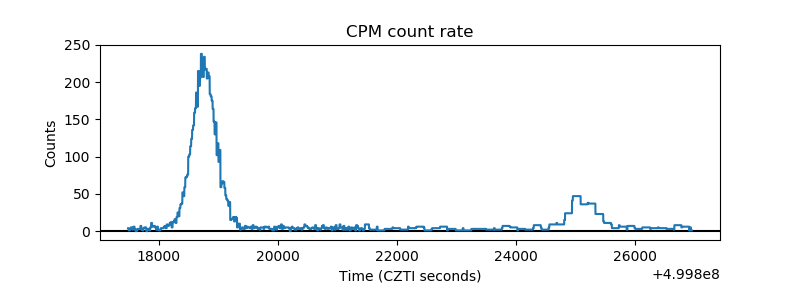 |
| CZT Counter | 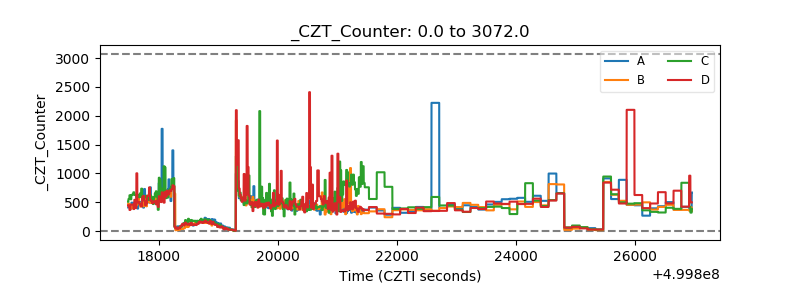 |
| +2.5 Volts monitor | 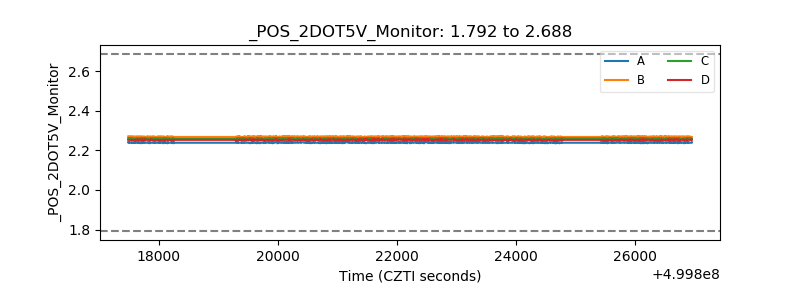 |
| +5 Volts monitor | 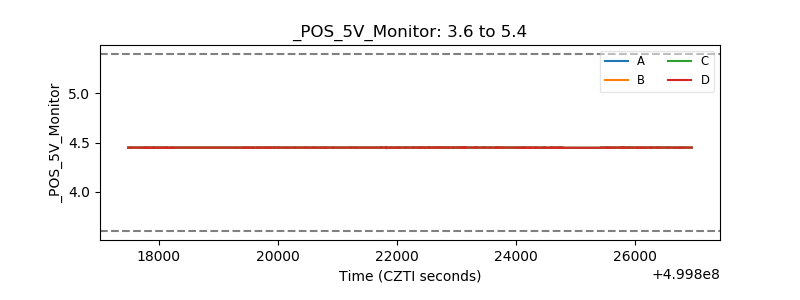 |
| _ROLL_ROT | 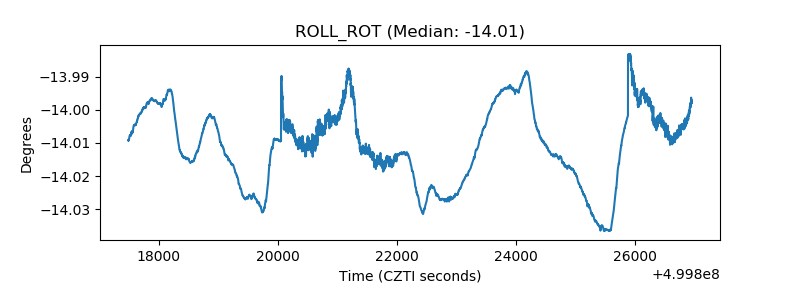 |
| _Roll_DEC | 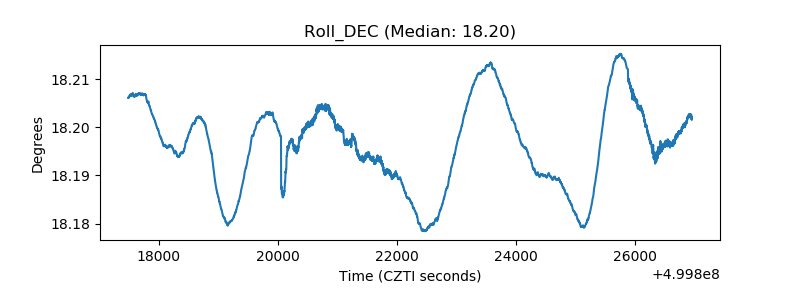 |
| _Roll_RA | 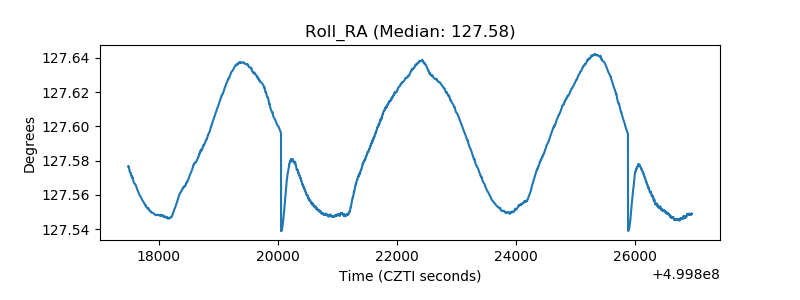 |
| Veto Counter | 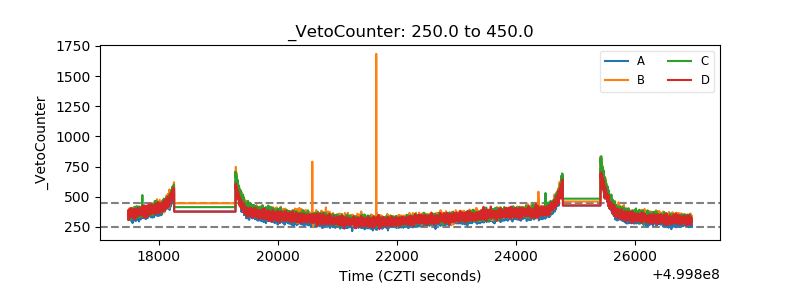 |