| Param | Original file | Final file |
|---|---|---|
| Filename | modeM0/AS1A14_066T07_9000006522_54636cztM0_level2.fits | modeM0/AS1A14_066T07_9000006522_54636cztM0_level2_quad_clean.evt |
| Size (bytes) | 568,509,120 | 125,951,040 |
| Size | 542.2 MB | 120.1 MB |
| Events in quadrant A | 5,330,396 | 820,344 |
| Events in quadrant B | 4,130,073 | 885,010 |
| Events in quadrant C | 5,305,745 | 765,036 |
| Events in quadrant D | 5,604,666 | 741,385 |
| Mode M9 | |||
|---|---|---|---|
| Quadrant | BADHDUFLAG | Total packets | Discarded packets |
| A | 0 | 7 | 0 |
| B | 0 | 7 | 0 |
| C | 0 | 7 | 0 |
| D | 0 | 7 | 0 |
| Mode M0 | |||
|---|---|---|---|
| Quadrant | BADHDUFLAG | Total packets | Discarded packets |
| A | 0 | 22145 | 2 |
| B | 0 | 18811 | 2 |
| C | 0 | 22261 | 5 |
| D | 0 | 22755 | 2 |
| Mode SS | |||
|---|---|---|---|
| Quadrant | BADHDUFLAG | Total packets | Discarded packets |
| A | 0 | 174 | 0 |
| B | 0 | 174 | 0 |
| C | 0 | 174 | 0 |
| D | 0 | 174 | 0 |
| Quadrant | Total seconds | Saturated seconds | Saturation percentage |
|---|---|---|---|
| A | 8673 | 362 | 4.173873% |
| B | 8674 | 230 | 2.651602% |
| C | 8673 | 399 | 4.600484% |
| D | 8673 | 230 | 2.651908% |
Noise dominated data is calculated using 1-second bins in cleaned event files. If a bin has >2000 counts, and if more than 50% of those come from <1% of pixels, then it is considered to be noise-dominated and hence unusable.
| Quadrant | # 1 sec bins | Bins with >0 counts | Bins with >2000 counts | High rate bins dominated by noise | Noise dominated (total time) | Noise dominated (detector-on time) | Marked lightcurve |
|---|---|---|---|---|---|---|---|
| A | 9318 | 8675 | 221 | 221 | 2.37% | 2.55% | 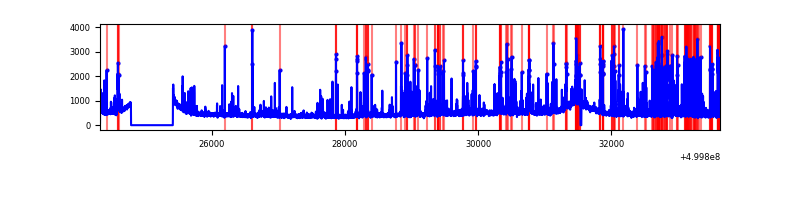 |
| B | 9319 | 8676 | 19 | 19 | 0.20% | 0.22% | 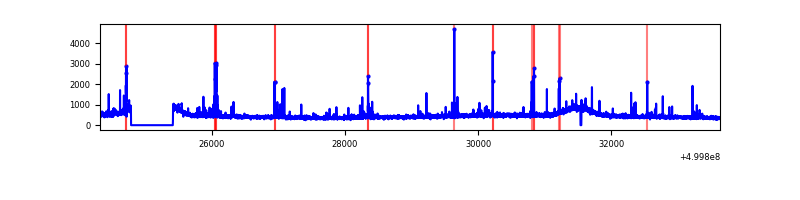 |
| C | 9318 | 8675 | 264 | 264 | 2.83% | 3.04% | 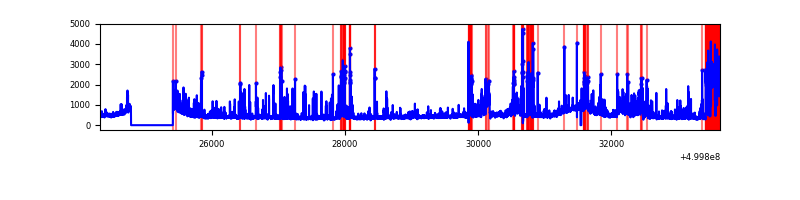 |
| D | 9318 | 8675 | 191 | 191 | 2.05% | 2.20% | 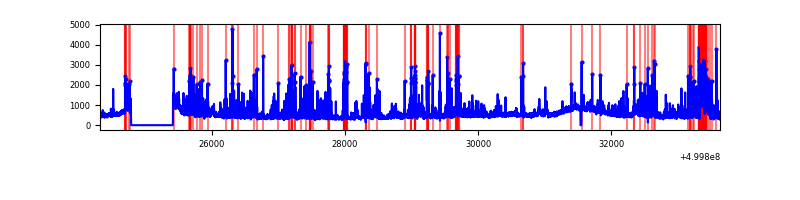 |
Top three noisy pixels from each quadrant. If the there are fewer than three noisy pixels in the level2.evt file, extra rows are filled as -1
| Pixel properties | Quadrant properties | ||||||
|---|---|---|---|---|---|---|---|
| Quadrant | DetID | PixID | Counts | Sigma | Mean | Median | Sigma |
| A | 7 | 190 | 818484 | 3426.35 | 976 | 951 | 238.6 |
| A | 11 | 3 | 333663 | 1394.42 | 976 | 951 | 238.6 |
| A | 3 | 62 | 114901 | 477.57 | 976 | 951 | 238.6 |
| B | 10 | 247 | 61705 | 284.33 | 980 | 942 | 213.7 |
| B | 0 | 151 | 38437 | 175.45 | 980 | 942 | 213.7 |
| B | 4 | 216 | 30539 | 138.5 | 980 | 942 | 213.7 |
| C | 9 | 38 | 644949 | 2474.91 | 951 | 947 | 260.2 |
| C | 13 | 3 | 350941 | 1345.04 | 951 | 947 | 260.2 |
| C | 6 | 223 | 191280 | 731.45 | 951 | 947 | 260.2 |
| D | 8 | 240 | 463488 | 1726.9 | 948 | 909 | 267.9 |
| D | 6 | 239 | 398844 | 1485.57 | 948 | 909 | 267.9 |
| D | 3 | 12 | 370770 | 1380.77 | 948 | 909 | 267.9 |
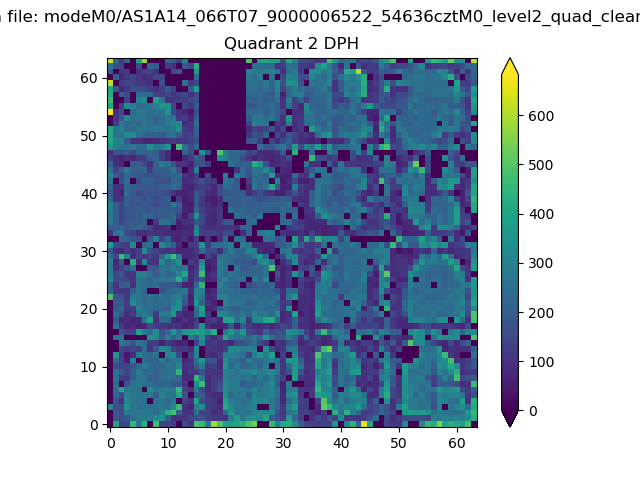
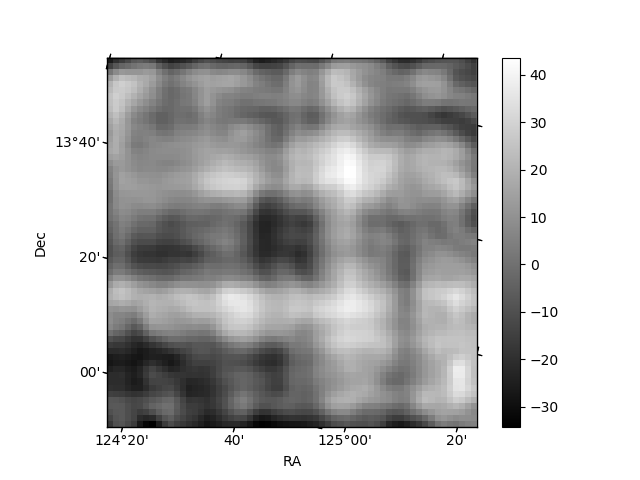
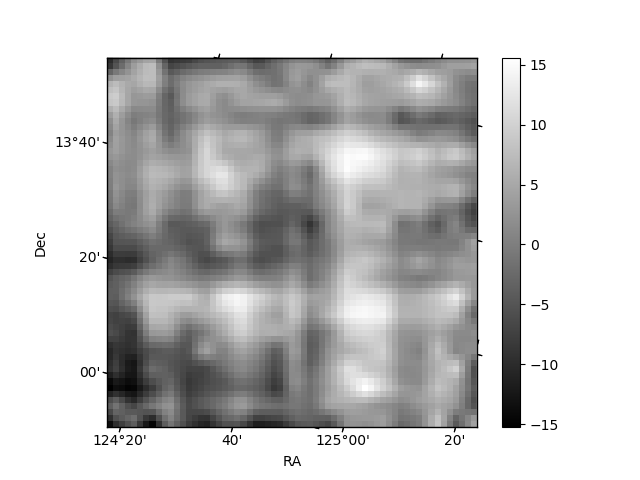
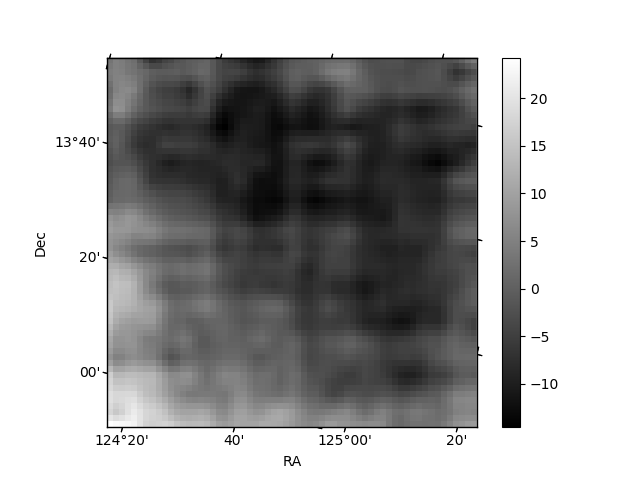
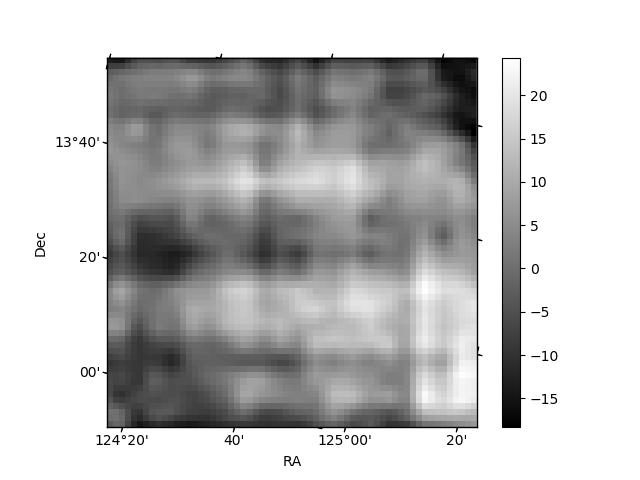
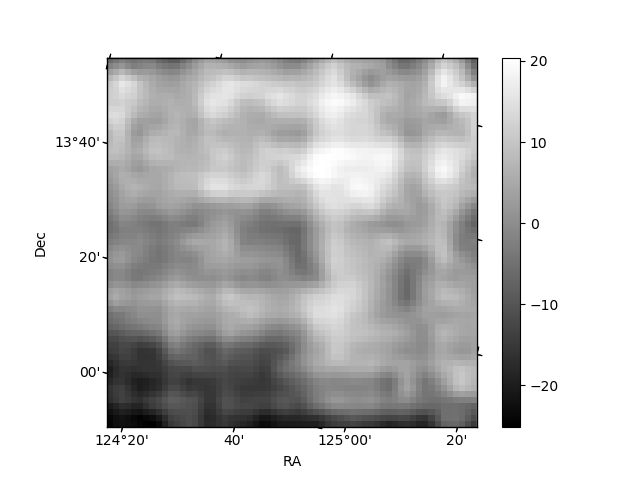
Histogram calculated using DETX and DETY for each event in the final _common_clean file
| Quadrant A | 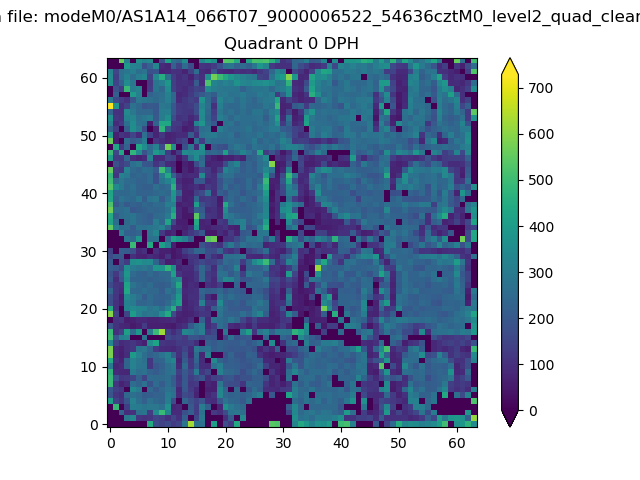 |
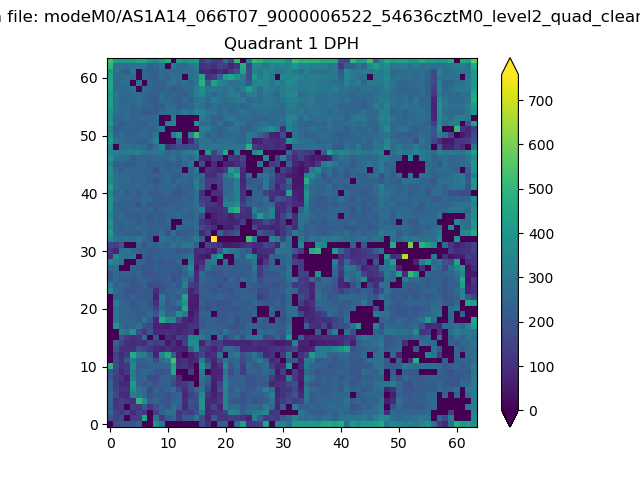 |
Quadrant B |
|---|---|---|---|
| Quadrant D | 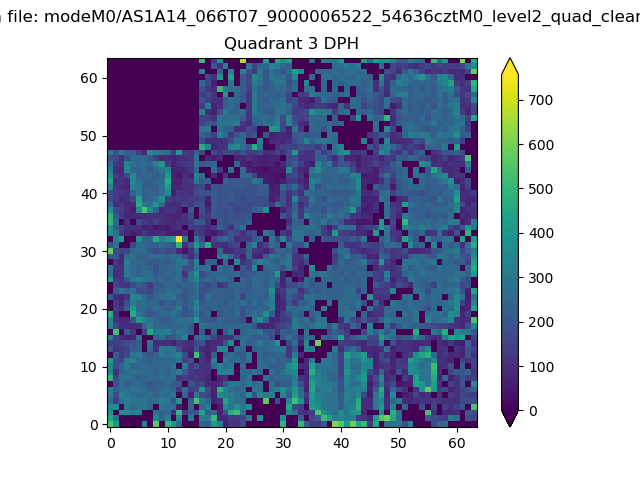 |
 |
Quadrant C |
| Plot type | Count rate plots | Images |
|---|---|---|
| Comparison with Poisson distribution Blue bars denote a histogram of data divided into 1 sec bins. Red curve is a Poisson curve with rate = median count rate of data. |
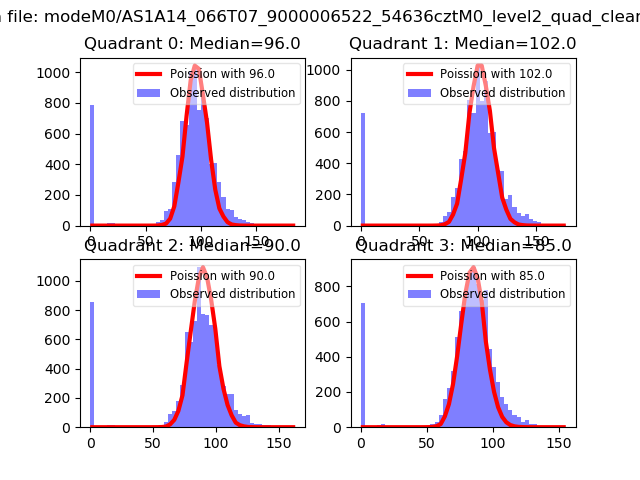 |
 |
| Quadrant-wise count rates Data is divided into 100 sec bins |
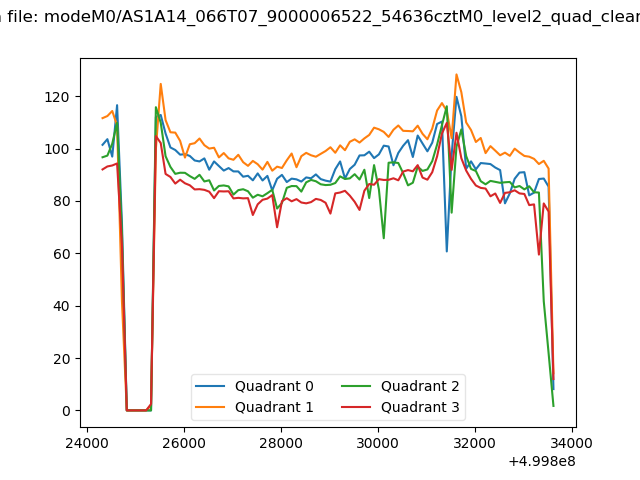 |
|
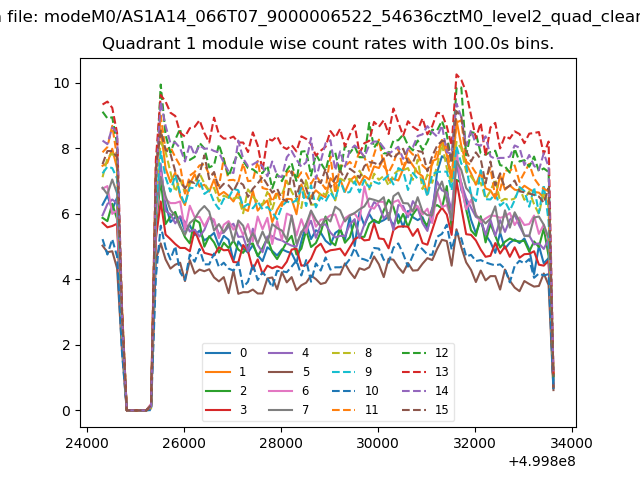
| Module-wise count rates for Quadrant A Data is divided into 100 sec bins |
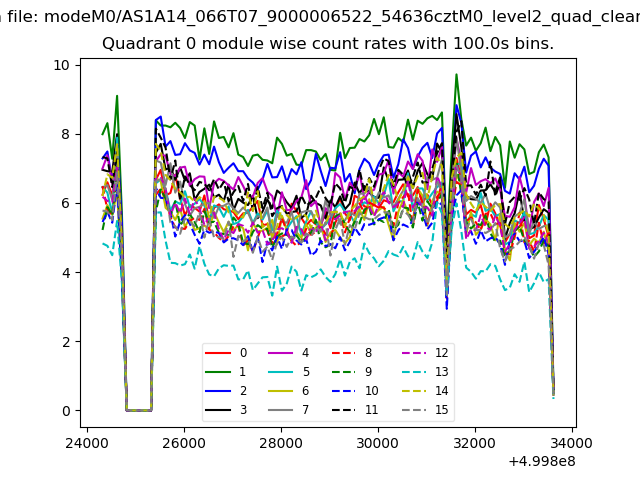 |
 |
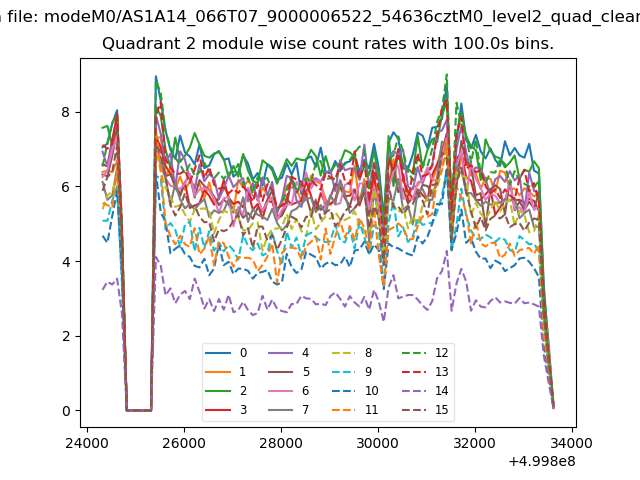
| Module-wise count rates for Quadrant B Data is divided into 100 sec bins |
 |
 |
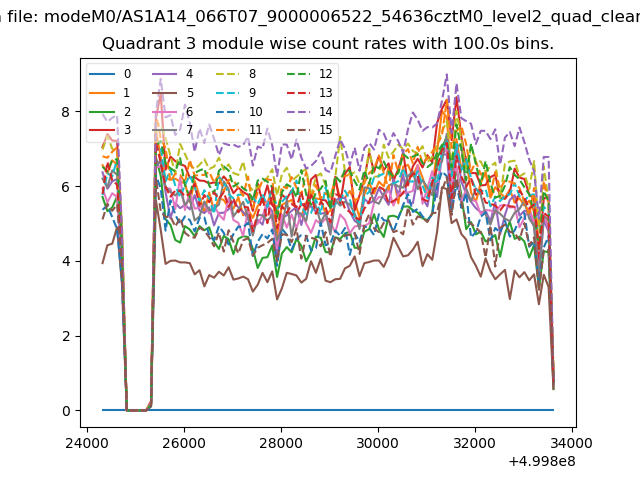
| Module-wise count rates for Quadrant C Data is divided into 100 sec bins |
 |
 |
| Module-wise count rates for Quadrant D Data is divided into 100 sec bins |
 |
 |
| Parameter | Plot |
|---|---|
| CZT HV Monitor | 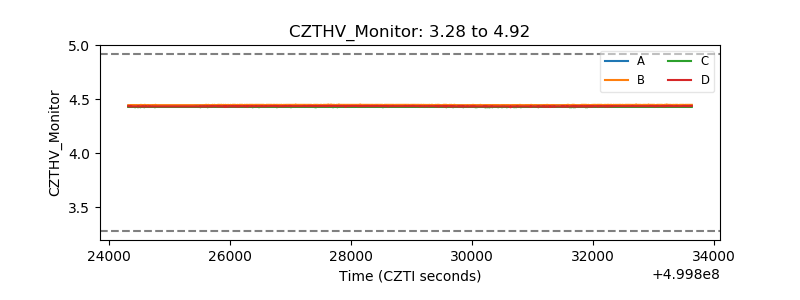 |
| D_VDD | 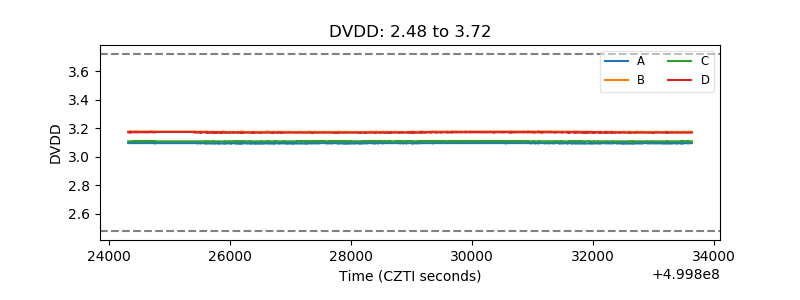 |
| Temperature 1 | 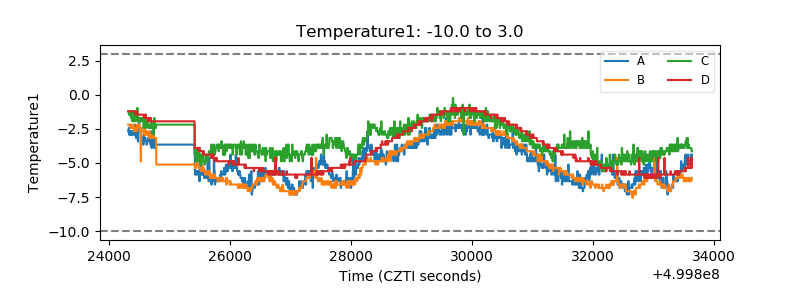 |
| Veto HV Monitor | 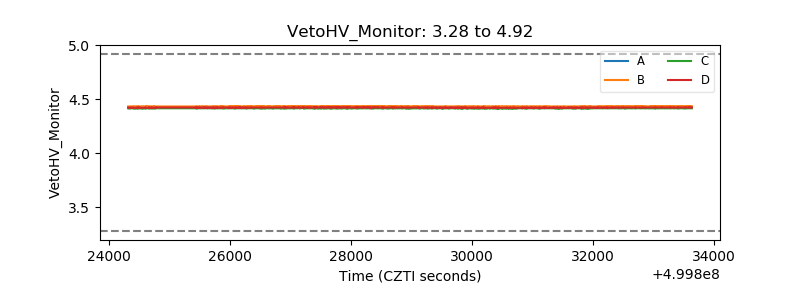 |
| Veto LLD | 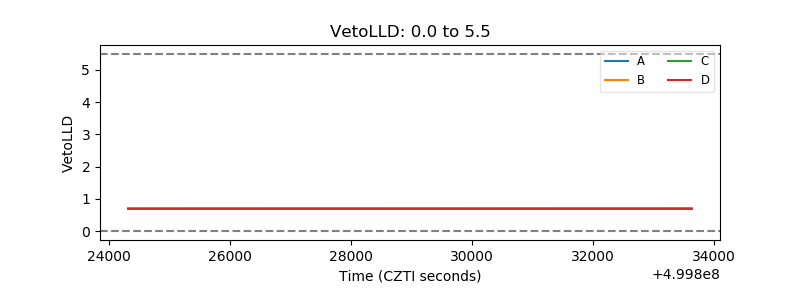 |
| Alpha Counter | 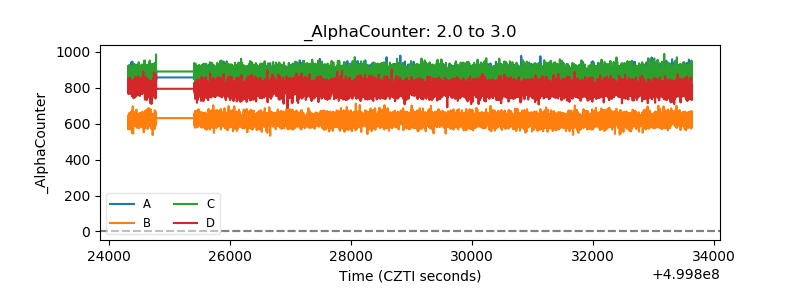 |
| _CPM_Rate | 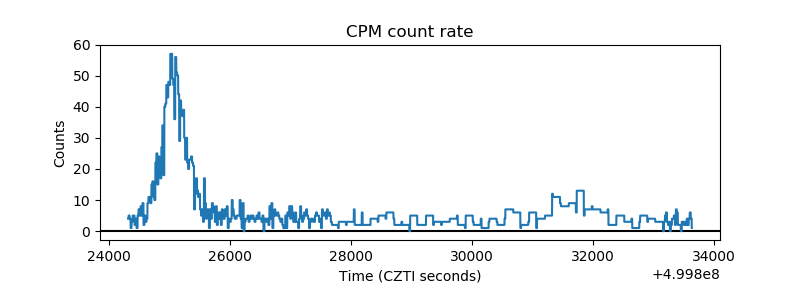 |
| CZT Counter | 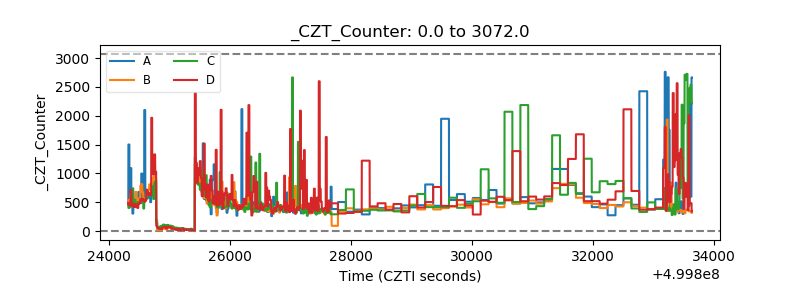 |
| +2.5 Volts monitor |  |
| +5 Volts monitor |  |
| _ROLL_ROT | 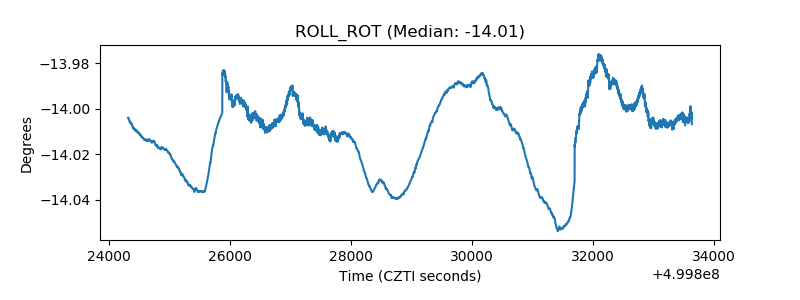 |
| _Roll_DEC | 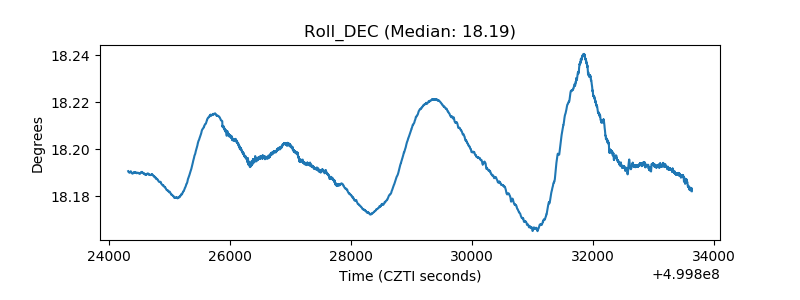 |
| _Roll_RA | 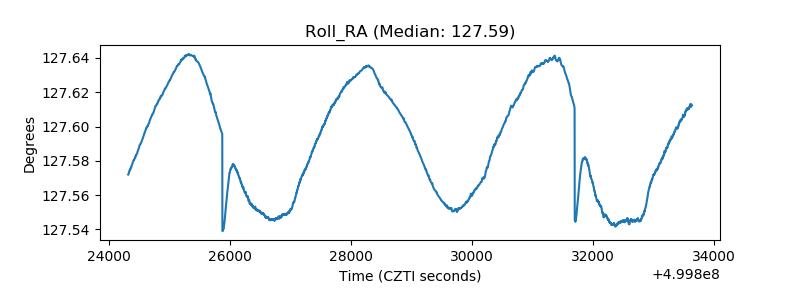 |
| Veto Counter | 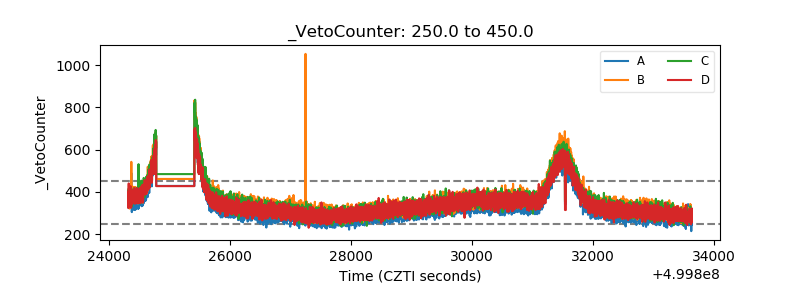 |