| Param | Original file | Final file |
|---|---|---|
| Filename | modeM0/AS1A14_066T07_9000006522_54637cztM0_level2.fits | modeM0/AS1A14_066T07_9000006522_54637cztM0_level2_quad_clean.evt |
| Size (bytes) | 746,173,440 | 110,937,600 |
| Size | 711.6 MB | 105.8 MB |
| Events in quadrant A | 7,440,038 | 683,678 |
| Events in quadrant B | 3,657,377 | 835,490 |
| Events in quadrant C | 10,194,554 | 588,422 |
| Events in quadrant D | 5,689,197 | 677,712 |
| Mode M0 | |||
|---|---|---|---|
| Quadrant | BADHDUFLAG | Total packets | Discarded packets |
| A | 0 | 28030 | 0 |
| B | 0 | 17180 | 0 |
| C | 0 | 36142 | 0 |
| D | 0 | 22676 | 0 |
| Mode SS | |||
|---|---|---|---|
| Quadrant | BADHDUFLAG | Total packets | Discarded packets |
| A | 0 | 164 | 0 |
| B | 0 | 164 | 0 |
| C | 0 | 164 | 0 |
| D | 0 | 164 | 0 |
| Quadrant | Total seconds | Saturated seconds | Saturation percentage |
|---|---|---|---|
| A | 8256 | 1227 | 14.861919% |
| B | 8256 | 43 | 0.520833% |
| C | 8256 | 1868 | 22.625969% |
| D | 8257 | 333 | 4.032942% |
Noise dominated data is calculated using 1-second bins in cleaned event files. If a bin has >2000 counts, and if more than 50% of those come from <1% of pixels, then it is considered to be noise-dominated and hence unusable.
| Quadrant | # 1 sec bins | Bins with >0 counts | Bins with >2000 counts | High rate bins dominated by noise | Noise dominated (total time) | Noise dominated (detector-on time) | Marked lightcurve |
|---|---|---|---|---|---|---|---|
| A | 8256 | 8256 | 944 | 944 | 11.43% | 11.43% | 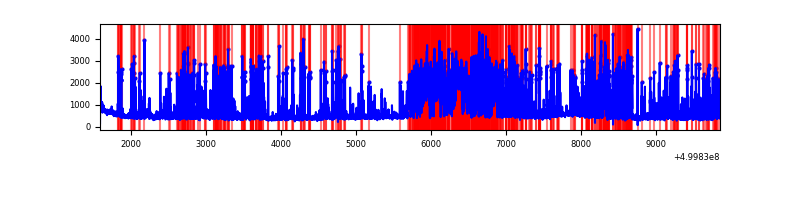 |
| B | 8256 | 8256 | 20 | 20 | 0.24% | 0.24% | 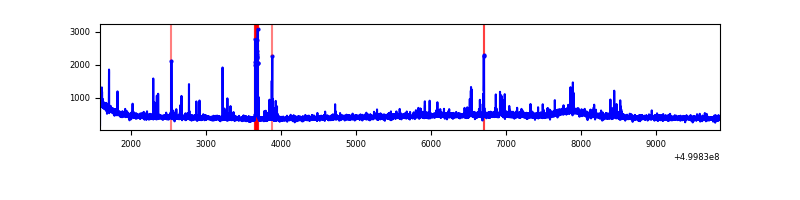 |
| C | 8256 | 8256 | 1710 | 1710 | 20.71% | 20.71% | 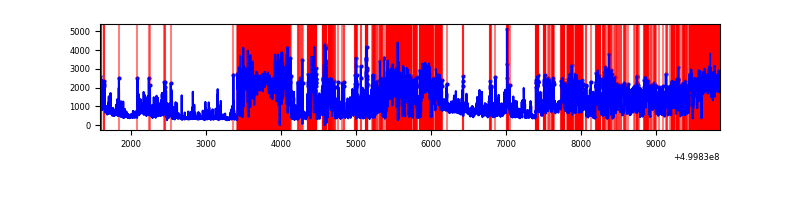 |
| D | 8257 | 8257 | 342 | 342 | 4.14% | 4.14% | 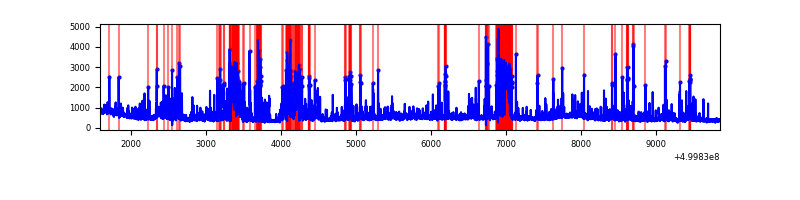 |
Top three noisy pixels from each quadrant. If the there are fewer than three noisy pixels in the level2.evt file, extra rows are filled as -1
| Pixel properties | Quadrant properties | ||||||
|---|---|---|---|---|---|---|---|
| Quadrant | DetID | PixID | Counts | Sigma | Mean | Median | Sigma |
| A | 7 | 190 | 3582023 | 17245.84 | 833 | 810 | 207.7 |
| A | 11 | 3 | 487018 | 2341.4 | 833 | 810 | 207.7 |
| A | 3 | 62 | 28866 | 135.11 | 833 | 810 | 207.7 |
| B | 10 | 247 | 129326 | 674.57 | 880 | 846 | 190.5 |
| B | 12 | 111 | 23195 | 117.34 | 880 | 846 | 190.5 |
| B | 11 | 111 | 21810 | 110.07 | 880 | 846 | 190.5 |
| C | 9 | 38 | 6530263 | 29830.12 | 790 | 781 | 218.9 |
| C | 6 | 223 | 223343 | 1016.78 | 790 | 781 | 218.9 |
| C | 13 | 3 | 97694 | 442.75 | 790 | 781 | 218.9 |
| D | 3 | 12 | 643963 | 2697.13 | 842 | 809 | 238.5 |
| D | 8 | 160 | 402932 | 1686.34 | 842 | 809 | 238.5 |
| D | 8 | 240 | 395889 | 1656.81 | 842 | 809 | 238.5 |
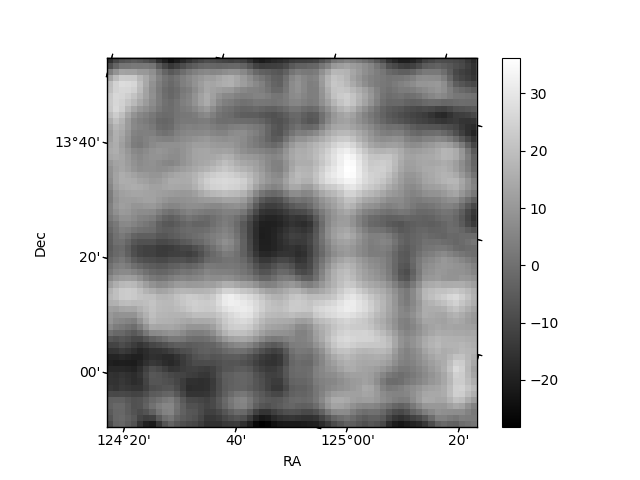
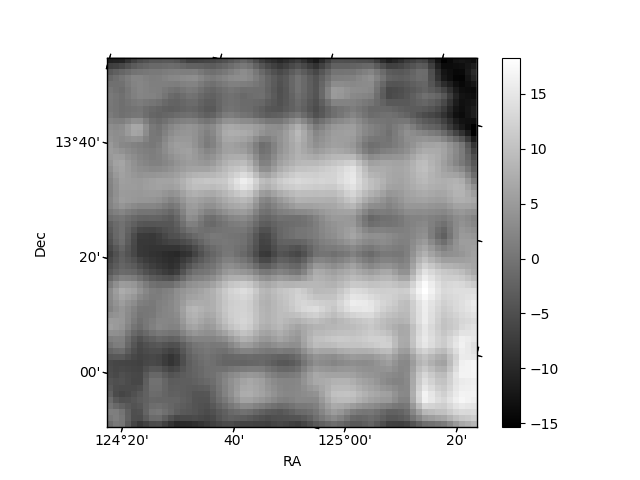
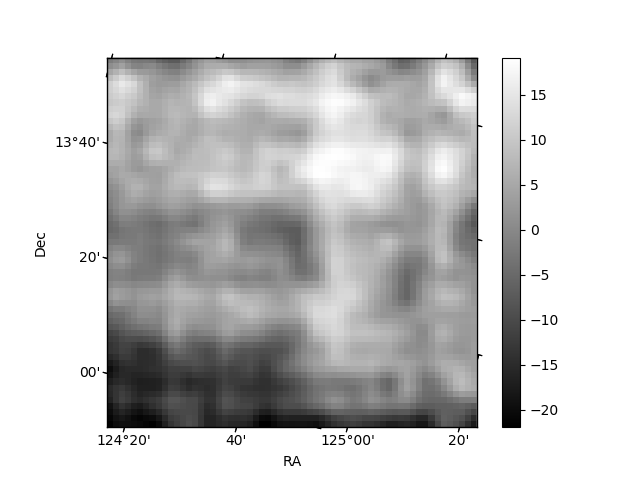
Histogram calculated using DETX and DETY for each event in the final _common_clean file
| Quadrant A | 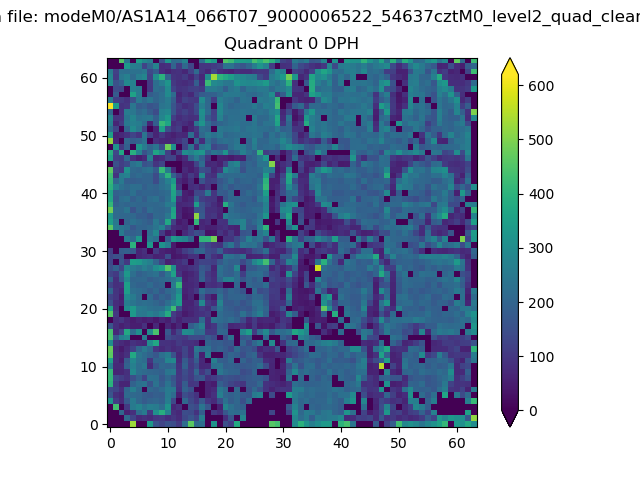 |
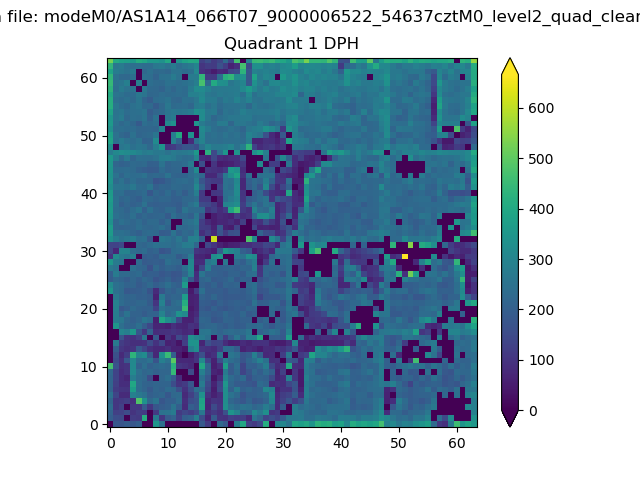 |
Quadrant B |
|---|---|---|---|
| Quadrant D | 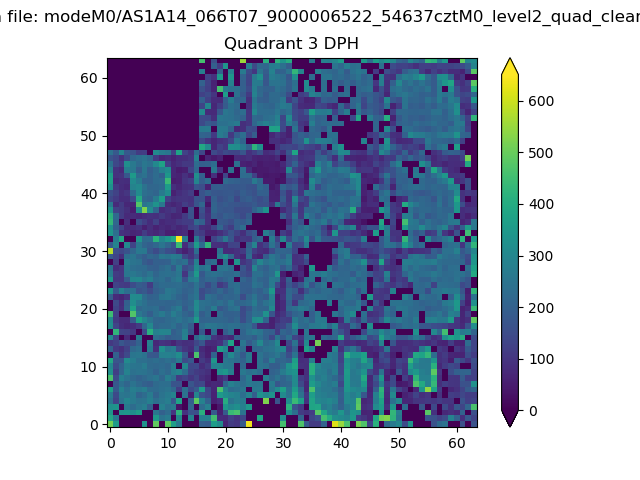 |
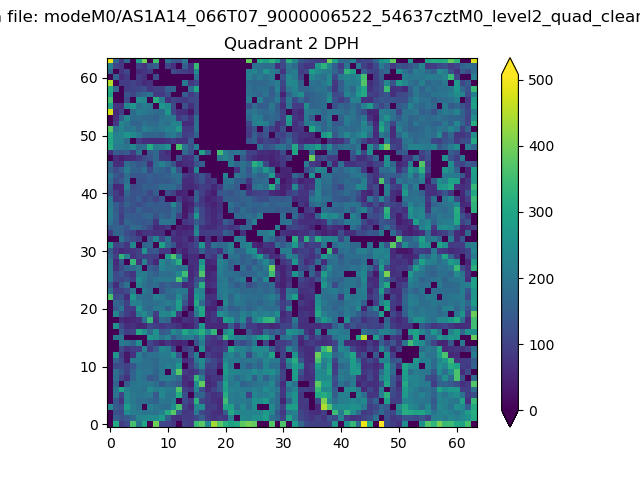 |
Quadrant C |
| Plot type | Count rate plots | Images |
|---|---|---|
| Comparison with Poisson distribution Blue bars denote a histogram of data divided into 1 sec bins. Red curve is a Poisson curve with rate = median count rate of data. |
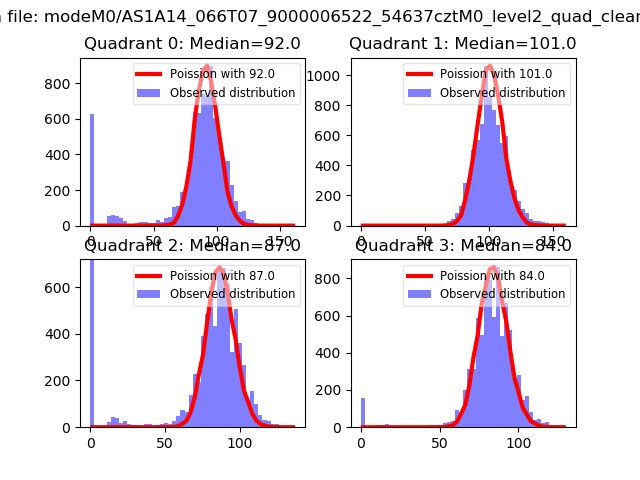 |
 |
| Quadrant-wise count rates Data is divided into 100 sec bins |
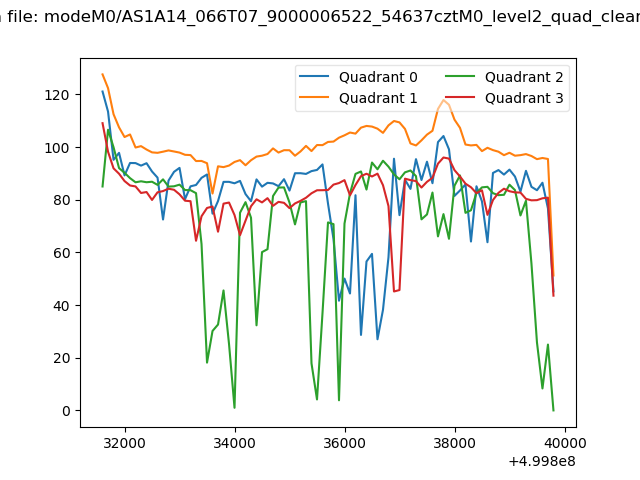 |
|
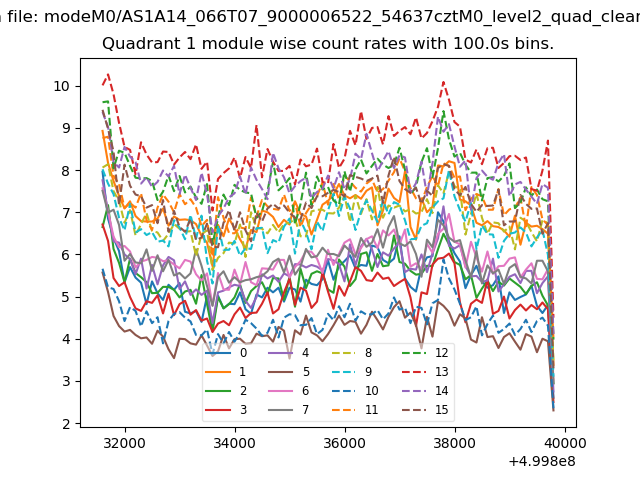
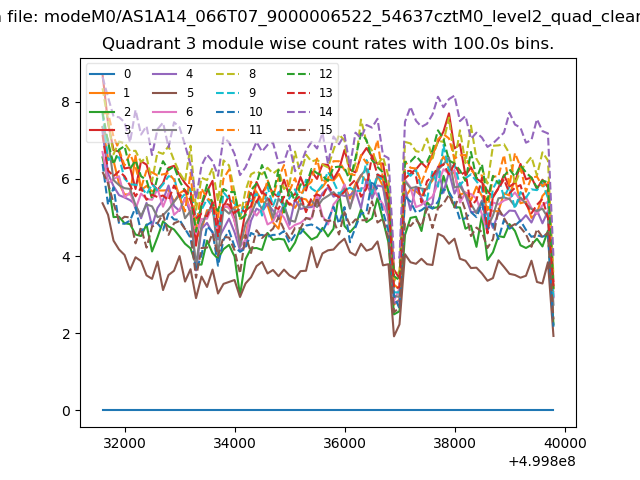
| Module-wise count rates for Quadrant A Data is divided into 100 sec bins |
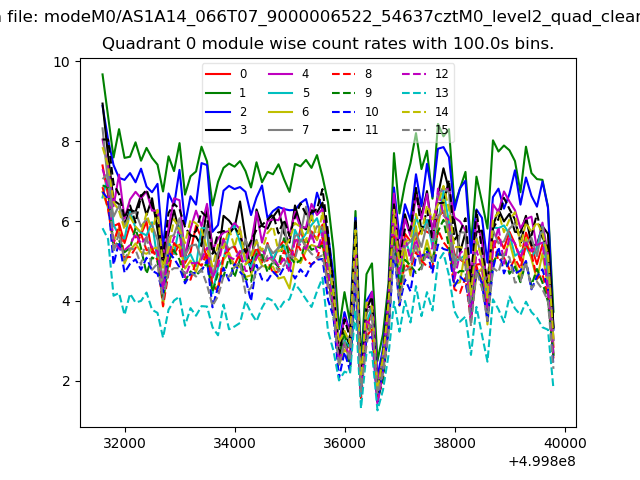 |
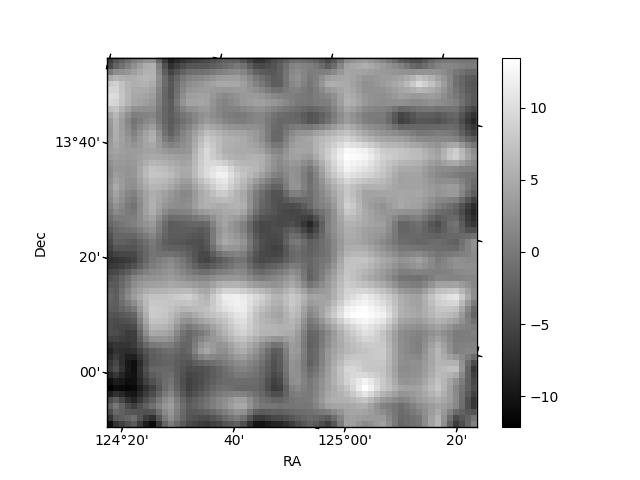 |
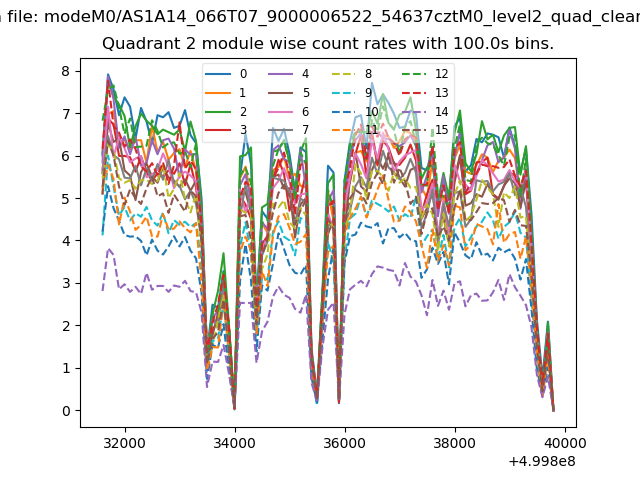
| Module-wise count rates for Quadrant B Data is divided into 100 sec bins |
 |
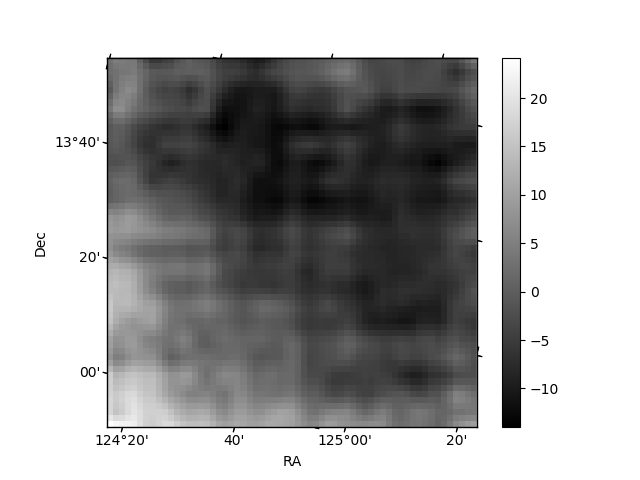 |
| Module-wise count rates for Quadrant C Data is divided into 100 sec bins |
 |
 |
| Module-wise count rates for Quadrant D Data is divided into 100 sec bins |
 |
 |
| Parameter | Plot |
|---|---|
| CZT HV Monitor | 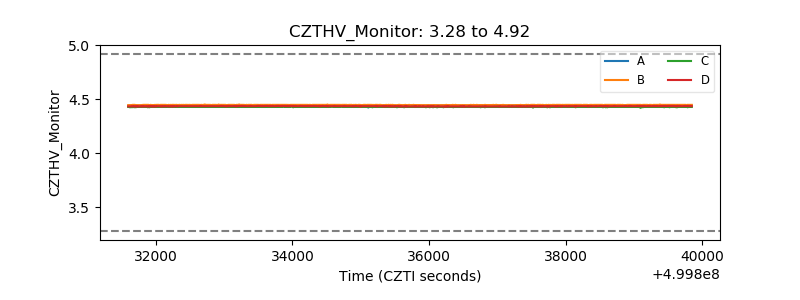 |
| D_VDD | 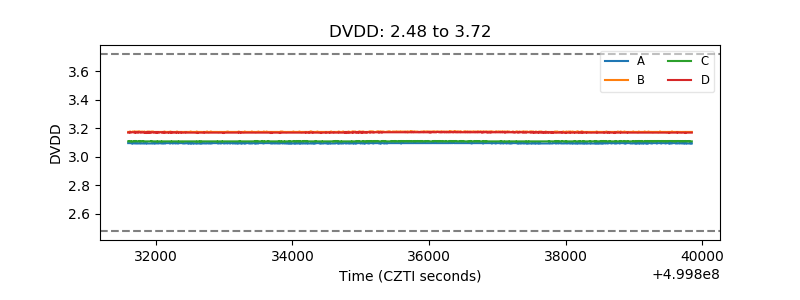 |
| Temperature 1 | 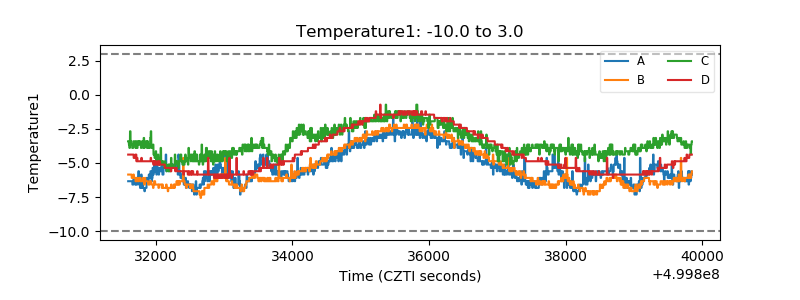 |
| Veto HV Monitor | 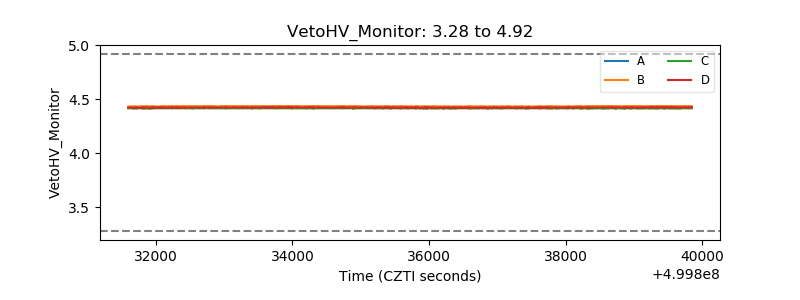 |
| Veto LLD | 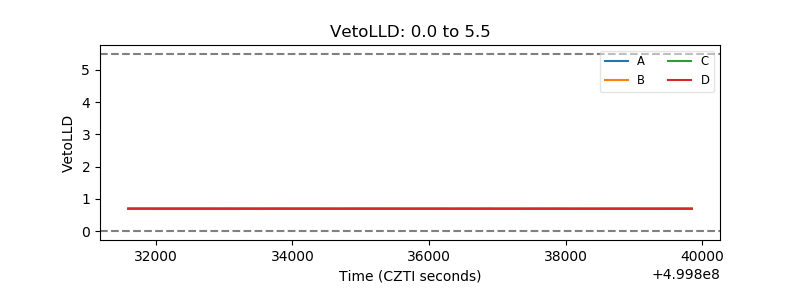 |
| Alpha Counter | 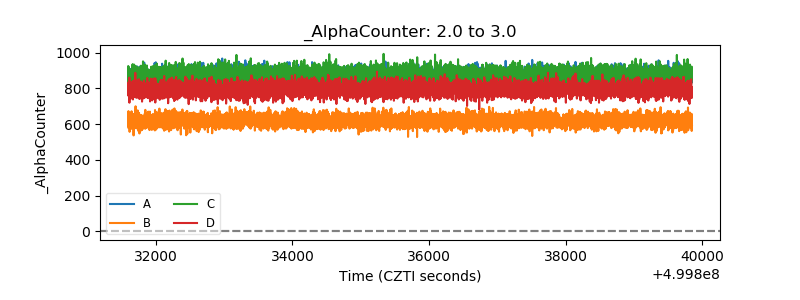 |
| _CPM_Rate | 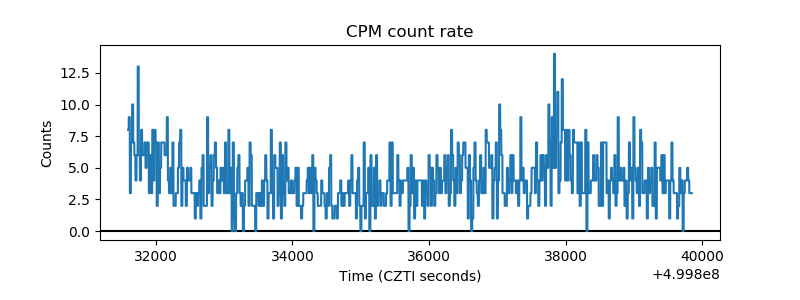 |
| CZT Counter | 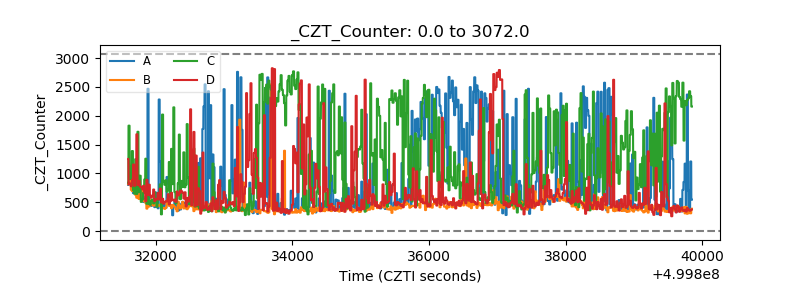 |
| +2.5 Volts monitor |  |
| +5 Volts monitor |  |
| _ROLL_ROT | 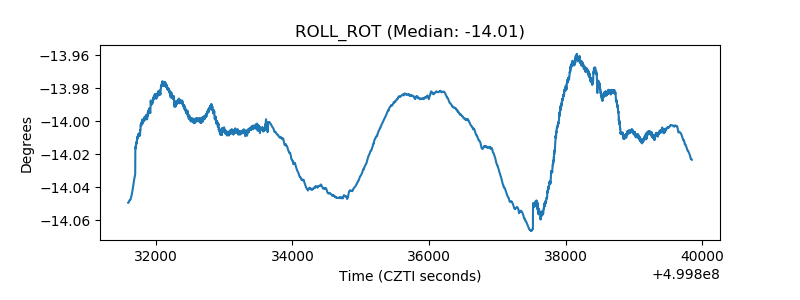 |
| _Roll_DEC | 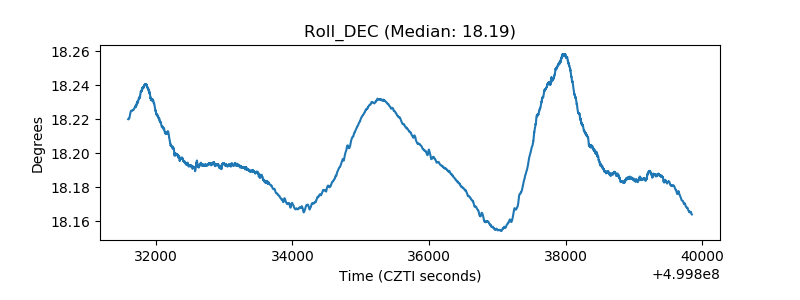 |
| _Roll_RA | 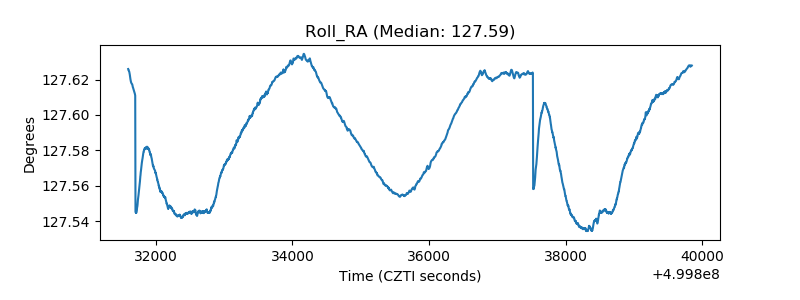 |
| Veto Counter | 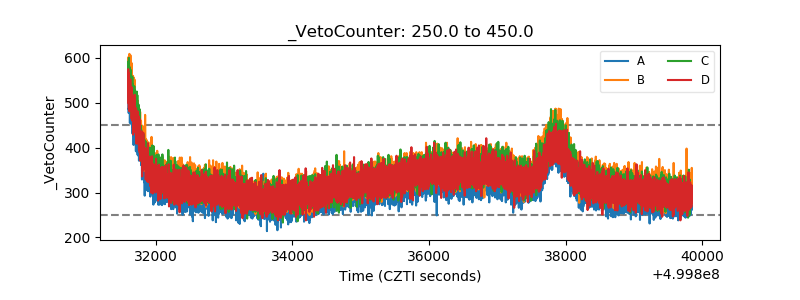 |