| Param | Original file | Final file |
|---|---|---|
| Filename | modeM0/AS1A14_066T07_9000006522_54641cztM0_level2.fits | modeM0/AS1A14_066T07_9000006522_54641cztM0_level2_quad_clean.evt |
| Size (bytes) | 2,102,209,920 | 346,619,520 |
| Size | 2.0 GB | 330.6 MB |
| Events in quadrant A | 20,215,940 | 2,148,080 |
| Events in quadrant B | 11,253,222 | 2,549,327 |
| Events in quadrant C | 27,901,160 | 1,968,214 |
| Events in quadrant D | 16,475,736 | 2,072,744 |
| Mode M9 | |||
|---|---|---|---|
| Quadrant | BADHDUFLAG | Total packets | Discarded packets |
| A | 0 | 9 | 0 |
| B | 0 | 9 | 0 |
| C | 0 | 9 | 0 |
| D | 0 | 9 | 0 |
| Mode M0 | |||
|---|---|---|---|
| Quadrant | BADHDUFLAG | Total packets | Discarded packets |
| A | 0 | 78173 | 2 |
| B | 0 | 52609 | 2 |
| C | 0 | 100598 | 3 |
| D | 0 | 66912 | 2 |
| Mode SS | |||
|---|---|---|---|
| Quadrant | BADHDUFLAG | Total packets | Discarded packets |
| A | 0 | 514 | 0 |
| B | 0 | 516 | 0 |
| C | 0 | 516 | 0 |
| D | 0 | 516 | 0 |
| Quadrant | Total seconds | Saturated seconds | Saturation percentage |
|---|---|---|---|
| A | 25513 | 3306 | 12.958100% |
| B | 25514 | 367 | 1.438426% |
| C | 25513 | 4021 | 15.760593% |
| D | 25513 | 1144 | 4.483989% |
Noise dominated data is calculated using 1-second bins in cleaned event files. If a bin has >2000 counts, and if more than 50% of those come from <1% of pixels, then it is considered to be noise-dominated and hence unusable.
| Quadrant | # 1 sec bins | Bins with >0 counts | Bins with >2000 counts | High rate bins dominated by noise | Noise dominated (total time) | Noise dominated (detector-on time) | Marked lightcurve |
|---|---|---|---|---|---|---|---|
| A | 26438 | 25515 | 2247 | 2247 | 8.50% | 8.81% | 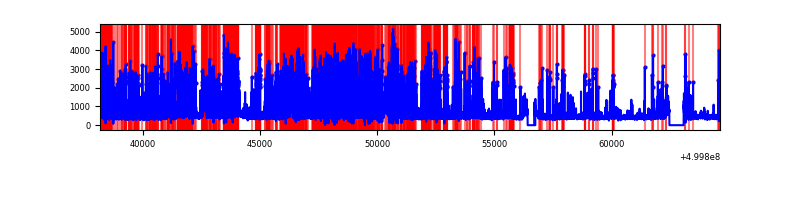 |
| B | 26438 | 25516 | 16 | 16 | 0.06% | 0.06% | 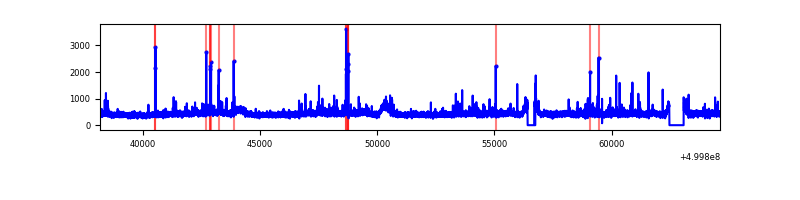 |
| C | 26437 | 25515 | 3146 | 3146 | 11.90% | 12.33% | 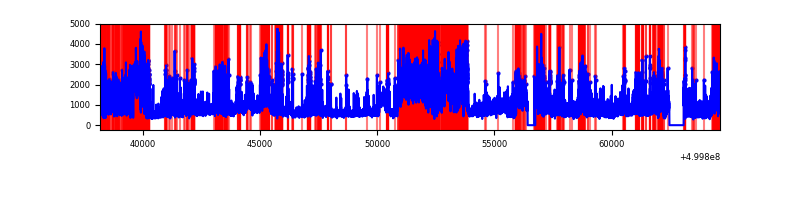 |
| D | 26438 | 25516 | 804 | 804 | 3.04% | 3.15% | 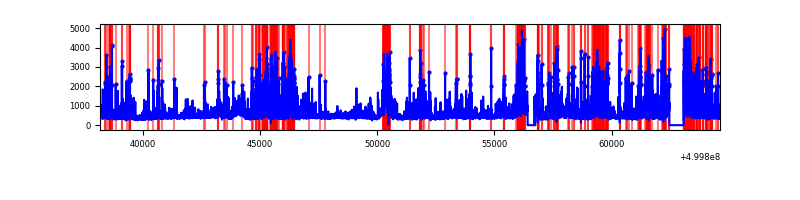 |
Top three noisy pixels from each quadrant. If the there are fewer than three noisy pixels in the level2.evt file, extra rows are filled as -1
| Pixel properties | Quadrant properties | ||||||
|---|---|---|---|---|---|---|---|
| Quadrant | DetID | PixID | Counts | Sigma | Mean | Median | Sigma |
| A | 7 | 190 | 8103534 | 12545.78 | 2633 | 2571 | 645.7 |
| A | 11 | 3 | 875319 | 1351.6 | 2633 | 2571 | 645.7 |
| A | 3 | 62 | 202211 | 309.18 | 2633 | 2571 | 645.7 |
| B | 10 | 247 | 81199 | 133.74 | 2736 | 2629 | 587.5 |
| B | 7 | 252 | 76690 | 126.06 | 2736 | 2629 | 587.5 |
| B | 12 | 111 | 73365 | 120.4 | 2736 | 2629 | 587.5 |
| C | 9 | 38 | 13941529 | 20317.11 | 2540 | 2526 | 686.1 |
| C | 15 | 147 | 956534 | 1390.54 | 2540 | 2526 | 686.1 |
| C | 13 | 3 | 572205 | 830.35 | 2540 | 2526 | 686.1 |
| D | 8 | 160 | 2684841 | 3548.37 | 2650 | 2534 | 755.9 |
| D | 2 | 249 | 1043859 | 1377.55 | 2650 | 2534 | 755.9 |
| D | 6 | 239 | 1009756 | 1332.43 | 2650 | 2534 | 755.9 |
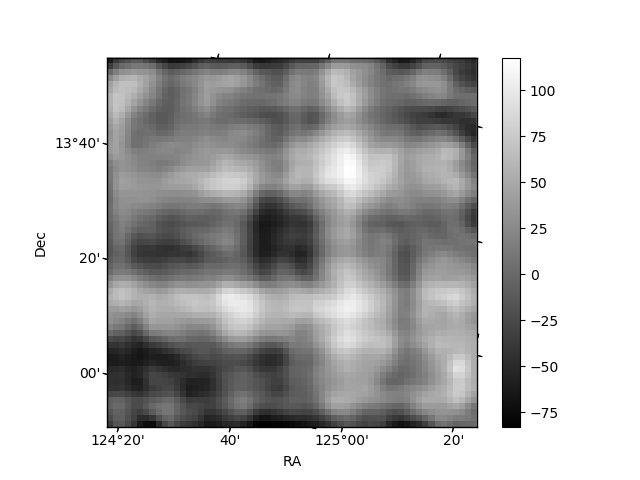
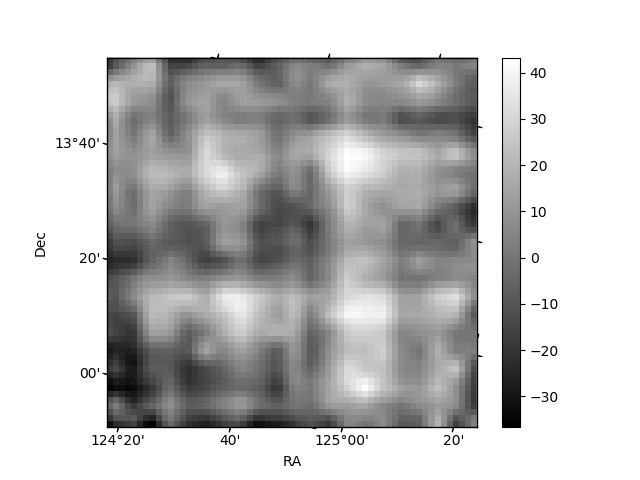
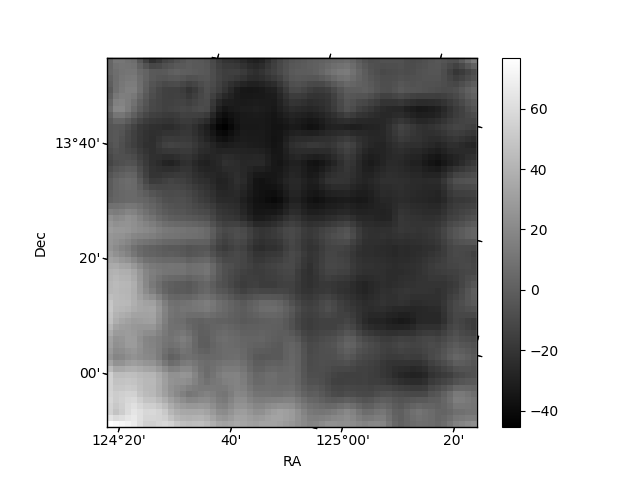
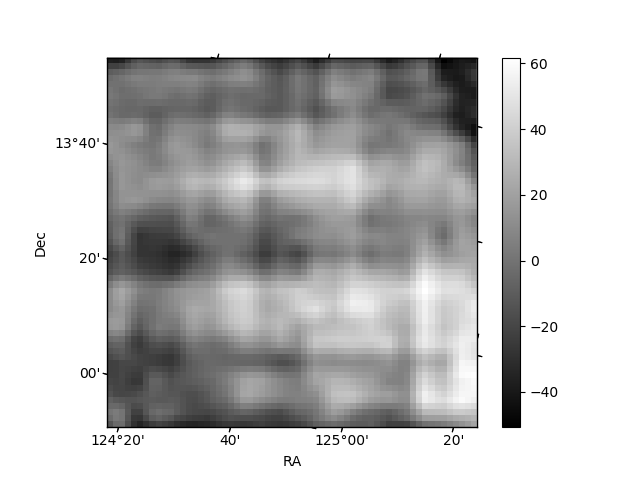
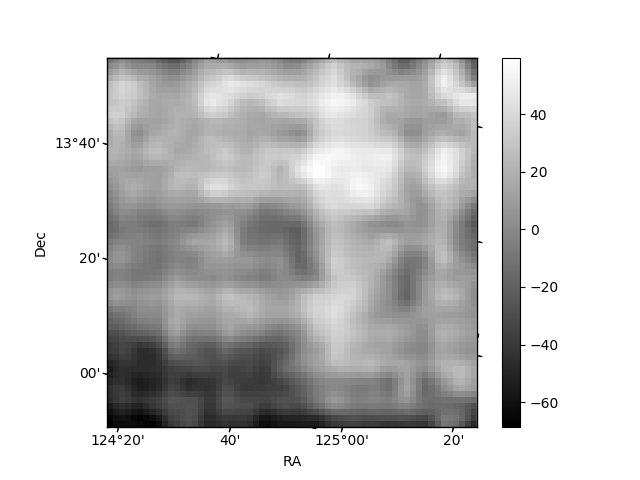
Histogram calculated using DETX and DETY for each event in the final _common_clean file
| Quadrant A | 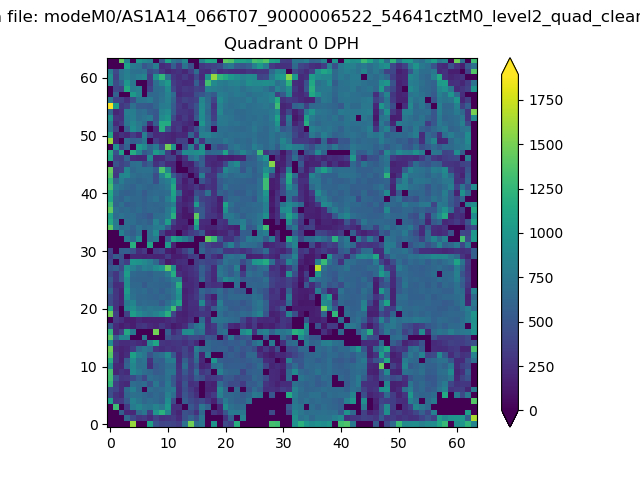 |
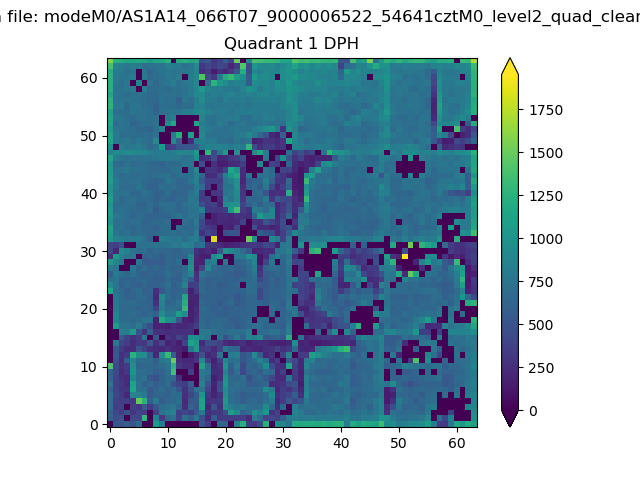 |
Quadrant B |
|---|---|---|---|
| Quadrant D | 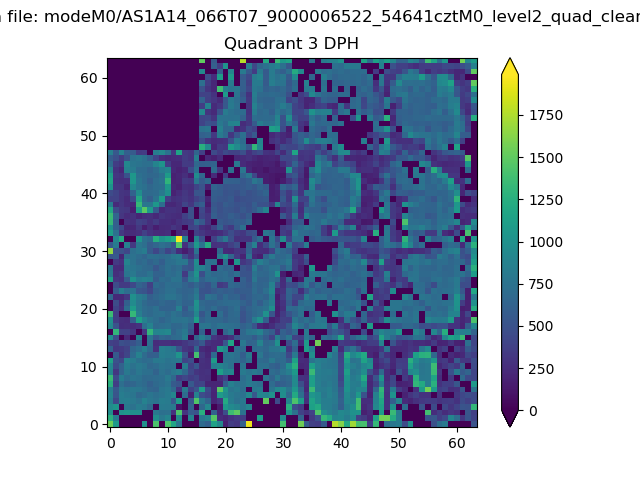 |
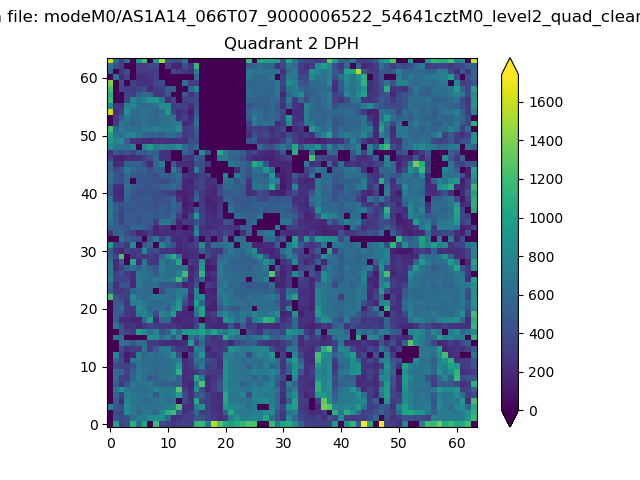 |
Quadrant C |
| Plot type | Count rate plots | Images |
|---|---|---|
| Comparison with Poisson distribution Blue bars denote a histogram of data divided into 1 sec bins. Red curve is a Poisson curve with rate = median count rate of data. |
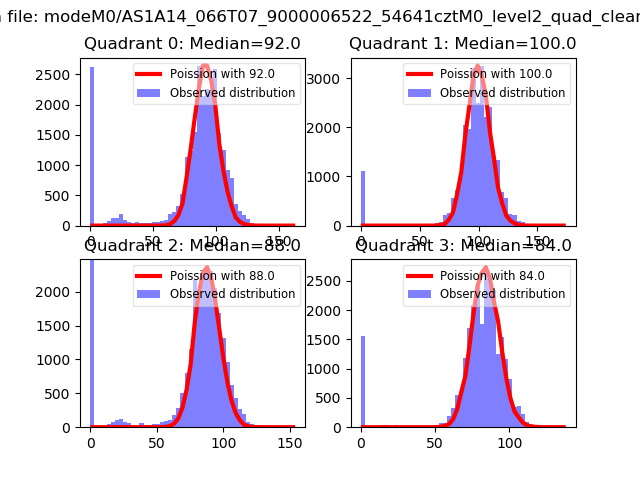 |
 |
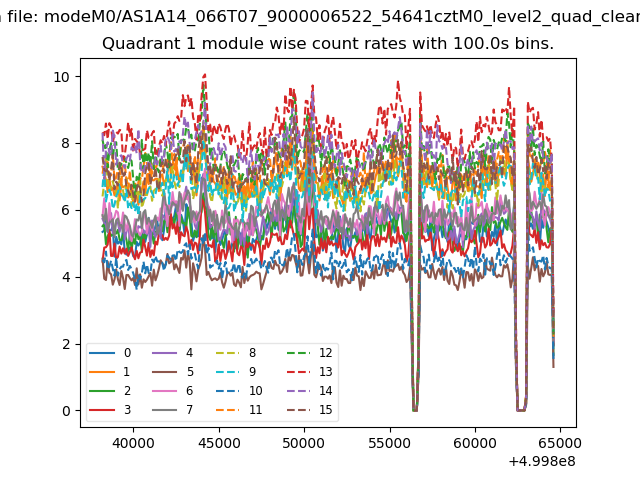
| Quadrant-wise count rates Data is divided into 100 sec bins |
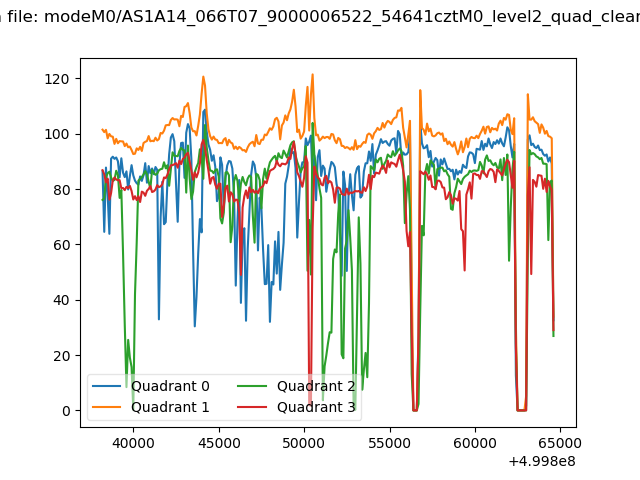 |
|
| Module-wise count rates for Quadrant A Data is divided into 100 sec bins |
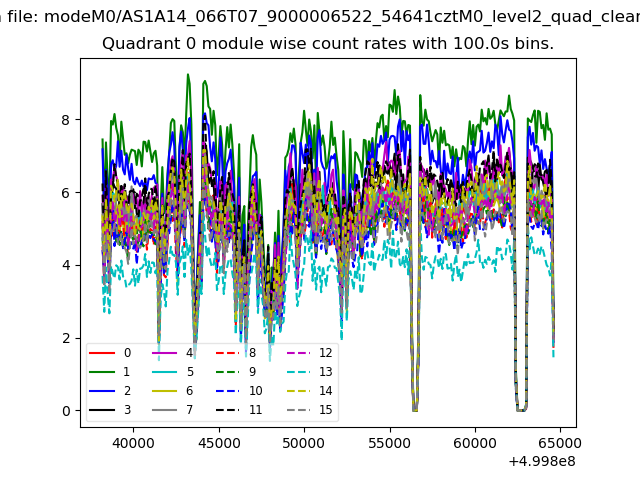 |
 |
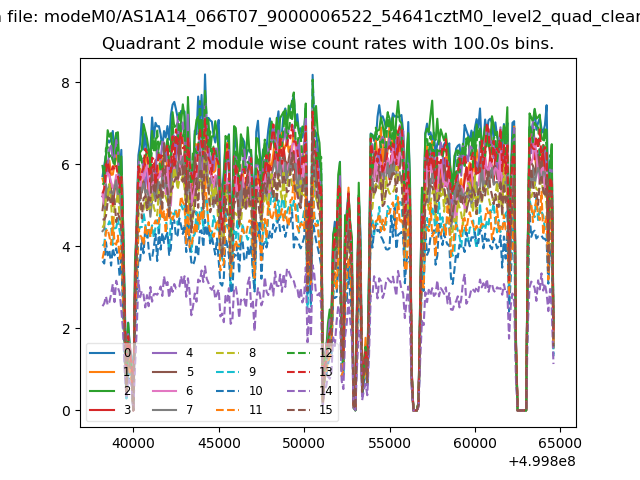
| Module-wise count rates for Quadrant B Data is divided into 100 sec bins |
 |
 |
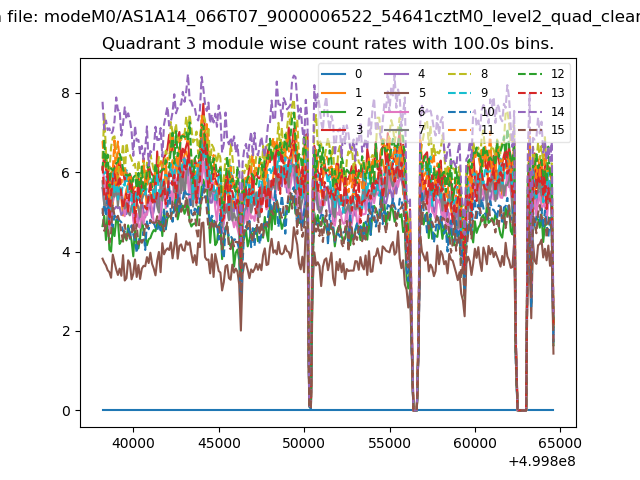
| Module-wise count rates for Quadrant C Data is divided into 100 sec bins |
 |
 |
| Module-wise count rates for Quadrant D Data is divided into 100 sec bins |
 |
 |
| Parameter | Plot |
|---|---|
| CZT HV Monitor | 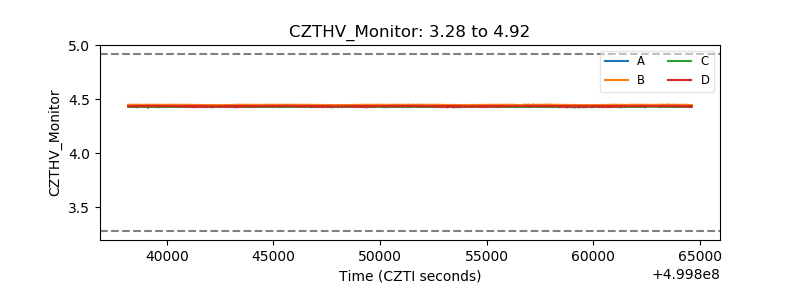 |
| D_VDD | 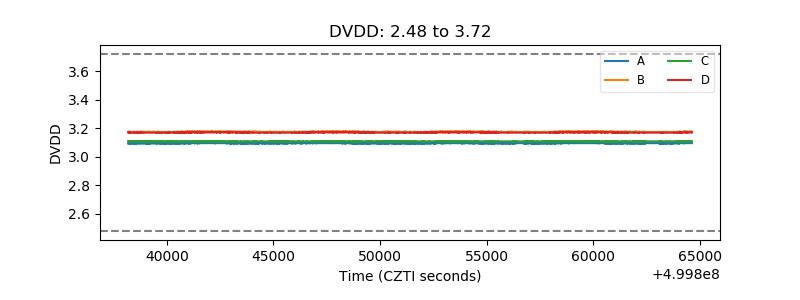 |
| Temperature 1 | 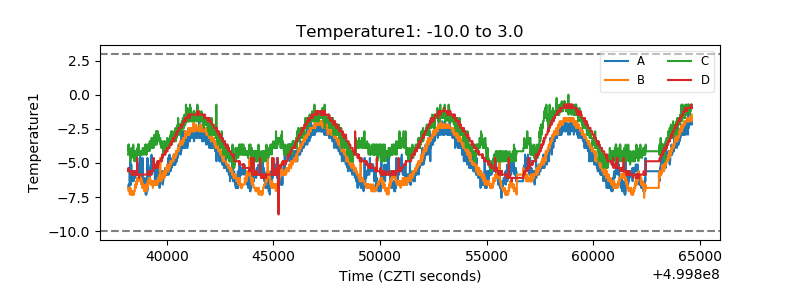 |
| Veto HV Monitor | 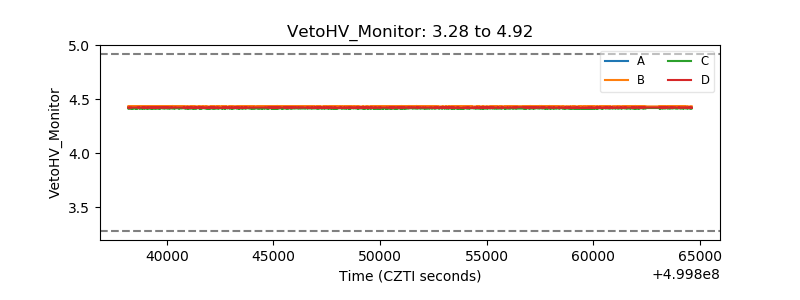 |
| Veto LLD | 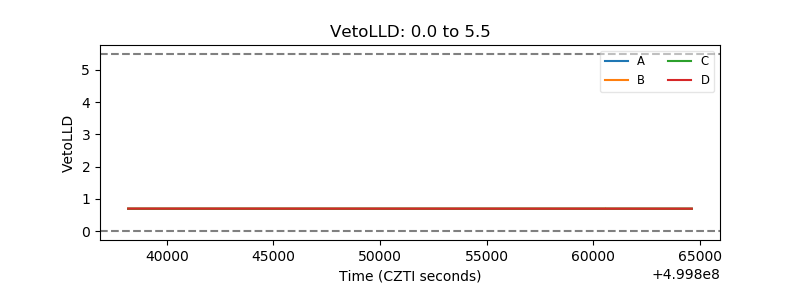 |
| Alpha Counter | 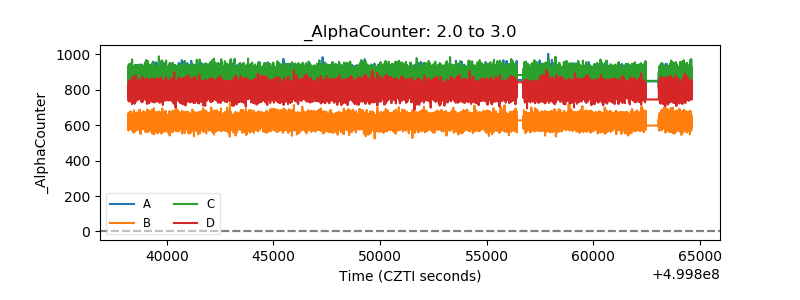 |
| _CPM_Rate | 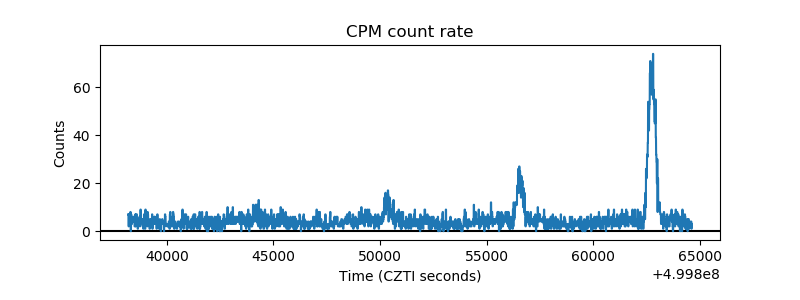 |
| CZT Counter | 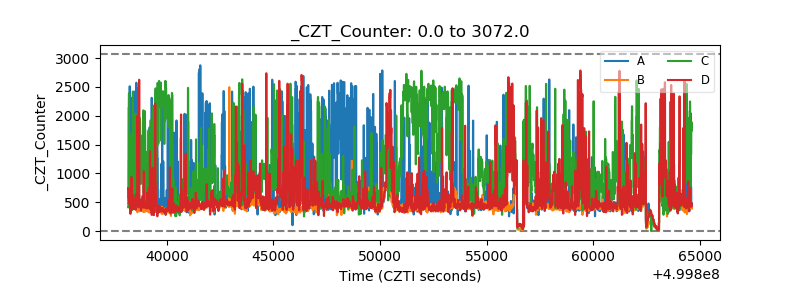 |
| +2.5 Volts monitor |  |
| +5 Volts monitor |  |
| _ROLL_ROT | 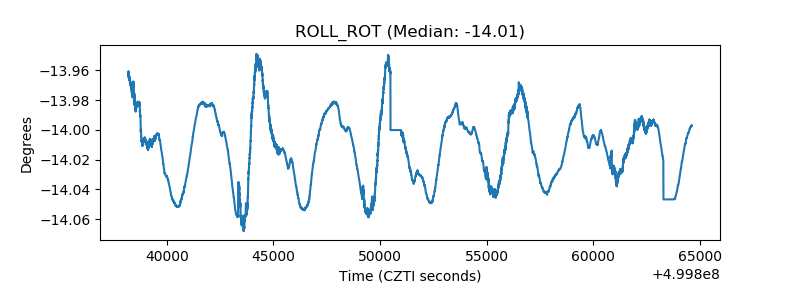 |
| _Roll_DEC | 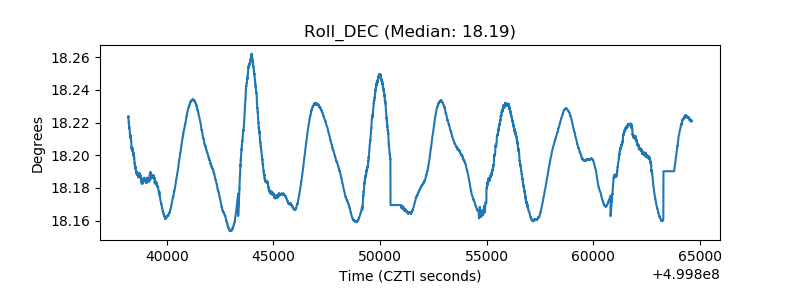 |
| _Roll_RA | 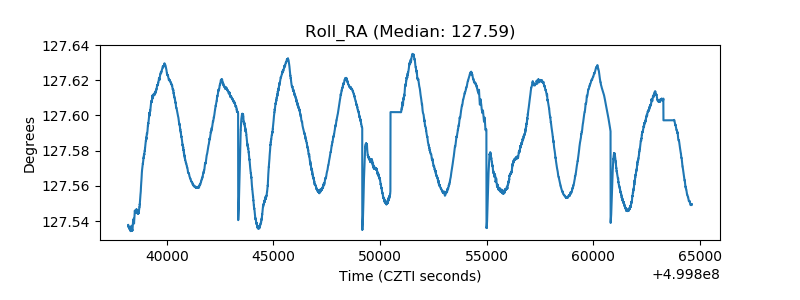 |
| Veto Counter | 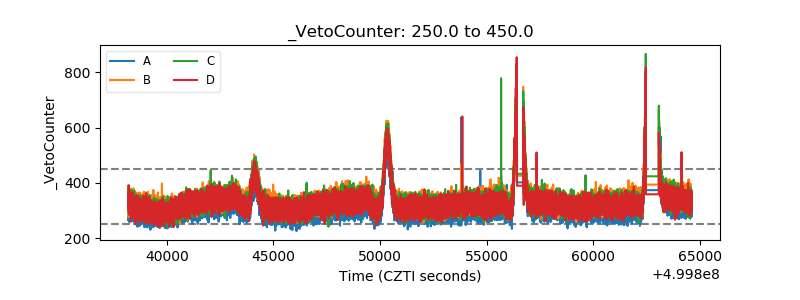 |