| Param | Original file | Final file |
|---|---|---|
| Filename | modeM0/AS1A14_066T07_9000006522_54642cztM0_level2.fits | modeM0/AS1A14_066T07_9000006522_54642cztM0_level2_quad_clean.evt |
| Size (bytes) | 534,790,080 | 94,420,800 |
| Size | 510.0 MB | 90.0 MB |
| Events in quadrant A | 3,542,734 | 625,360 |
| Events in quadrant B | 3,163,670 | 676,947 |
| Events in quadrant C | 7,688,662 | 536,266 |
| Events in quadrant D | 4,877,872 | 550,190 |
| Mode M9 | |||
|---|---|---|---|
| Quadrant | BADHDUFLAG | Total packets | Discarded packets |
| A | 0 | 8 | 0 |
| B | 0 | 8 | 0 |
| C | 0 | 8 | 0 |
| D | 0 | 8 | 0 |
| Mode M0 | |||
|---|---|---|---|
| Quadrant | BADHDUFLAG | Total packets | Discarded packets |
| A | 0 | 15261 | 1 |
| B | 0 | 14223 | 1 |
| C | 0 | 27564 | 1 |
| D | 0 | 19079 | 1 |
| Mode SS | |||
|---|---|---|---|
| Quadrant | BADHDUFLAG | Total packets | Discarded packets |
| A | 0 | 138 | 0 |
| B | 0 | 138 | 0 |
| C | 0 | 138 | 0 |
| D | 0 | 138 | 0 |
| Quadrant | Total seconds | Saturated seconds | Saturation percentage |
|---|---|---|---|
| A | 6738 | 221 | 3.279905% |
| B | 6739 | 116 | 1.721324% |
| C | 6739 | 965 | 14.319632% |
| D | 6739 | 401 | 5.950438% |
Noise dominated data is calculated using 1-second bins in cleaned event files. If a bin has >2000 counts, and if more than 50% of those come from <1% of pixels, then it is considered to be noise-dominated and hence unusable.
| Quadrant | # 1 sec bins | Bins with >0 counts | Bins with >2000 counts | High rate bins dominated by noise | Noise dominated (total time) | Noise dominated (detector-on time) | Marked lightcurve |
|---|---|---|---|---|---|---|---|
| A | 7523 | 6739 | 98 | 98 | 1.30% | 1.45% | 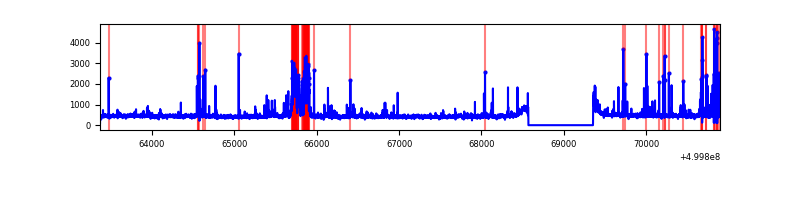 |
| B | 7524 | 6740 | 10 | 10 | 0.13% | 0.15% | 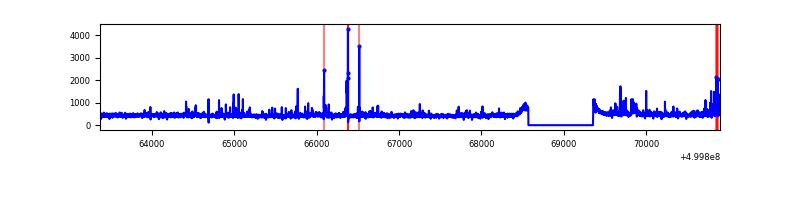 |
| C | 7524 | 6739 | 725 | 725 | 9.64% | 10.76% | 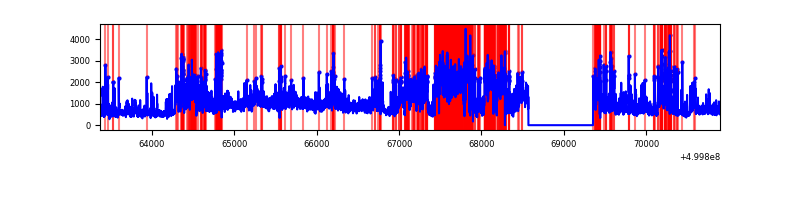 |
| D | 7524 | 6740 | 293 | 293 | 3.89% | 4.35% | 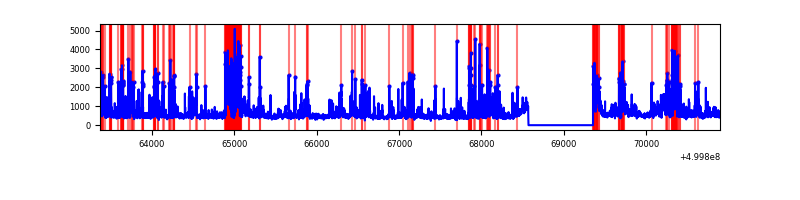 |
Top three noisy pixels from each quadrant. If the there are fewer than three noisy pixels in the level2.evt file, extra rows are filled as -1
| Pixel properties | Quadrant properties | ||||||
|---|---|---|---|---|---|---|---|
| Quadrant | DetID | PixID | Counts | Sigma | Mean | Median | Sigma |
| A | 7 | 190 | 312377 | 1712.4 | 743 | 724 | 182.0 |
| A | 11 | 3 | 113166 | 617.82 | 743 | 724 | 182.0 |
| A | 5 | 240 | 88912 | 484.56 | 743 | 724 | 182.0 |
| B | 5 | 172 | 64561 | 402.32 | 734 | 706 | 158.7 |
| B | 7 | 0 | 44701 | 277.19 | 734 | 706 | 158.7 |
| B | 7 | 252 | 39840 | 246.56 | 734 | 706 | 158.7 |
| C | 9 | 38 | 3336645 | 17577.34 | 691 | 683 | 189.8 |
| C | 1 | 16 | 1003685 | 5284.86 | 691 | 683 | 189.8 |
| C | 13 | 3 | 409532 | 2154.24 | 691 | 683 | 189.8 |
| D | 8 | 160 | 1391343 | 6873.85 | 714 | 683 | 202.3 |
| D | 6 | 239 | 177878 | 875.85 | 714 | 683 | 202.3 |
| D | 15 | 94 | 131479 | 646.51 | 714 | 683 | 202.3 |
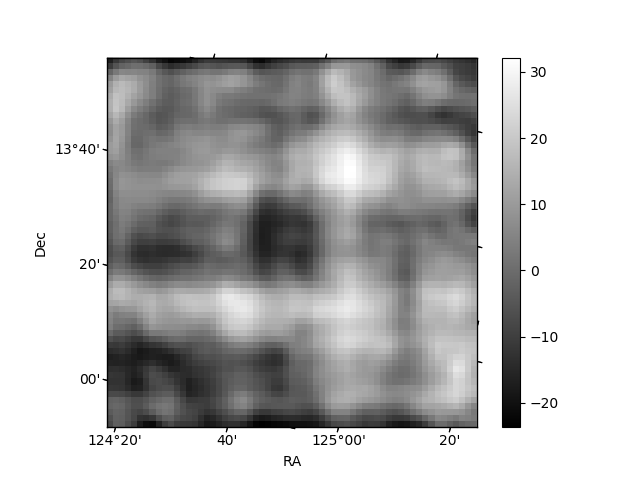
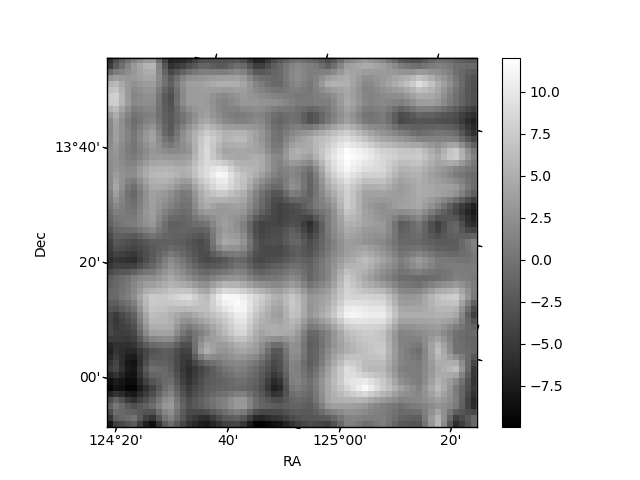
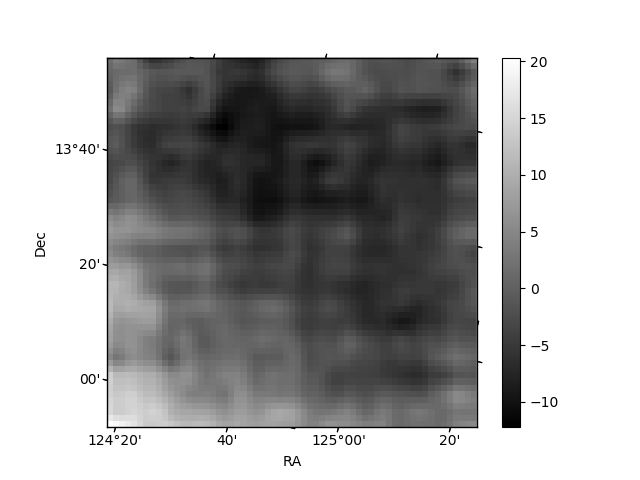
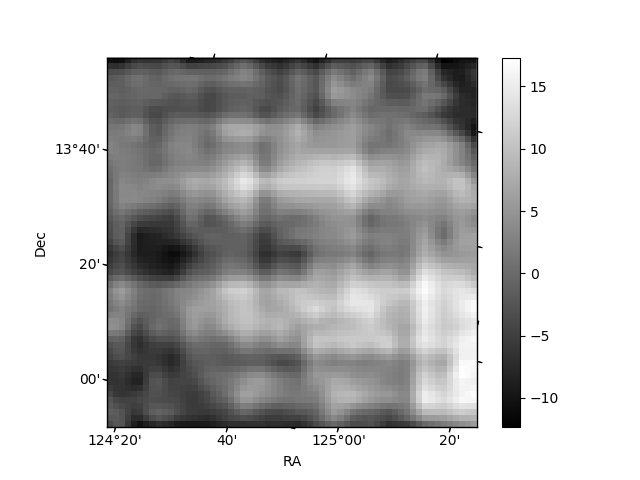
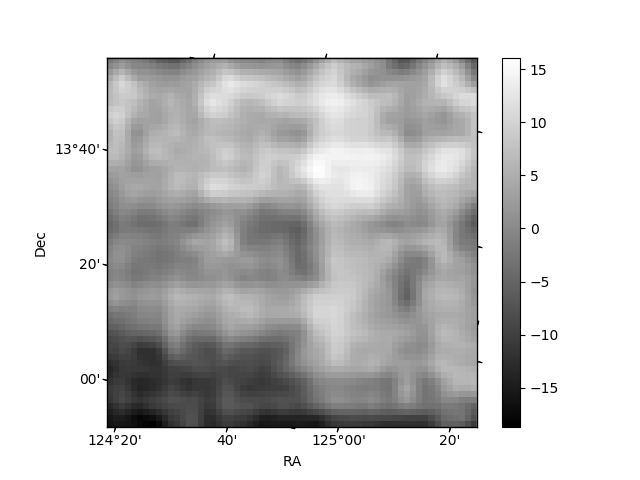
Histogram calculated using DETX and DETY for each event in the final _common_clean file
| Quadrant A | 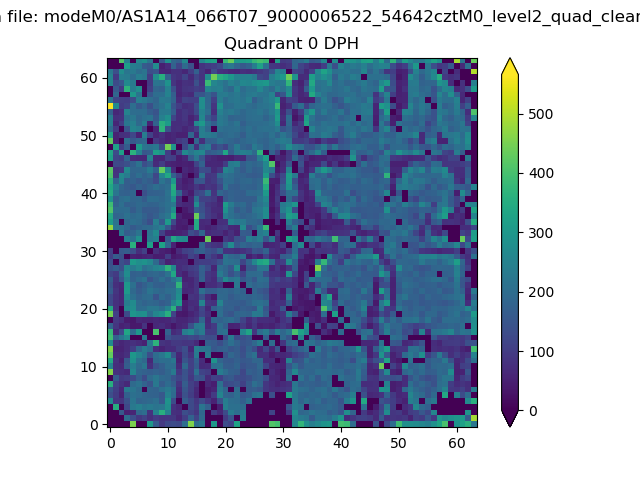 |
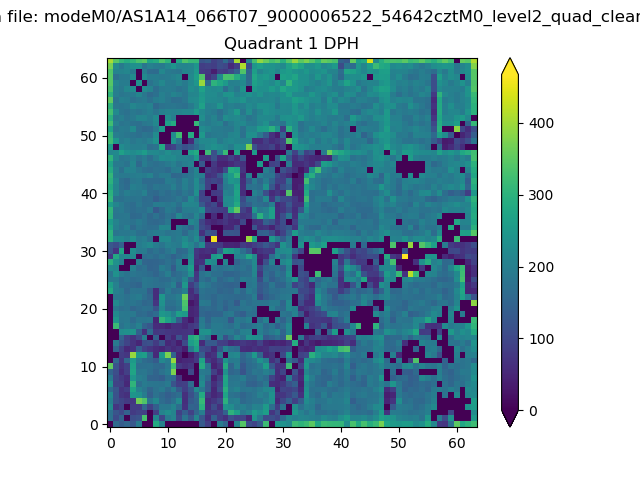 |
Quadrant B |
|---|---|---|---|
| Quadrant D | 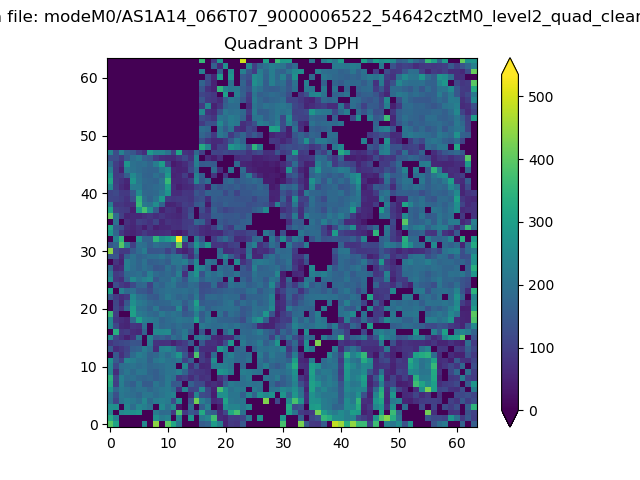 |
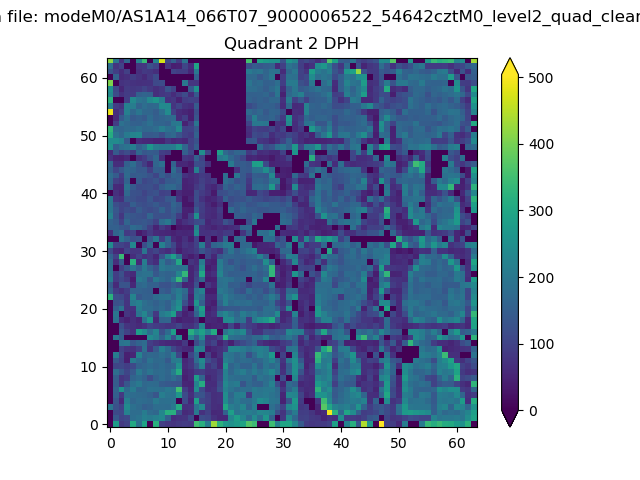 |
Quadrant C |
| Plot type | Count rate plots | Images |
|---|---|---|
| Comparison with Poisson distribution Blue bars denote a histogram of data divided into 1 sec bins. Red curve is a Poisson curve with rate = median count rate of data. |
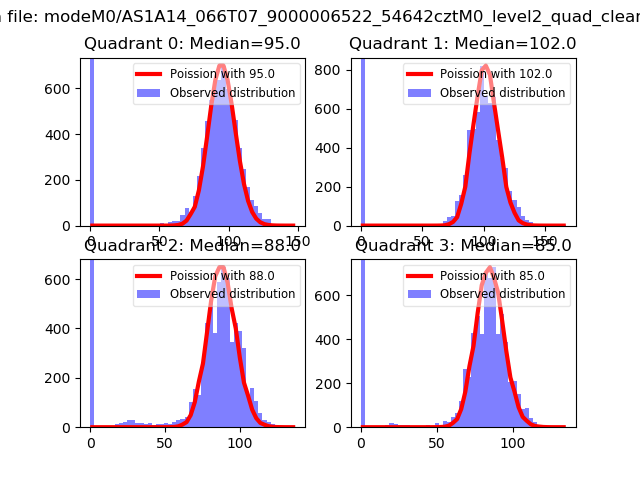 |
 |
| Quadrant-wise count rates Data is divided into 100 sec bins |
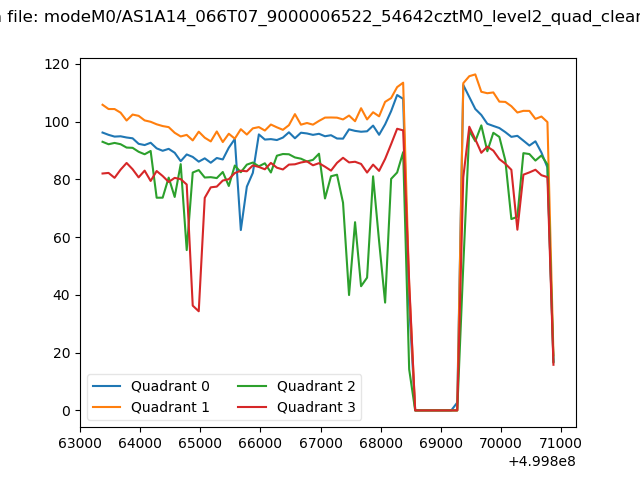 |
|
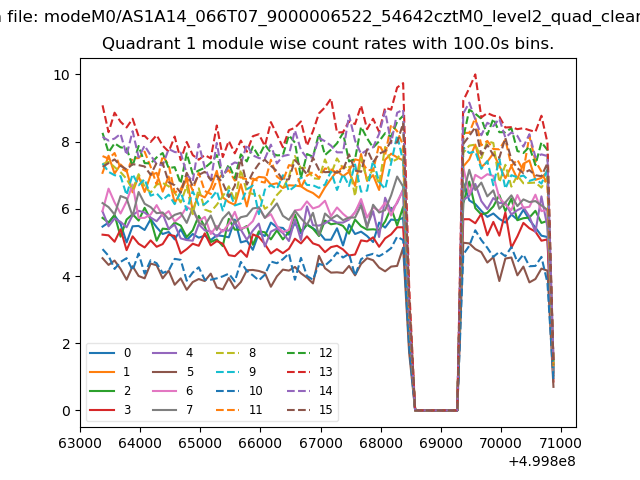
| Module-wise count rates for Quadrant A Data is divided into 100 sec bins |
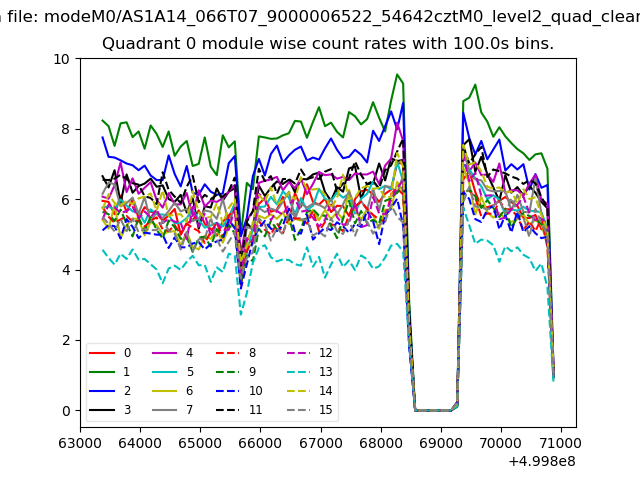 |
 |
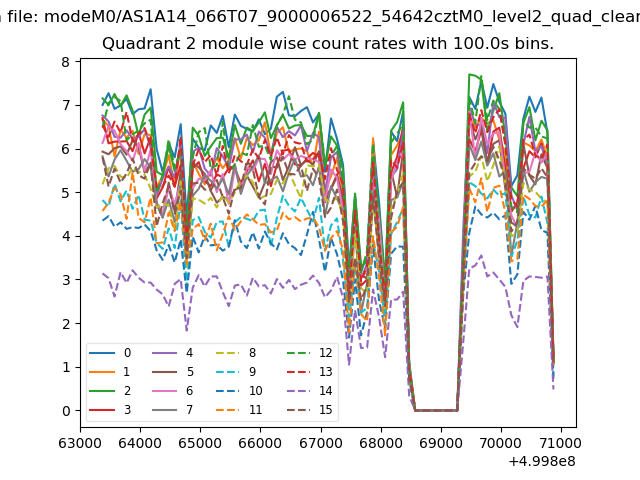
| Module-wise count rates for Quadrant B Data is divided into 100 sec bins |
 |
 |
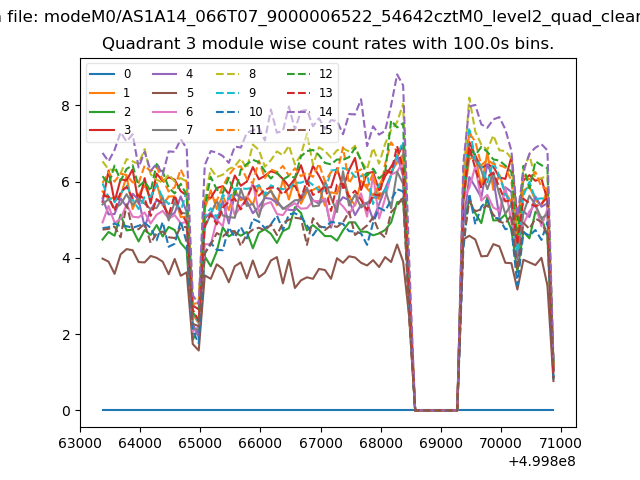
| Module-wise count rates for Quadrant C Data is divided into 100 sec bins |
 |
 |
| Module-wise count rates for Quadrant D Data is divided into 100 sec bins |
 |
 |
| Parameter | Plot |
|---|---|
| CZT HV Monitor | 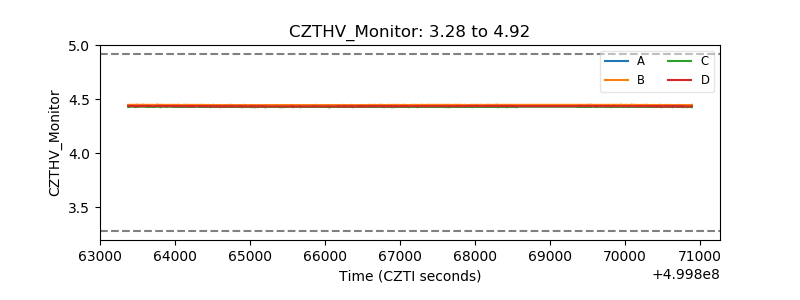 |
| D_VDD | 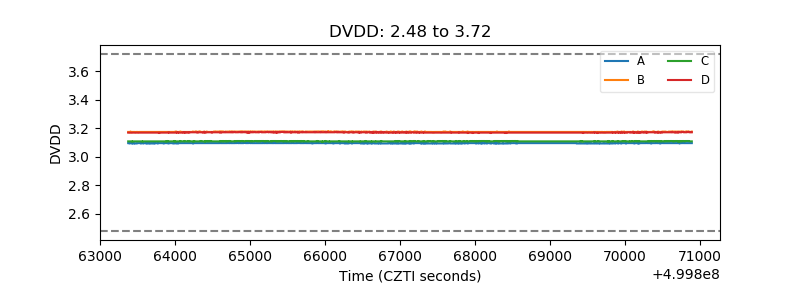 |
| Temperature 1 | 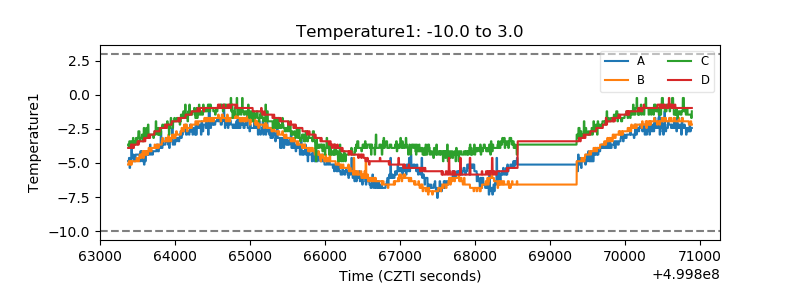 |
| Veto HV Monitor | 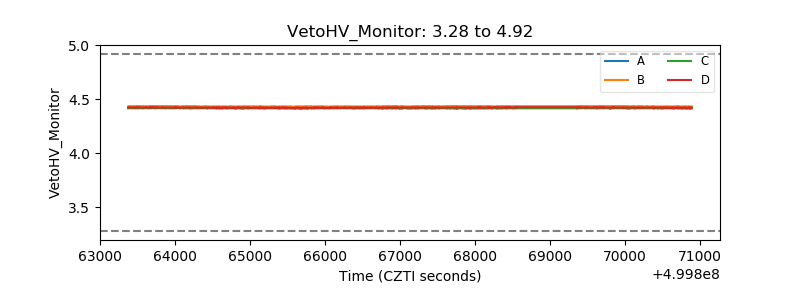 |
| Veto LLD | 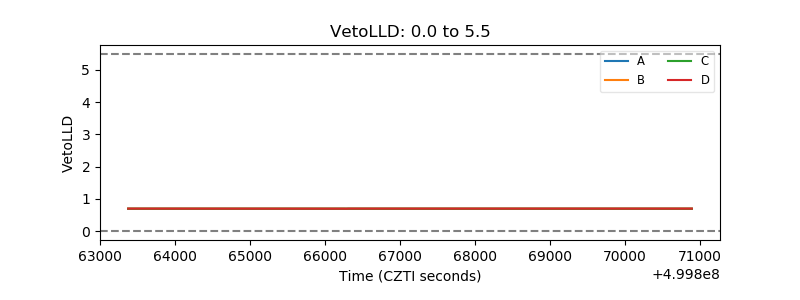 |
| Alpha Counter | 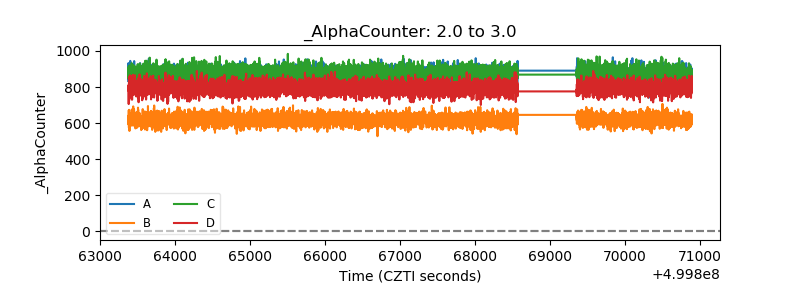 |
| _CPM_Rate | 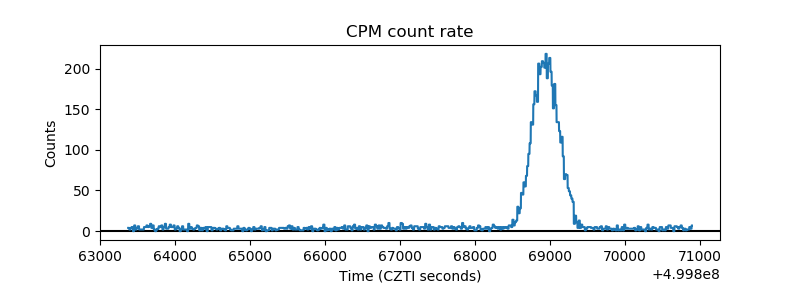 |
| CZT Counter | 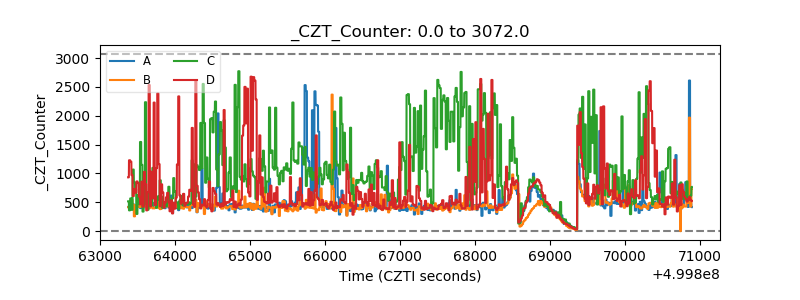 |
| +2.5 Volts monitor |  |
| +5 Volts monitor |  |
| _ROLL_ROT | 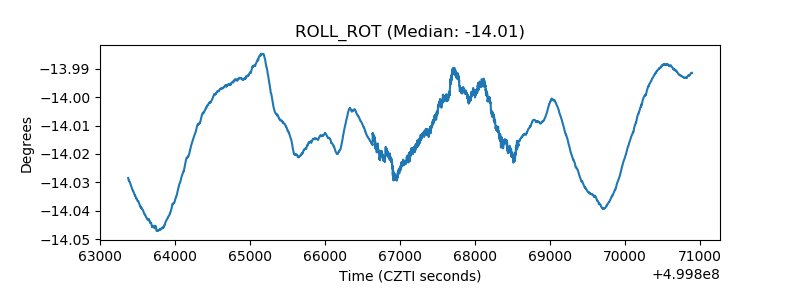 |
| _Roll_DEC | 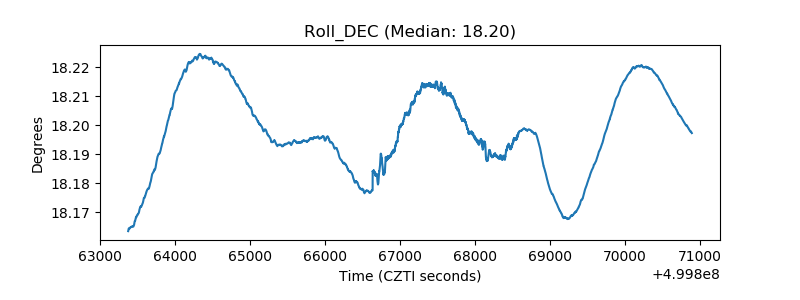 |
| _Roll_RA | 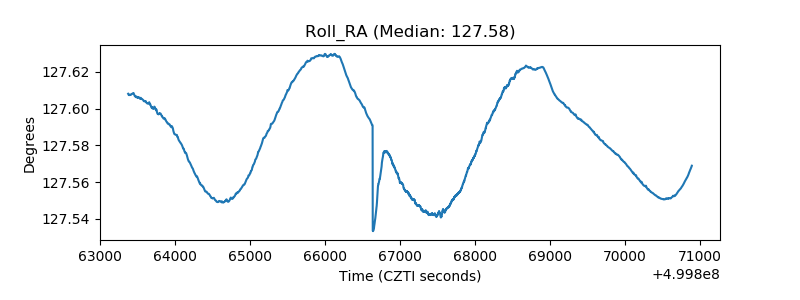 |
| Veto Counter | 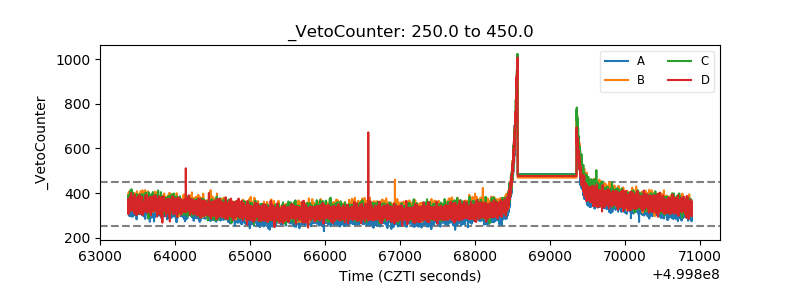 |