| Param | Original file | Final file |
|---|---|---|
| Filename | modeM0/AS1A14_066T07_9000006522_54646cztM0_level2.fits | modeM0/AS1A14_066T07_9000006522_54646cztM0_level2_quad_clean.evt |
| Size (bytes) | 443,004,480 | 98,539,200 |
| Size | 422.5 MB | 94.0 MB |
| Events in quadrant A | 3,212,022 | 662,493 |
| Events in quadrant B | 3,430,896 | 704,106 |
| Events in quadrant C | 5,720,106 | 573,282 |
| Events in quadrant D | 3,536,295 | 595,852 |
| Mode M9 | |||
|---|---|---|---|
| Quadrant | BADHDUFLAG | Total packets | Discarded packets |
| A | 0 | 20 | 0 |
| B | 0 | 21 | 0 |
| C | 0 | 21 | 0 |
| D | 0 | 21 | 0 |
| Mode M0 | |||
|---|---|---|---|
| Quadrant | BADHDUFLAG | Total packets | Discarded packets |
| A | 0 | 13965 | 2 |
| B | 0 | 14488 | 2 |
| C | 0 | 21340 | 2 |
| D | 0 | 14978 | 2 |
| Mode SS | |||
|---|---|---|---|
| Quadrant | BADHDUFLAG | Total packets | Discarded packets |
| A | 0 | 132 | 0 |
| B | 0 | 132 | 0 |
| C | 0 | 132 | 0 |
| D | 0 | 132 | 0 |
| Quadrant | Total seconds | Saturated seconds | Saturation percentage |
|---|---|---|---|
| A | 6420 | 123 | 1.915888% |
| B | 6420 | 185 | 2.881620% |
| C | 6419 | 699 | 10.889547% |
| D | 6419 | 118 | 1.838293% |
Noise dominated data is calculated using 1-second bins in cleaned event files. If a bin has >2000 counts, and if more than 50% of those come from <1% of pixels, then it is considered to be noise-dominated and hence unusable.
| Quadrant | # 1 sec bins | Bins with >0 counts | Bins with >2000 counts | High rate bins dominated by noise | Noise dominated (total time) | Noise dominated (detector-on time) | Marked lightcurve |
|---|---|---|---|---|---|---|---|
| A | 7545 | 6421 | 32 | 32 | 0.42% | 0.50% | 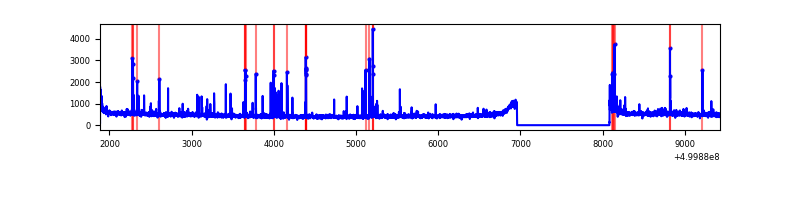 |
| B | 7545 | 6421 | 57 | 57 | 0.76% | 0.89% | 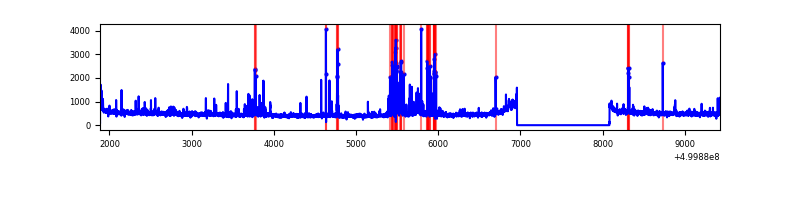 |
| C | 7544 | 6420 | 432 | 432 | 5.73% | 6.73% | 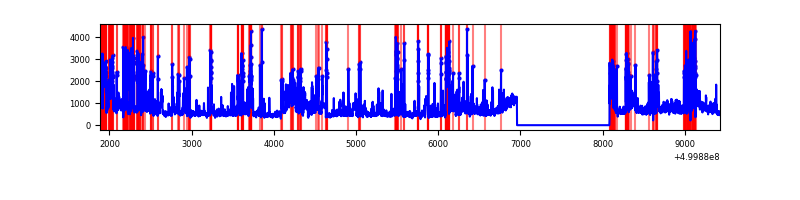 |
| D | 7544 | 6420 | 44 | 44 | 0.58% | 0.69% | 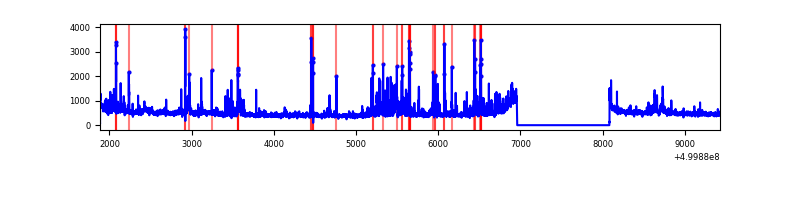 |
Top three noisy pixels from each quadrant. If the there are fewer than three noisy pixels in the level2.evt file, extra rows are filled as -1
| Pixel properties | Quadrant properties | ||||||
|---|---|---|---|---|---|---|---|
| Quadrant | DetID | PixID | Counts | Sigma | Mean | Median | Sigma |
| A | 11 | 3 | 164536 | 893.83 | 752 | 733 | 183.3 |
| A | 5 | 240 | 41361 | 221.7 | 752 | 733 | 183.3 |
| A | 4 | 3 | 21125 | 111.27 | 752 | 733 | 183.3 |
| B | 10 | 247 | 378331 | 2392.99 | 739 | 714 | 157.8 |
| B | 7 | 0 | 42955 | 267.68 | 739 | 714 | 157.8 |
| B | 0 | 245 | 19080 | 116.39 | 739 | 714 | 157.8 |
| C | 9 | 38 | 2278581 | 11788.38 | 704 | 698 | 193.2 |
| C | 6 | 223 | 166792 | 859.56 | 704 | 698 | 193.2 |
| C | 12 | 252 | 156954 | 808.65 | 704 | 698 | 193.2 |
| D | 6 | 239 | 212515 | 1032.28 | 734 | 703 | 205.2 |
| D | 15 | 94 | 141883 | 688.05 | 734 | 703 | 205.2 |
| D | 2 | 249 | 91917 | 444.54 | 734 | 703 | 205.2 |
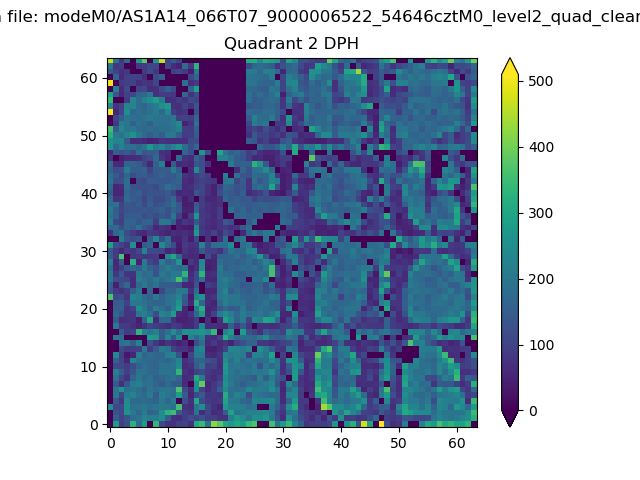
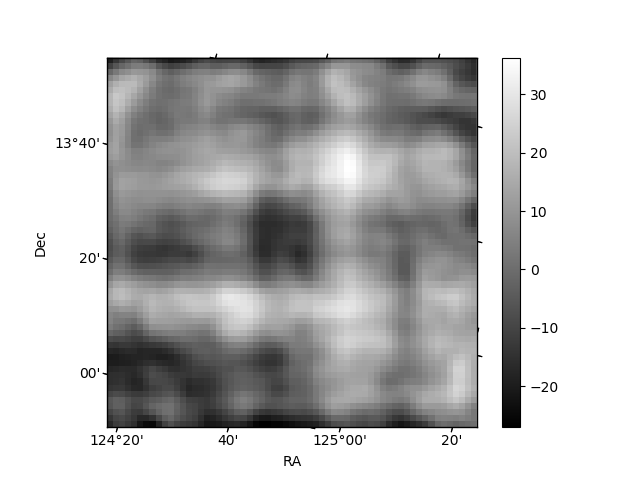
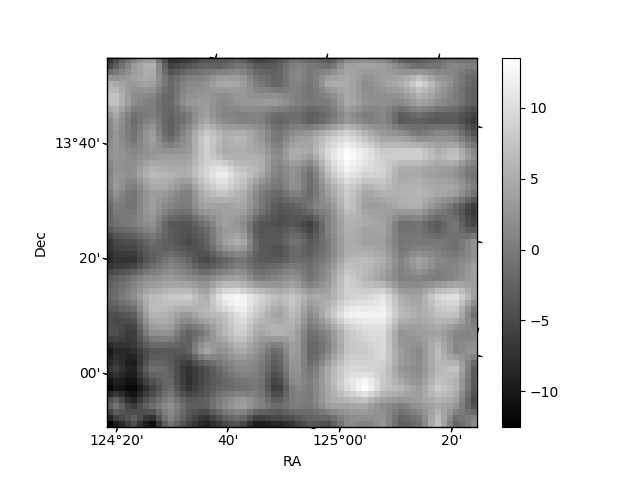
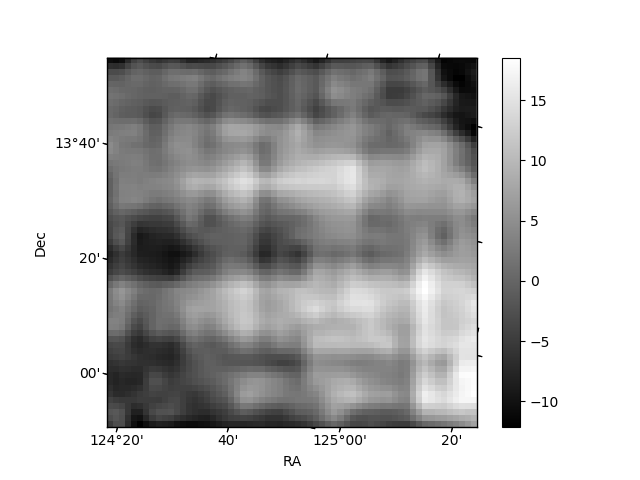
Histogram calculated using DETX and DETY for each event in the final _common_clean file
| Quadrant A | 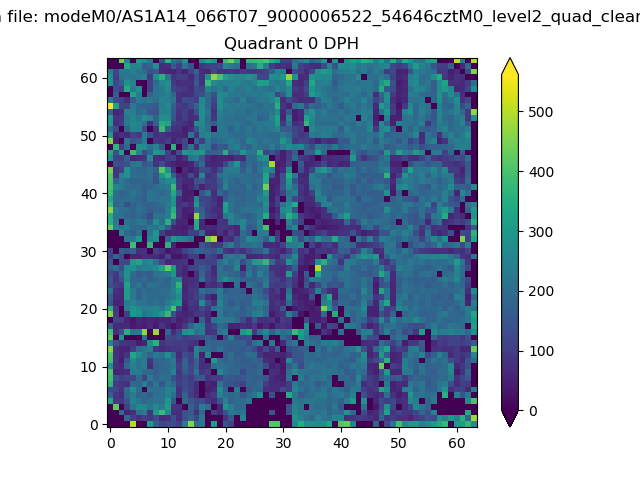 |
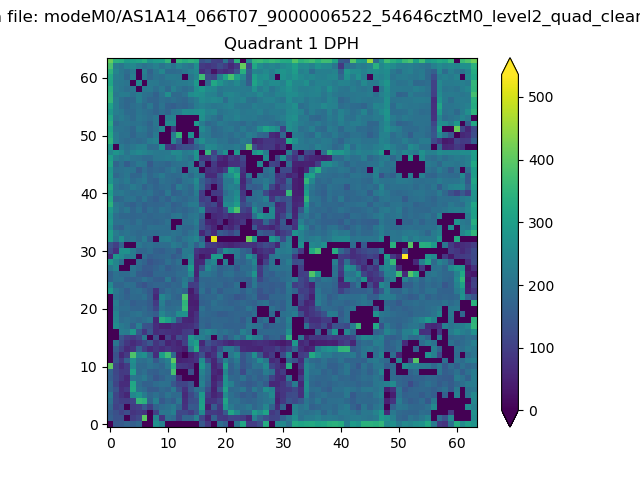 |
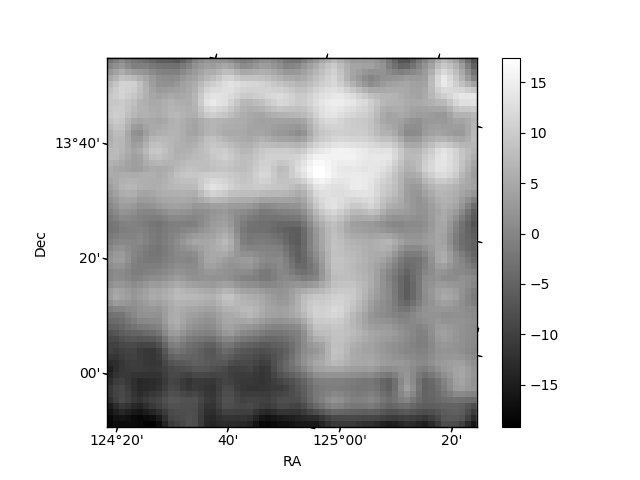
Quadrant B |
|---|---|---|---|
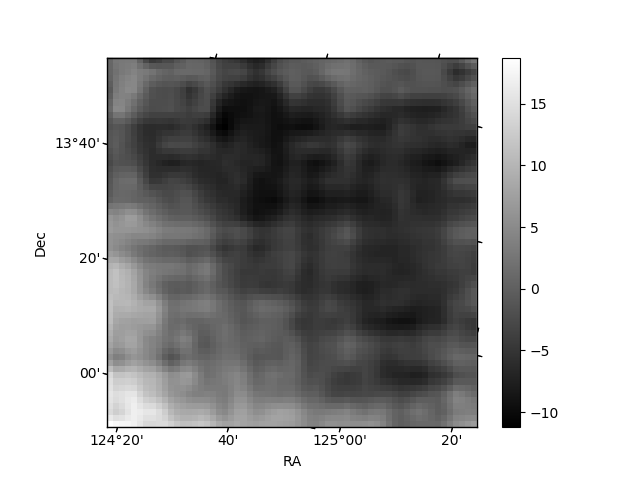
| Quadrant D | 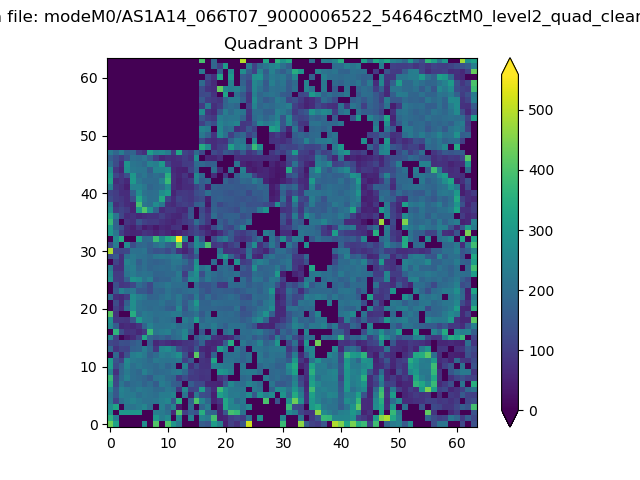 |
 |
Quadrant C |
| Plot type | Count rate plots | Images |
|---|---|---|
| Comparison with Poisson distribution Blue bars denote a histogram of data divided into 1 sec bins. Red curve is a Poisson curve with rate = median count rate of data. |
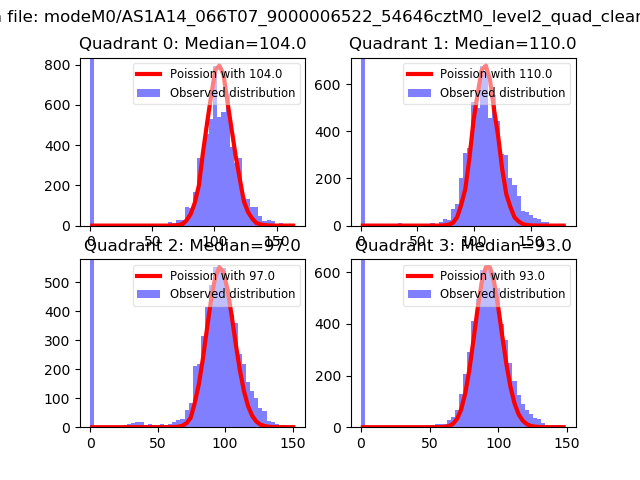 |
 |
| Quadrant-wise count rates Data is divided into 100 sec bins |
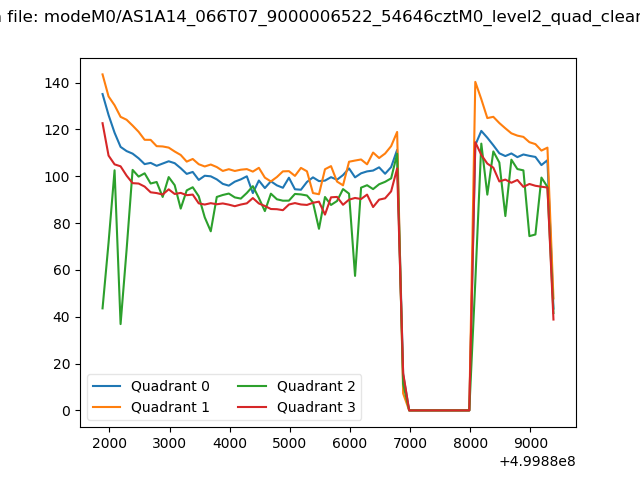 |
|
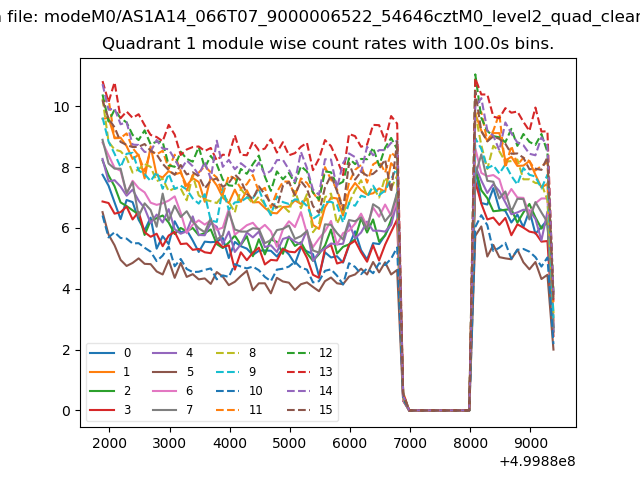
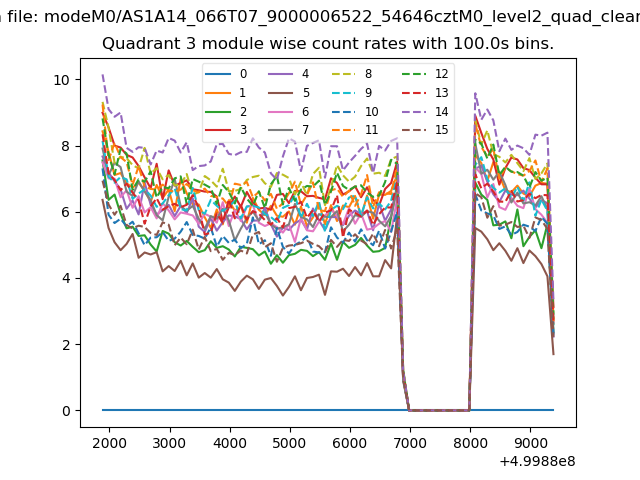
| Module-wise count rates for Quadrant A Data is divided into 100 sec bins |
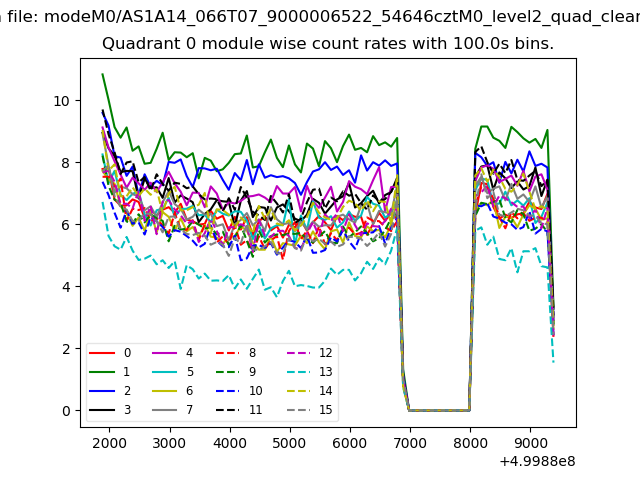 |
 |
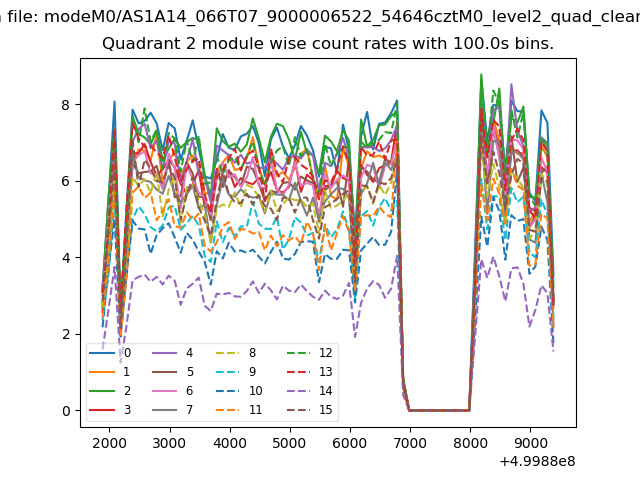
| Module-wise count rates for Quadrant B Data is divided into 100 sec bins |
 |
 |
| Module-wise count rates for Quadrant C Data is divided into 100 sec bins |
 |
 |
| Module-wise count rates for Quadrant D Data is divided into 100 sec bins |
 |
 |
| Parameter | Plot |
|---|---|
| CZT HV Monitor | 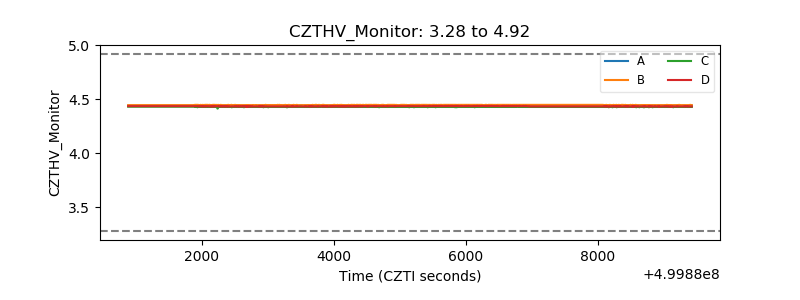 |
| D_VDD | 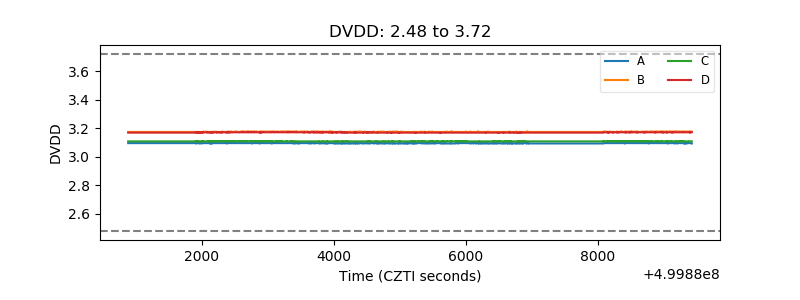 |
| Temperature 1 | 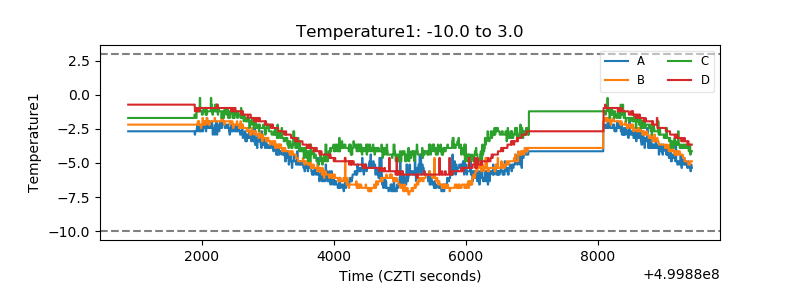 |
| Veto HV Monitor | 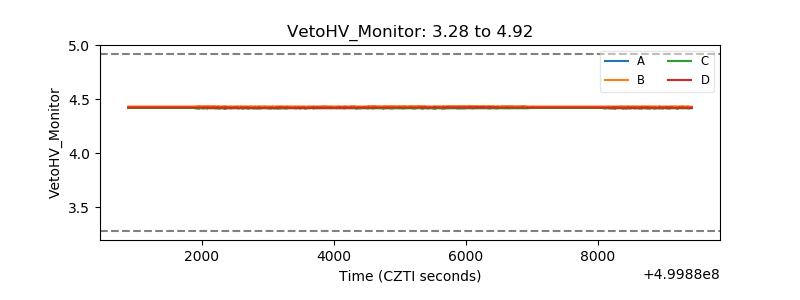 |
| Veto LLD | 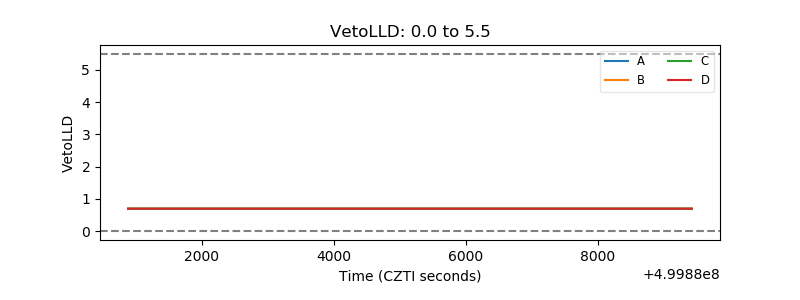 |
| Alpha Counter | 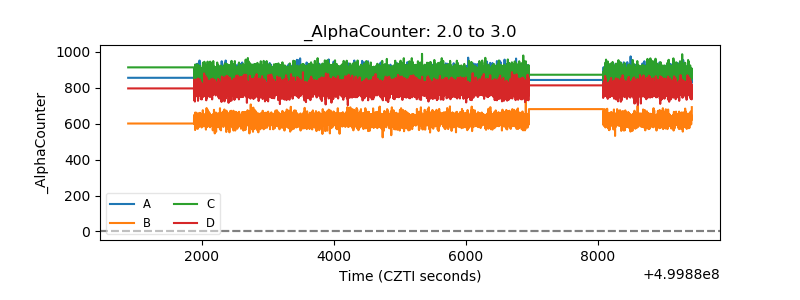 |
| _CPM_Rate | 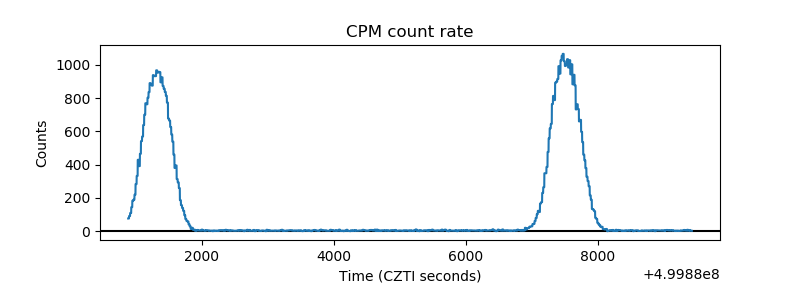 |
| CZT Counter | 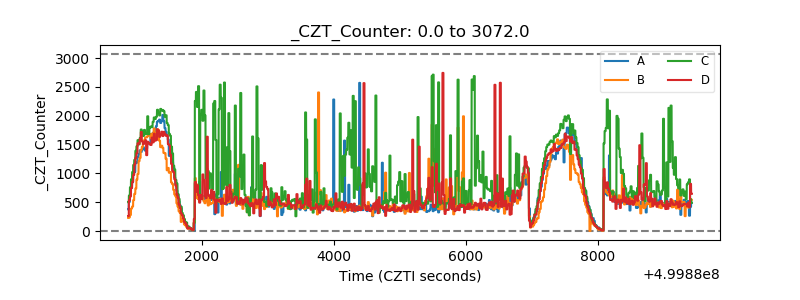 |
| +2.5 Volts monitor |  |
| +5 Volts monitor | 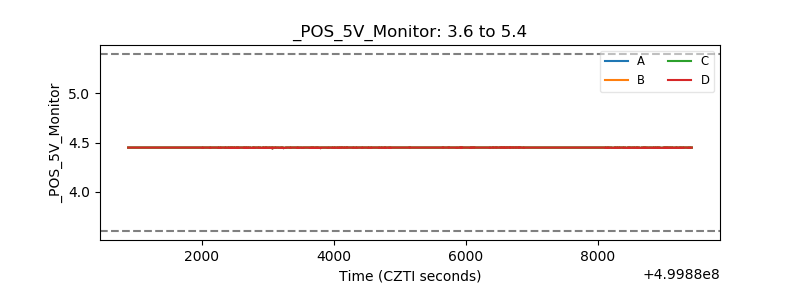 |
| _ROLL_ROT | 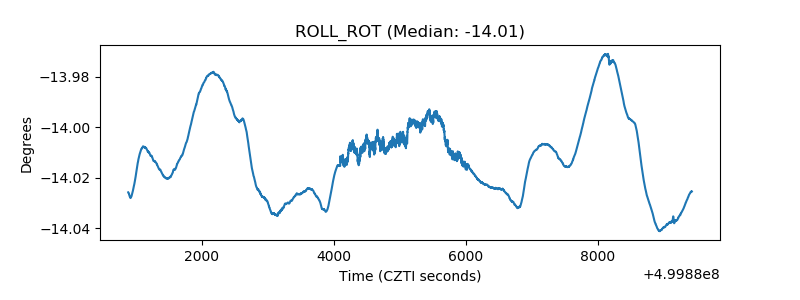 |
| _Roll_DEC |  |
| _Roll_RA | 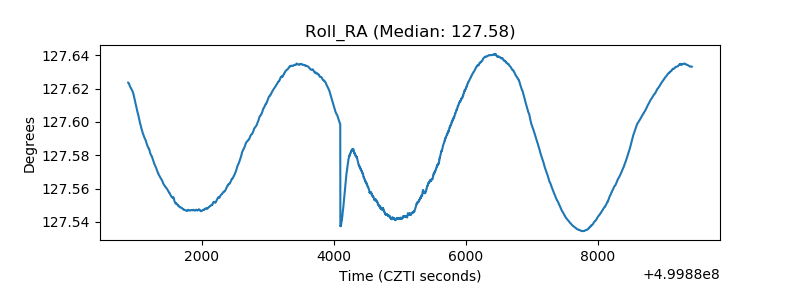 |
| Veto Counter | 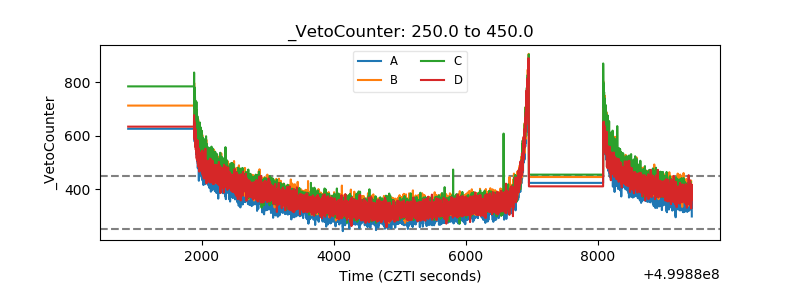 |