| Param | Original file | Final file |
|---|---|---|
| Filename | modeM0/AS1A14_066T07_9000006522_54647cztM0_level2.fits | modeM0/AS1A14_066T07_9000006522_54647cztM0_level2_quad_clean.evt |
| Size (bytes) | 467,873,280 | 95,996,160 |
| Size | 446.2 MB | 91.5 MB |
| Events in quadrant A | 3,130,233 | 653,331 |
| Events in quadrant B | 3,437,863 | 689,906 |
| Events in quadrant C | 5,469,058 | 580,726 |
| Events in quadrant D | 4,788,280 | 539,403 |
| Mode M9 | |||
|---|---|---|---|
| Quadrant | BADHDUFLAG | Total packets | Discarded packets |
| A | 0 | 16 | 0 |
| B | 0 | 17 | 0 |
| C | 0 | 17 | 0 |
| D | 0 | 17 | 0 |
| Mode M0 | |||
|---|---|---|---|
| Quadrant | BADHDUFLAG | Total packets | Discarded packets |
| A | 0 | 13702 | 3 |
| B | 0 | 14674 | 2 |
| C | 0 | 20893 | 2 |
| D | 0 | 18559 | 2 |
| Mode SS | |||
|---|---|---|---|
| Quadrant | BADHDUFLAG | Total packets | Discarded packets |
| A | 0 | 130 | 0 |
| B | 0 | 130 | 0 |
| C | 0 | 130 | 0 |
| D | 0 | 130 | 0 |
| Quadrant | Total seconds | Saturated seconds | Saturation percentage |
|---|---|---|---|
| A | 6351 | 111 | 1.747756% |
| B | 6351 | 239 | 3.763187% |
| C | 6351 | 630 | 9.919698% |
| D | 6351 | 619 | 9.746497% |
Noise dominated data is calculated using 1-second bins in cleaned event files. If a bin has >2000 counts, and if more than 50% of those come from <1% of pixels, then it is considered to be noise-dominated and hence unusable.
| Quadrant | # 1 sec bins | Bins with >0 counts | Bins with >2000 counts | High rate bins dominated by noise | Noise dominated (total time) | Noise dominated (detector-on time) | Marked lightcurve |
|---|---|---|---|---|---|---|---|
| A | 7536 | 6352 | 21 | 21 | 0.28% | 0.33% | 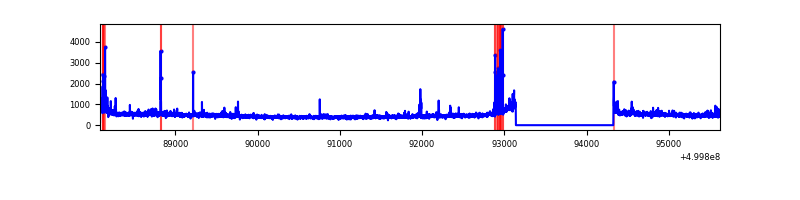 |
| B | 7536 | 6352 | 94 | 94 | 1.25% | 1.48% | 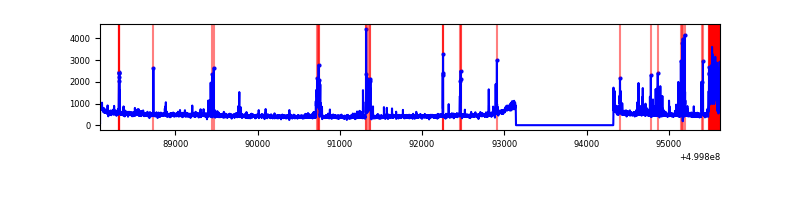 |
| C | 7536 | 6352 | 449 | 449 | 5.96% | 7.07% | 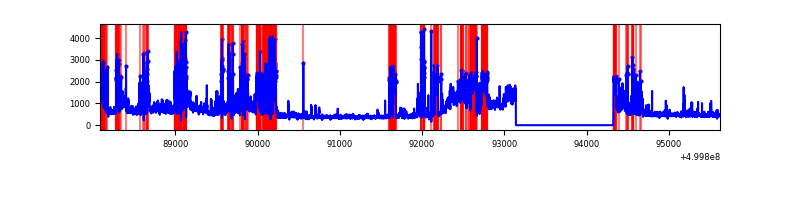 |
| D | 7536 | 6352 | 486 | 486 | 6.45% | 7.65% | 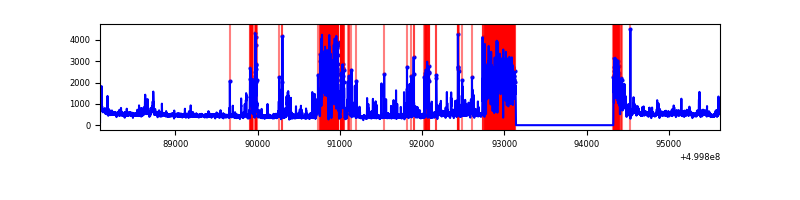 |
Top three noisy pixels from each quadrant. If the there are fewer than three noisy pixels in the level2.evt file, extra rows are filled as -1
| Pixel properties | Quadrant properties | ||||||
|---|---|---|---|---|---|---|---|
| Quadrant | DetID | PixID | Counts | Sigma | Mean | Median | Sigma |
| A | 8 | 6 | 87275 | 478.39 | 734 | 716 | 180.9 |
| A | 11 | 3 | 45801 | 249.17 | 734 | 716 | 180.9 |
| A | 5 | 240 | 31517 | 170.23 | 734 | 716 | 180.9 |
| B | 12 | 0 | 217932 | 1398.56 | 722 | 697 | 155.3 |
| B | 10 | 247 | 142891 | 915.45 | 722 | 697 | 155.3 |
| B | 2 | 249 | 119472 | 764.68 | 722 | 697 | 155.3 |
| C | 9 | 38 | 2254163 | 11809.12 | 697 | 690 | 190.8 |
| C | 6 | 223 | 289824 | 1515.18 | 697 | 690 | 190.8 |
| C | 4 | 5 | 51529 | 266.42 | 697 | 690 | 190.8 |
| D | 2 | 62 | 1606009 | 8268.05 | 682 | 651 | 194.2 |
| D | 14 | 52 | 153322 | 786.3 | 682 | 651 | 194.2 |
| D | 6 | 239 | 107084 | 548.16 | 682 | 651 | 194.2 |
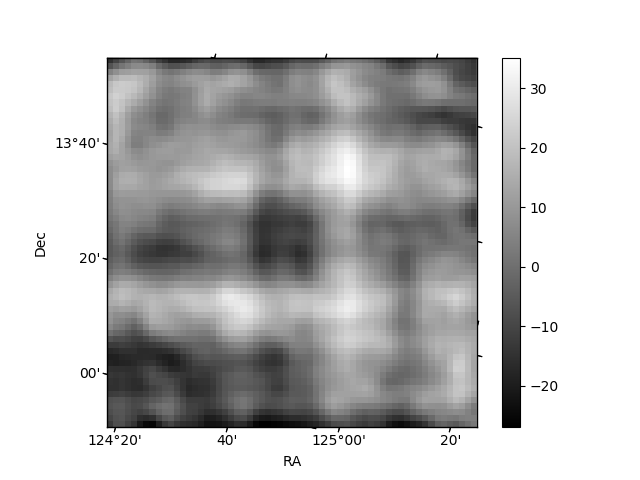
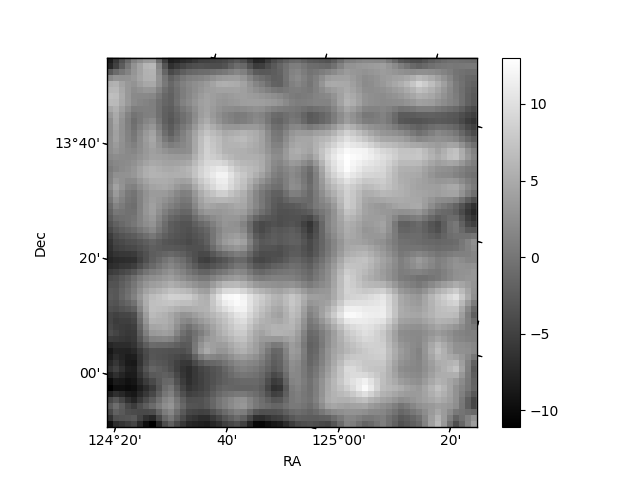
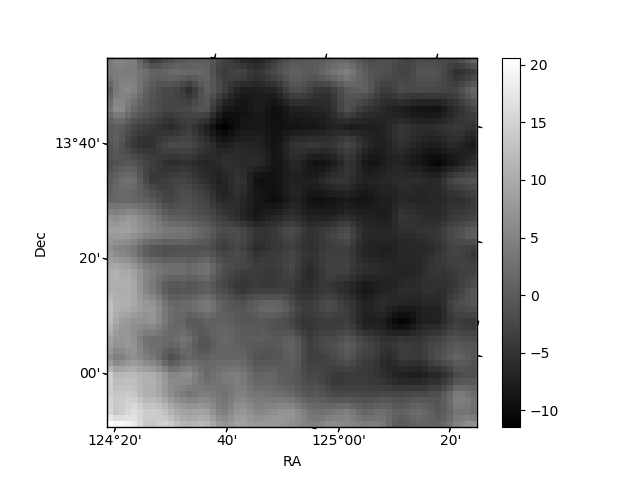
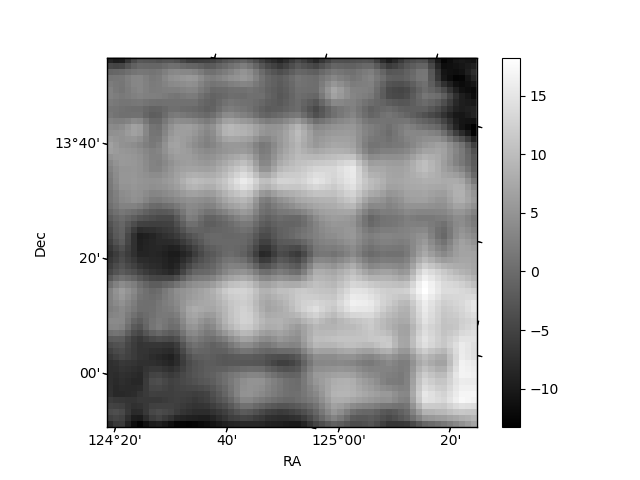
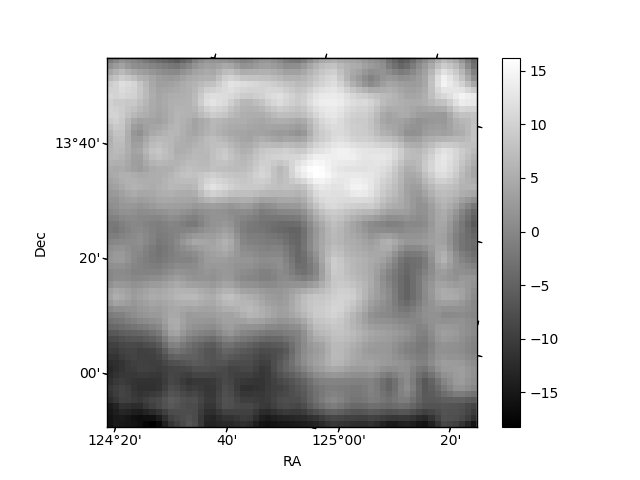
Histogram calculated using DETX and DETY for each event in the final _common_clean file
| Quadrant A | 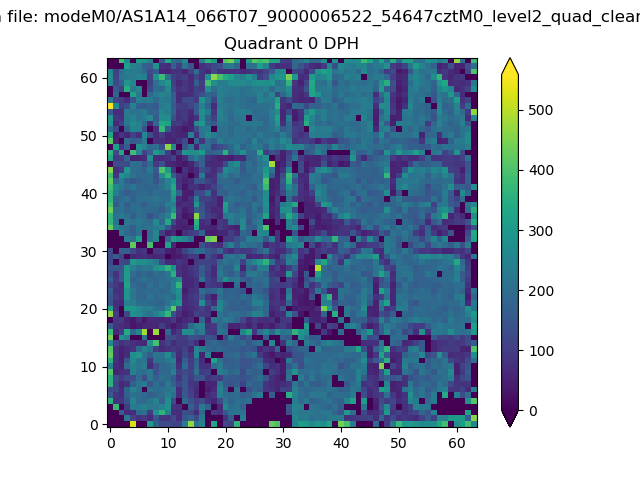 |
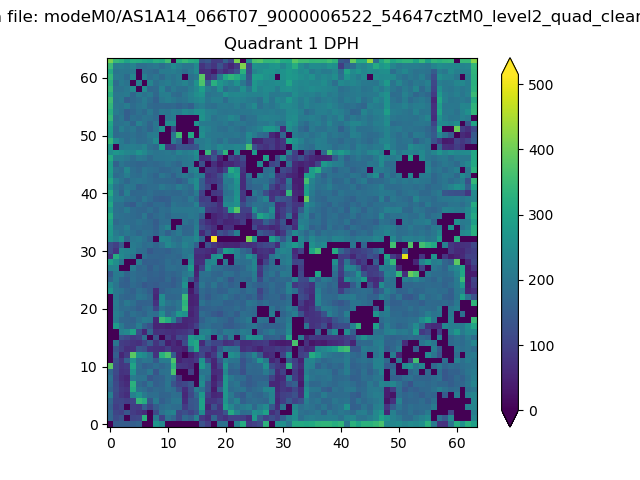 |
Quadrant B |
|---|---|---|---|
| Quadrant D | 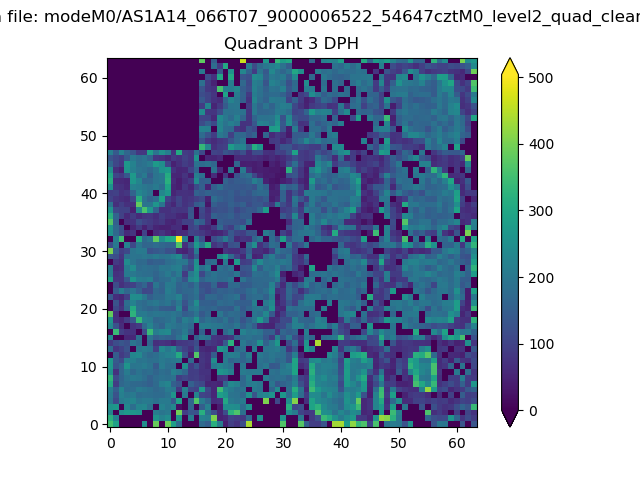 |
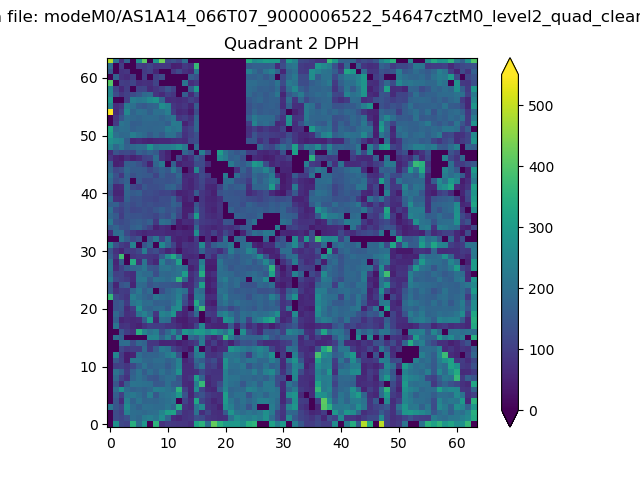 |
Quadrant C |
| Plot type | Count rate plots | Images |
|---|---|---|
| Comparison with Poisson distribution Blue bars denote a histogram of data divided into 1 sec bins. Red curve is a Poisson curve with rate = median count rate of data. |
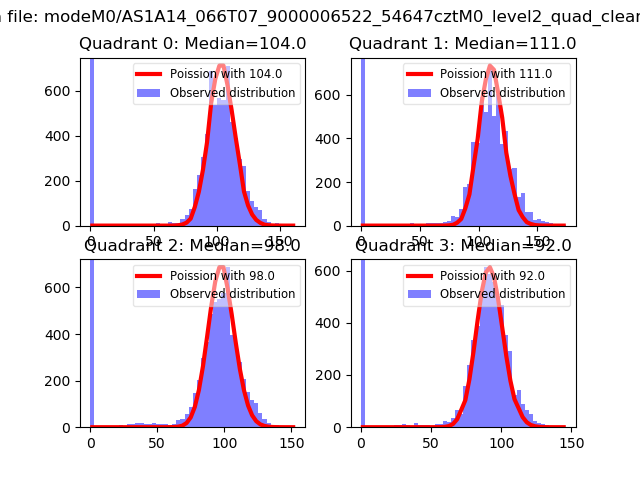 |
 |
| Quadrant-wise count rates Data is divided into 100 sec bins |
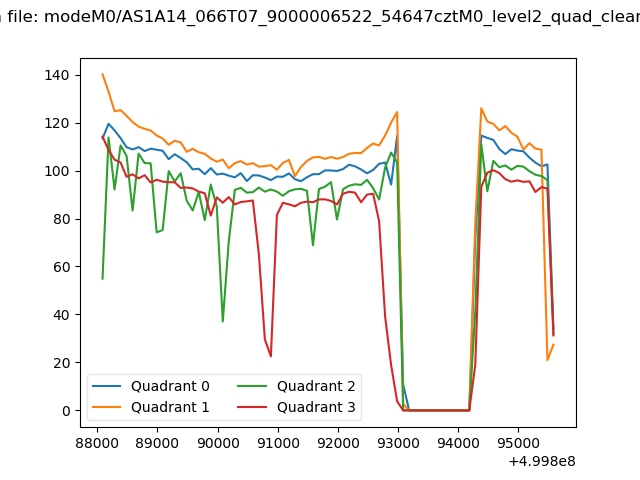 |
|
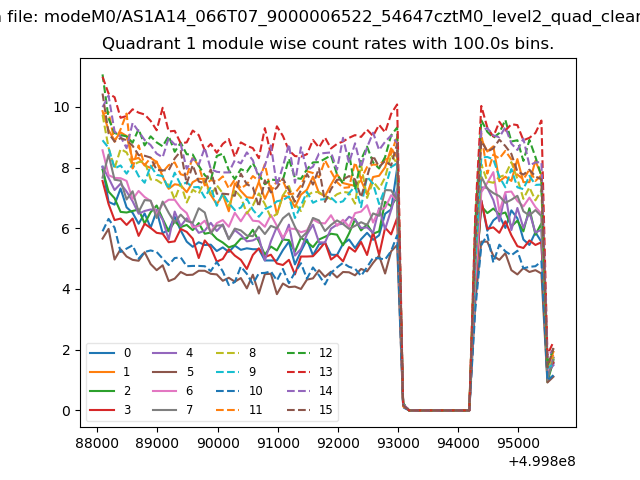
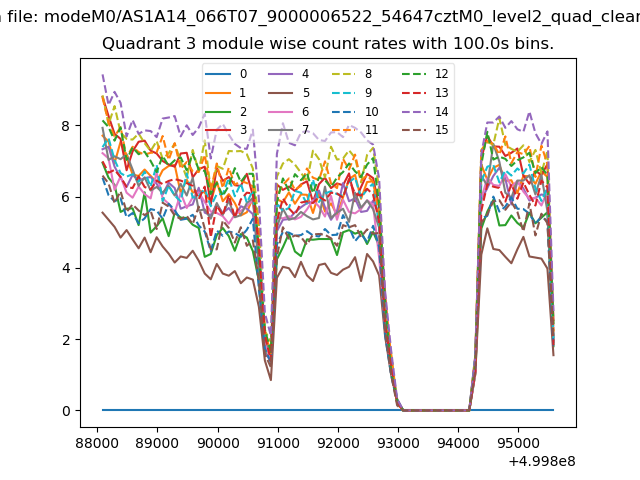
| Module-wise count rates for Quadrant A Data is divided into 100 sec bins |
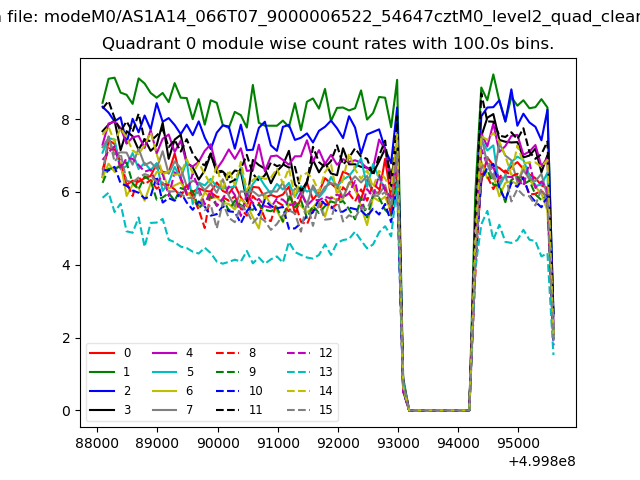 |
 |
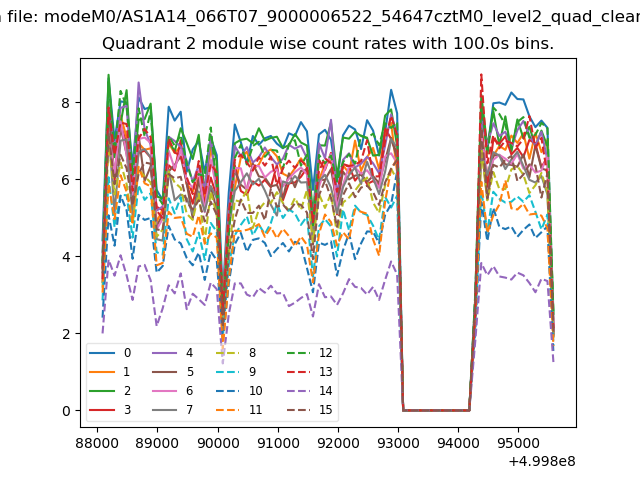
| Module-wise count rates for Quadrant B Data is divided into 100 sec bins |
 |
 |
| Module-wise count rates for Quadrant C Data is divided into 100 sec bins |
 |
 |
| Module-wise count rates for Quadrant D Data is divided into 100 sec bins |
 |
 |
| Parameter | Plot |
|---|---|
| CZT HV Monitor | 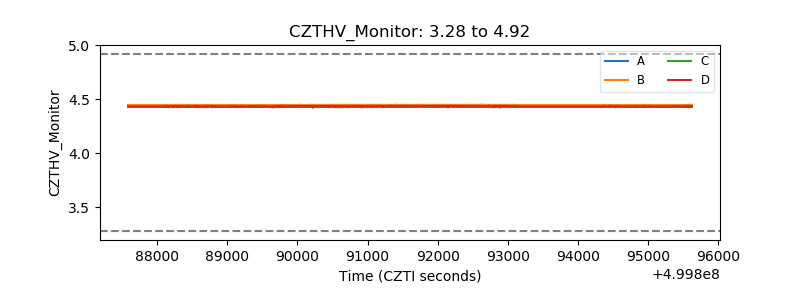 |
| D_VDD | 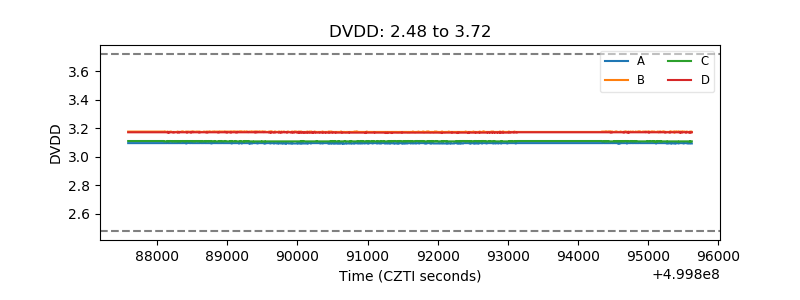 |
| Temperature 1 | 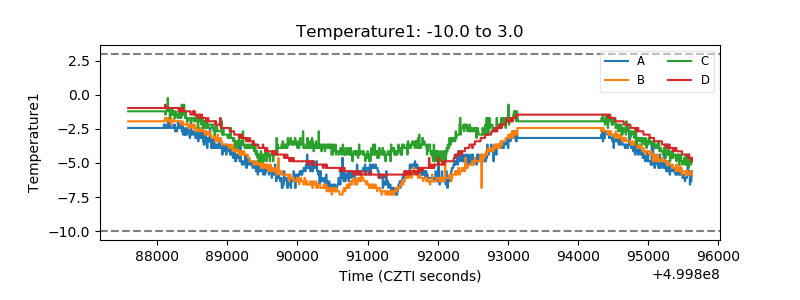 |
| Veto HV Monitor | 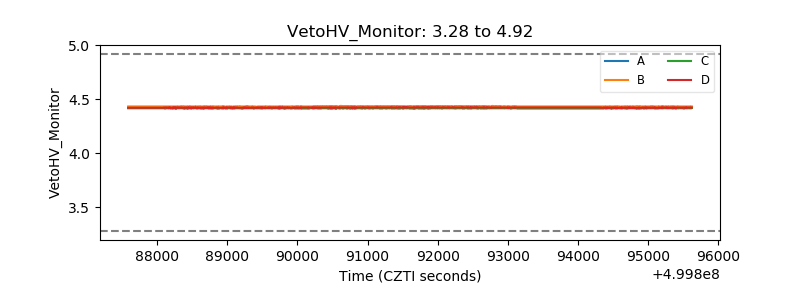 |
| Veto LLD | 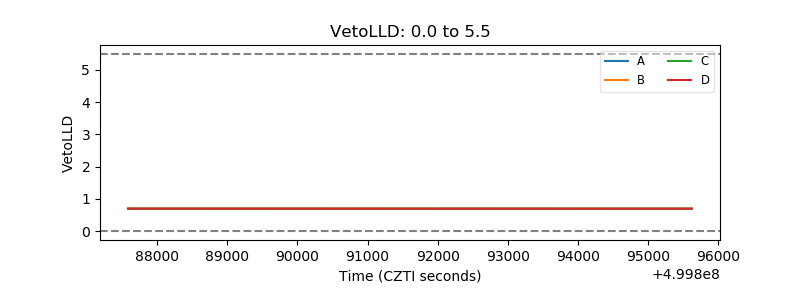 |
| Alpha Counter | 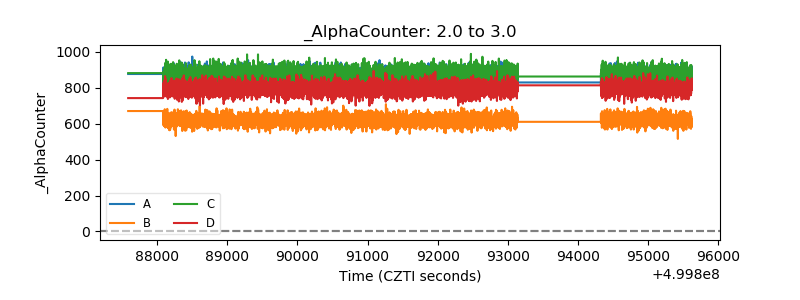 |
| _CPM_Rate | 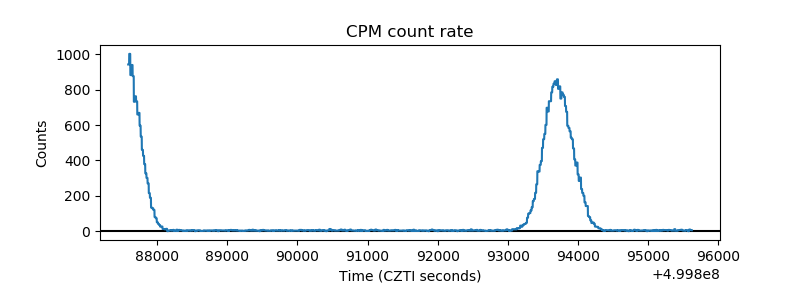 |
| CZT Counter |  |
| +2.5 Volts monitor | 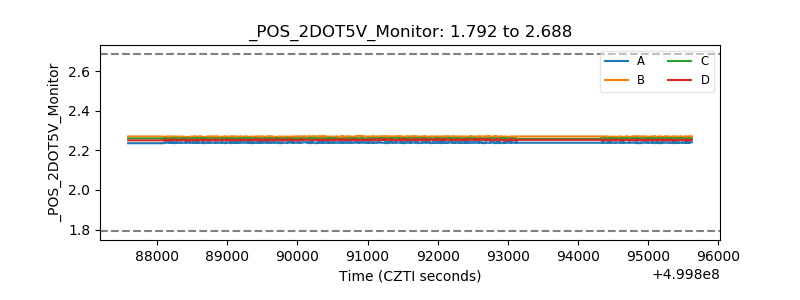 |
| +5 Volts monitor | 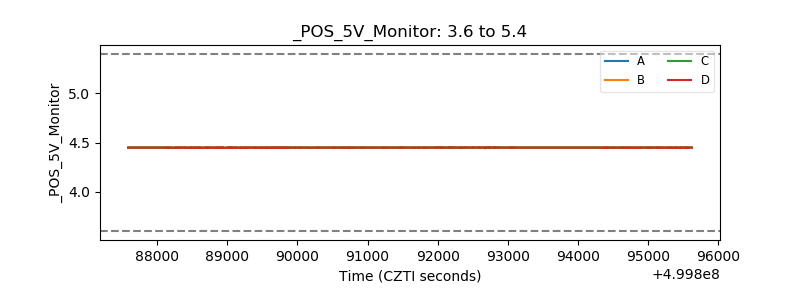 |
| _ROLL_ROT | 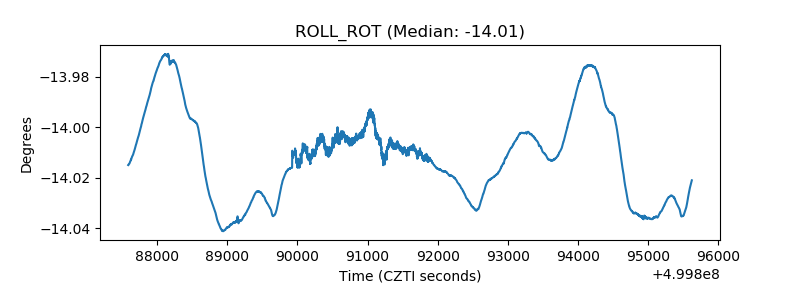 |
| _Roll_DEC | 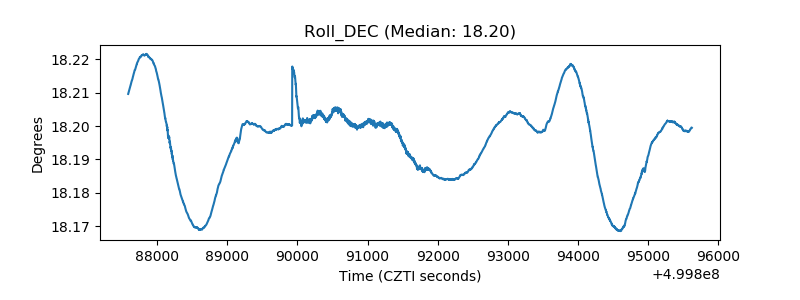 |
| _Roll_RA | 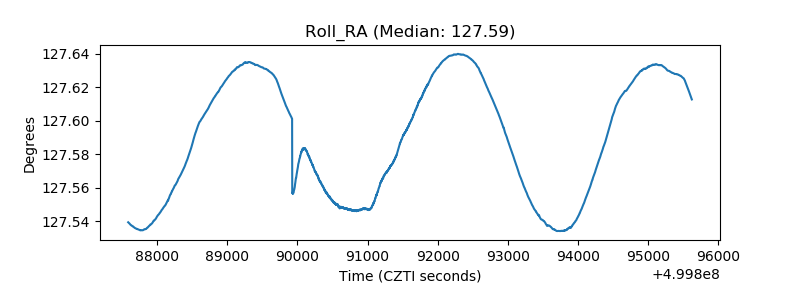 |
| Veto Counter | 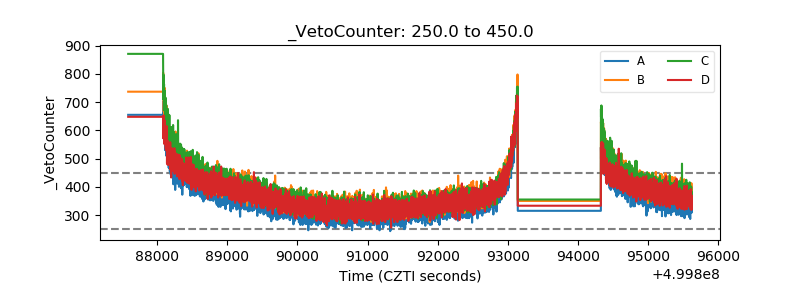 |