| Param | Original file | Final file |
|---|---|---|
| Filename | modeM0/AS1A14_066T07_9000006522_54648cztM0_level2.fits | modeM0/AS1A14_066T07_9000006522_54648cztM0_level2_quad_clean.evt |
| Size (bytes) | 466,686,720 | 95,696,640 |
| Size | 445.1 MB | 91.3 MB |
| Events in quadrant A | 3,144,732 | 646,549 |
| Events in quadrant B | 3,576,603 | 673,179 |
| Events in quadrant C | 4,048,567 | 597,341 |
| Events in quadrant D | 6,005,064 | 531,730 |
| Mode M9 | |||
|---|---|---|---|
| Quadrant | BADHDUFLAG | Total packets | Discarded packets |
| A | 0 | 11 | 0 |
| B | 0 | 12 | 0 |
| C | 0 | 12 | 0 |
| D | 0 | 12 | 0 |
| Mode M0 | |||
|---|---|---|---|
| Quadrant | BADHDUFLAG | Total packets | Discarded packets |
| A | 0 | 13936 | 2 |
| B | 0 | 15224 | 2 |
| C | 0 | 16659 | 2 |
| D | 0 | 22194 | 2 |
| Mode SS | |||
|---|---|---|---|
| Quadrant | BADHDUFLAG | Total packets | Discarded packets |
| A | 0 | 130 | 0 |
| B | 0 | 130 | 0 |
| C | 0 | 130 | 0 |
| D | 0 | 130 | 0 |
| Quadrant | Total seconds | Saturated seconds | Saturation percentage |
|---|---|---|---|
| A | 6437 | 85 | 1.320491% |
| B | 6437 | 286 | 4.443064% |
| C | 6437 | 287 | 4.458599% |
| D | 6437 | 735 | 11.418363% |
Noise dominated data is calculated using 1-second bins in cleaned event files. If a bin has >2000 counts, and if more than 50% of those come from <1% of pixels, then it is considered to be noise-dominated and hence unusable.
| Quadrant | # 1 sec bins | Bins with >0 counts | Bins with >2000 counts | High rate bins dominated by noise | Noise dominated (total time) | Noise dominated (detector-on time) | Marked lightcurve |
|---|---|---|---|---|---|---|---|
| A | 7557 | 6438 | 14 | 14 | 0.19% | 0.22% | 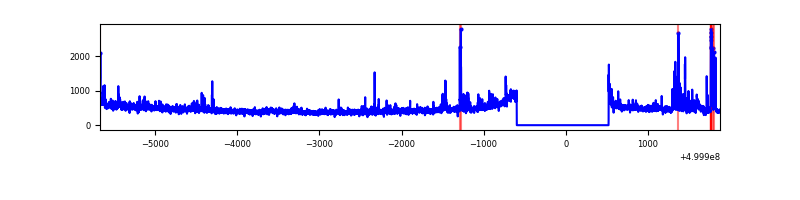 |
| B | 7557 | 6438 | 116 | 116 | 1.54% | 1.80% | 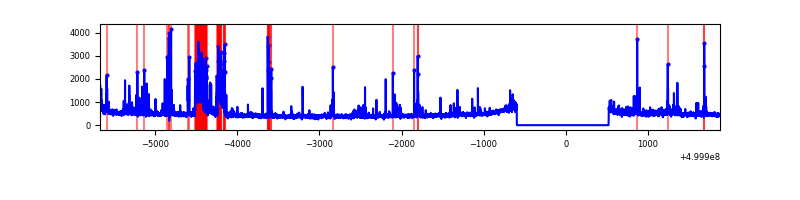 |
| C | 7557 | 6438 | 153 | 153 | 2.02% | 2.38% | 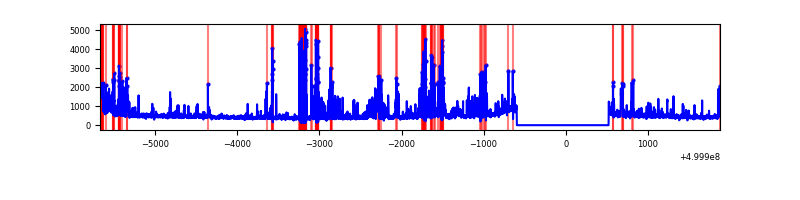 |
| D | 7557 | 6438 | 649 | 649 | 8.59% | 10.08% | 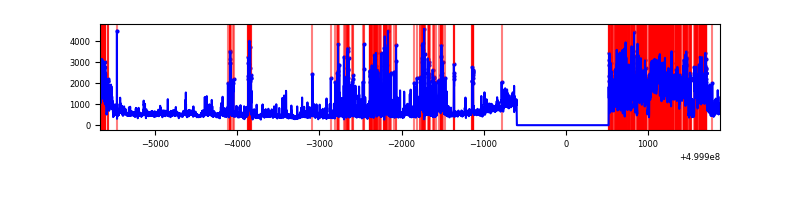 |
Top three noisy pixels from each quadrant. If the there are fewer than three noisy pixels in the level2.evt file, extra rows are filled as -1
| Pixel properties | Quadrant properties | ||||||
|---|---|---|---|---|---|---|---|
| Quadrant | DetID | PixID | Counts | Sigma | Mean | Median | Sigma |
| A | 7 | 190 | 180341 | 988.59 | 729 | 711 | 181.7 |
| A | 3 | 14 | 30608 | 164.54 | 729 | 711 | 181.7 |
| A | 11 | 3 | 29215 | 156.87 | 729 | 711 | 181.7 |
| B | 12 | 0 | 391950 | 2565.67 | 714 | 689 | 152.5 |
| B | 10 | 247 | 221668 | 1449.05 | 714 | 689 | 152.5 |
| B | 5 | 172 | 55181 | 357.32 | 714 | 689 | 152.5 |
| C | 4 | 5 | 612875 | 3179.42 | 701 | 695 | 192.5 |
| C | 9 | 38 | 192210 | 994.65 | 701 | 695 | 192.5 |
| C | 6 | 223 | 184489 | 954.55 | 701 | 695 | 192.5 |
| D | 2 | 62 | 1805237 | 9181.98 | 682 | 651 | 196.5 |
| D | 2 | 172 | 574565 | 2920.15 | 682 | 651 | 196.5 |
| D | 6 | 239 | 501528 | 2548.53 | 682 | 651 | 196.5 |
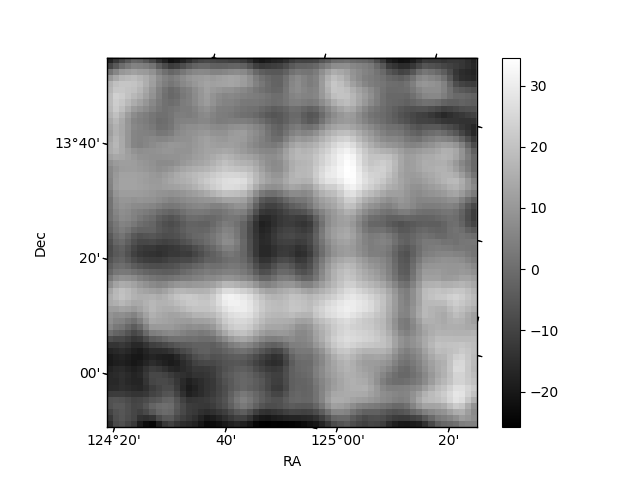
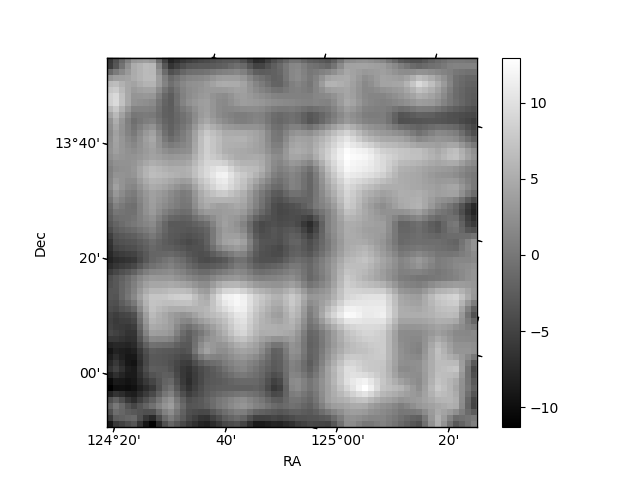
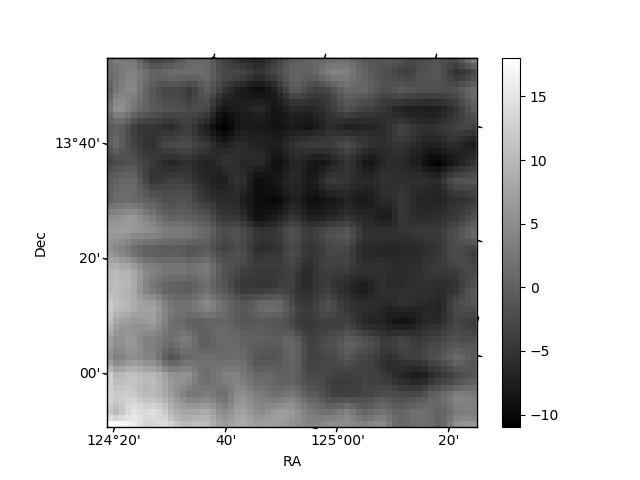
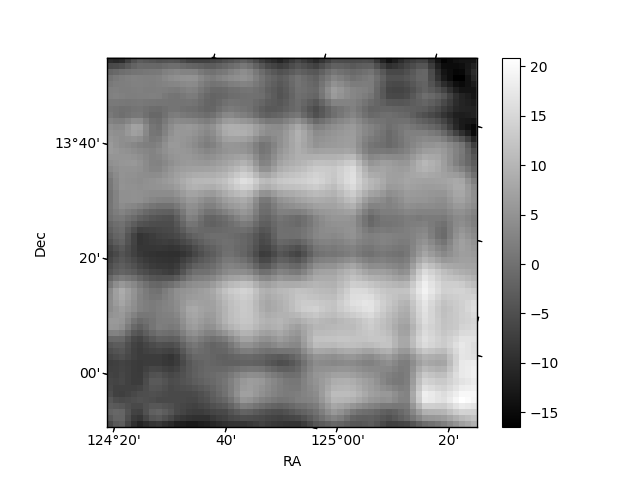
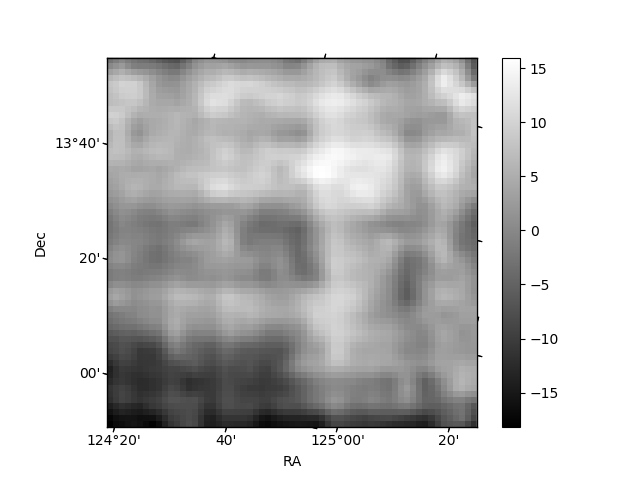
Histogram calculated using DETX and DETY for each event in the final _common_clean file
| Quadrant A | 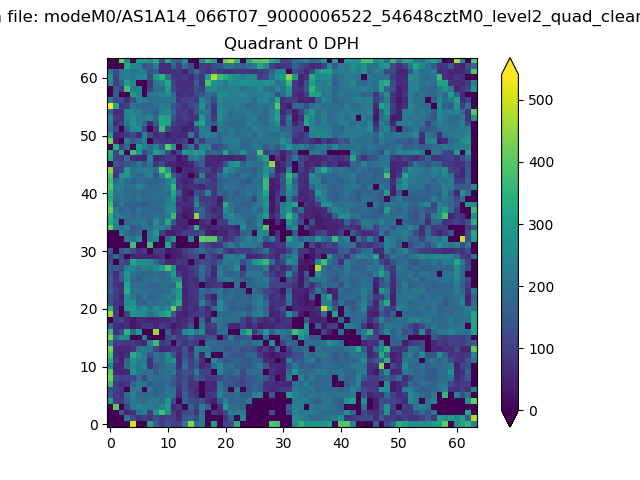 |
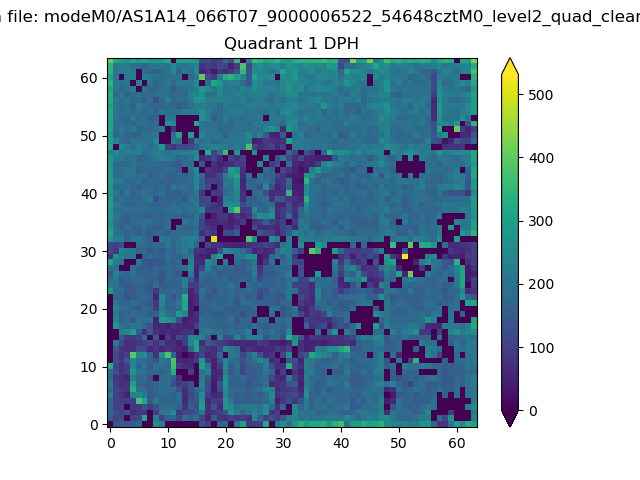 |
Quadrant B |
|---|---|---|---|
| Quadrant D | 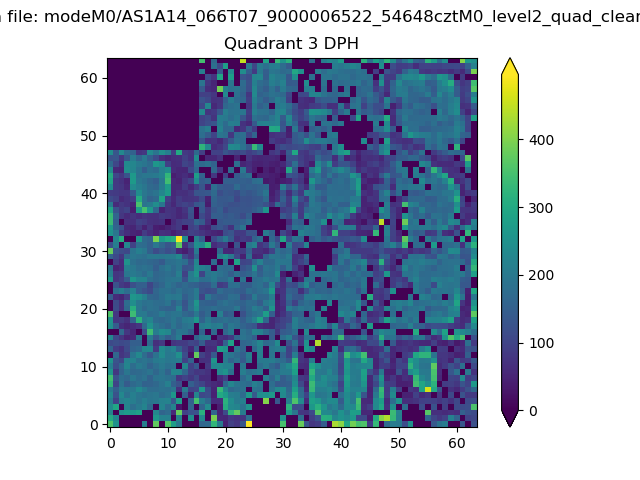 |
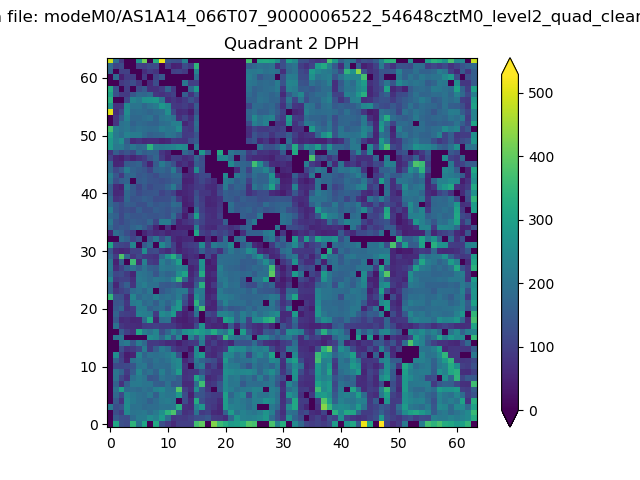 |
Quadrant C |
| Plot type | Count rate plots | Images |
|---|---|---|
| Comparison with Poisson distribution Blue bars denote a histogram of data divided into 1 sec bins. Red curve is a Poisson curve with rate = median count rate of data. |
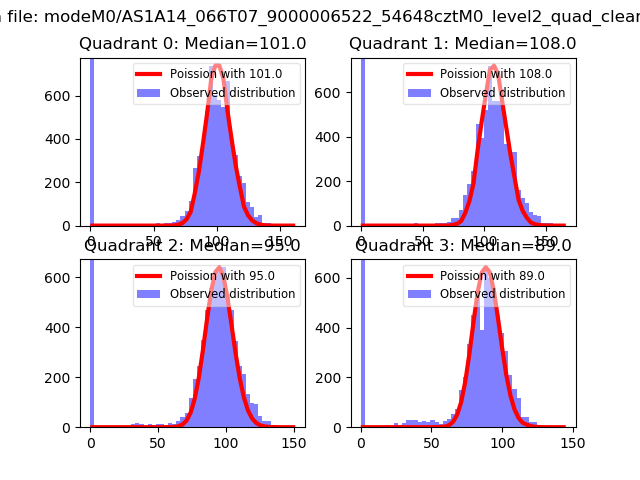 |
 |
| Quadrant-wise count rates Data is divided into 100 sec bins |
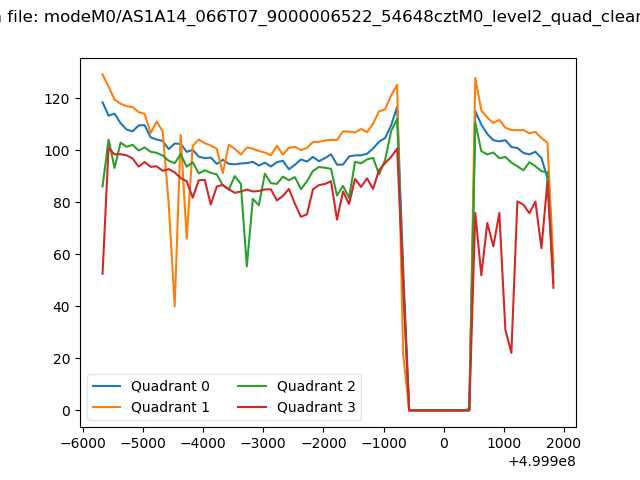 |
|
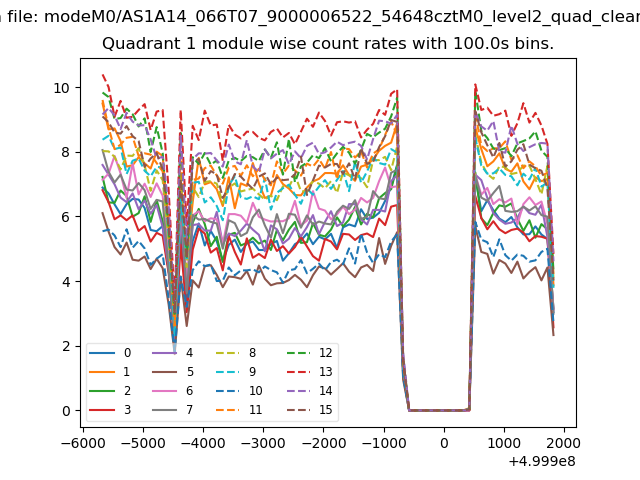
| Module-wise count rates for Quadrant A Data is divided into 100 sec bins |
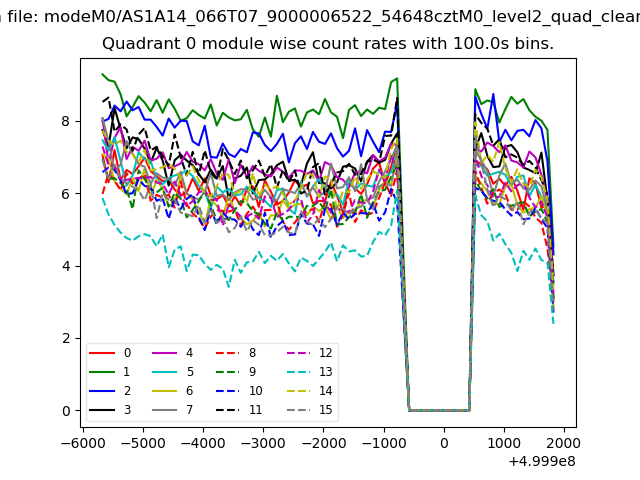 |
 |
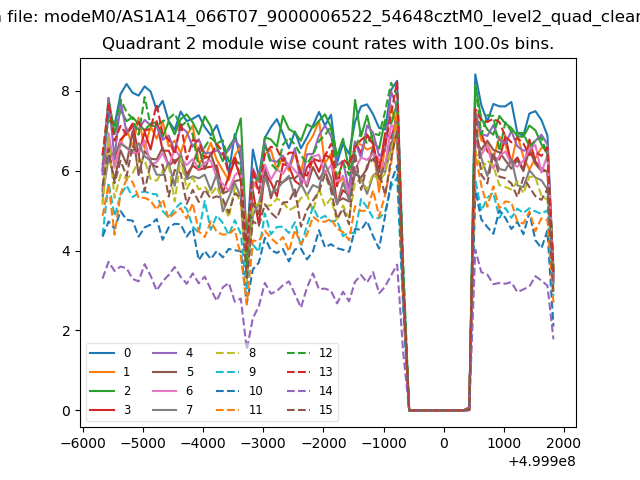
| Module-wise count rates for Quadrant B Data is divided into 100 sec bins |
 |
 |
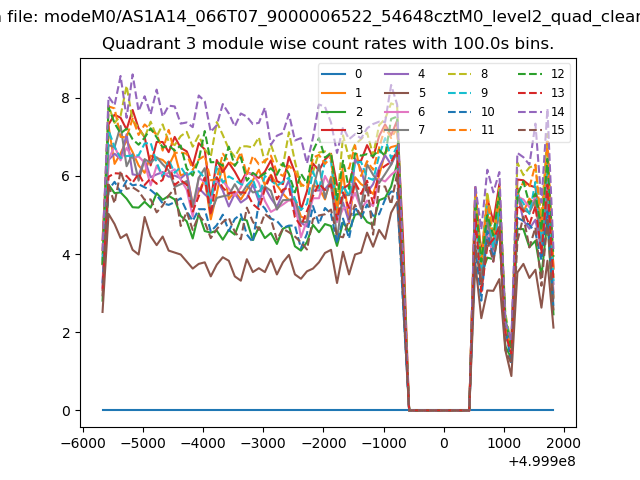
| Module-wise count rates for Quadrant C Data is divided into 100 sec bins |
 |
 |
| Module-wise count rates for Quadrant D Data is divided into 100 sec bins |
 |
 |
| Parameter | Plot |
|---|---|
| CZT HV Monitor | 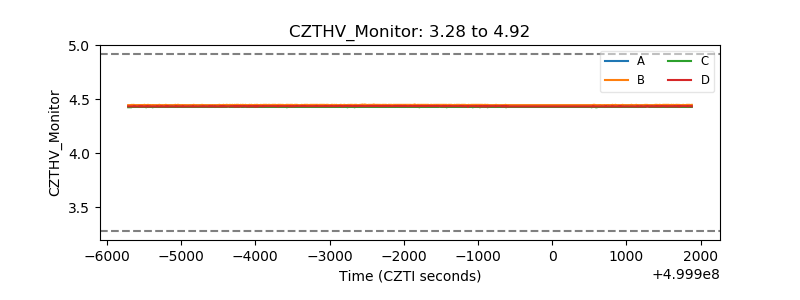 |
| D_VDD | 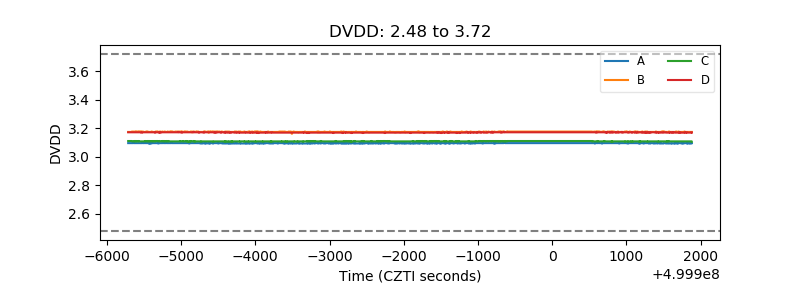 |
| Temperature 1 | 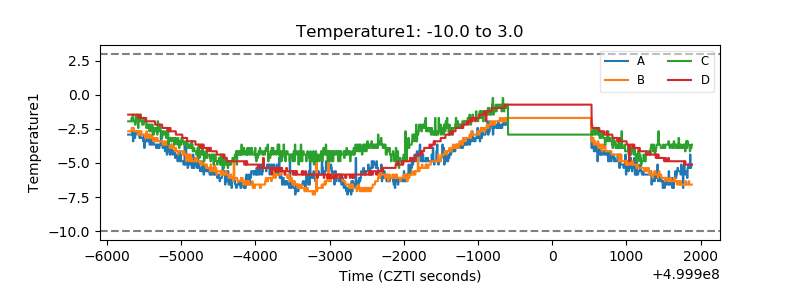 |
| Veto HV Monitor | 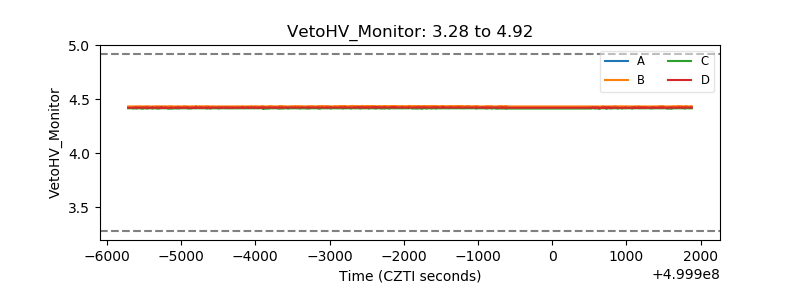 |
| Veto LLD | 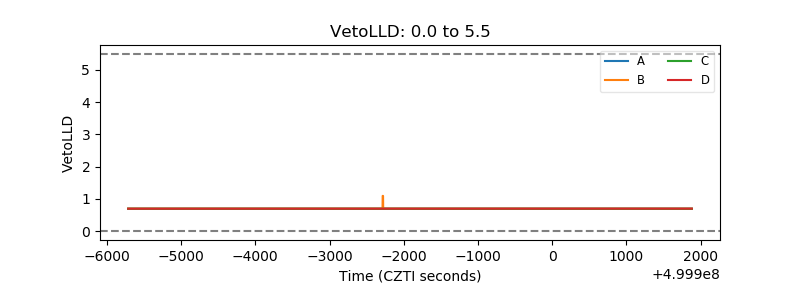 |
| Alpha Counter | 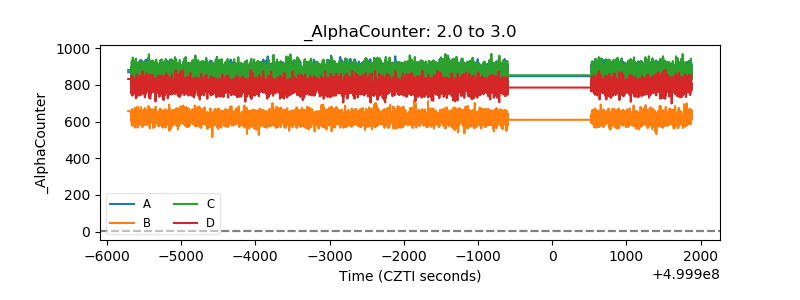 |
| _CPM_Rate | 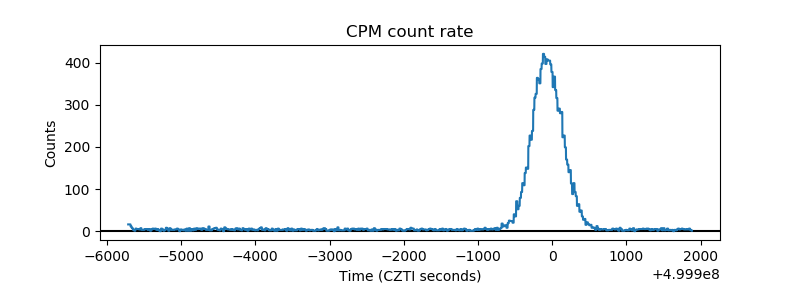 |
| CZT Counter | 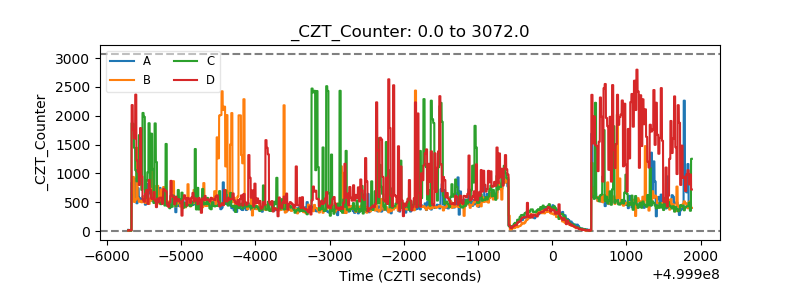 |
| +2.5 Volts monitor |  |
| +5 Volts monitor | 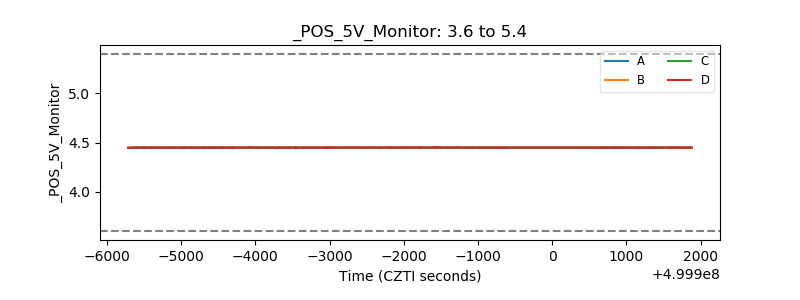 |
| _ROLL_ROT | 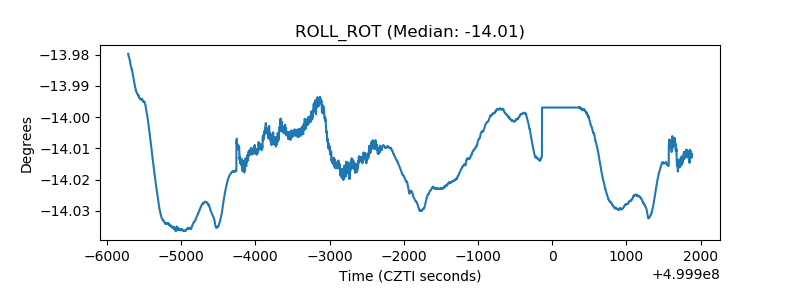 |
| _Roll_DEC | 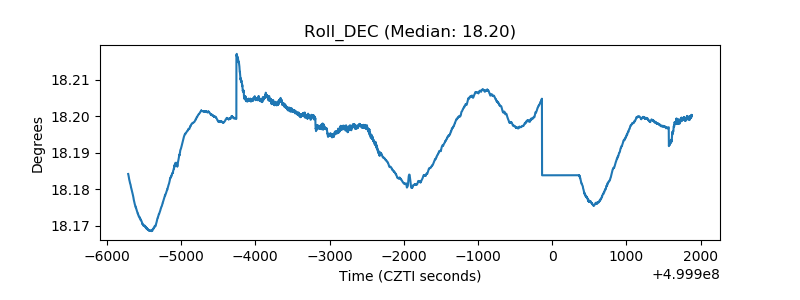 |
| _Roll_RA | 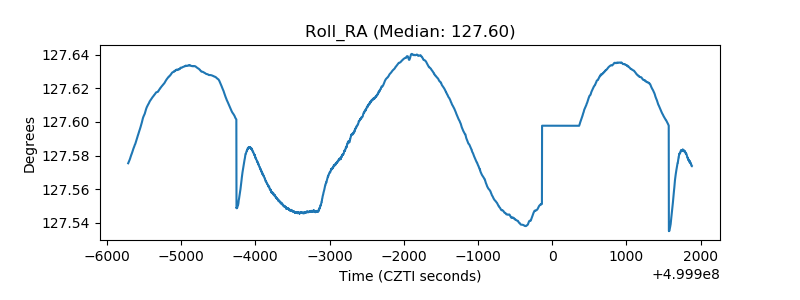 |
| Veto Counter | 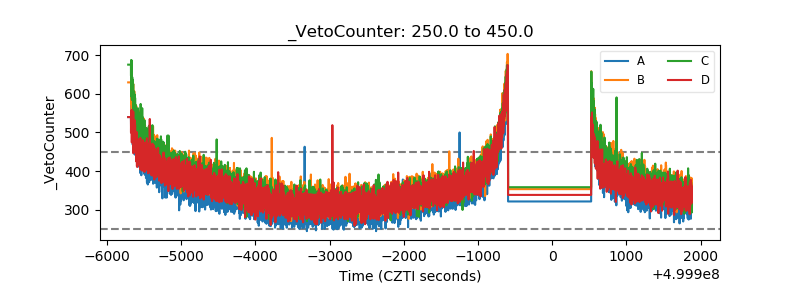 |