| Param | Original file | Final file |
|---|---|---|
| Filename | modeM0/AS1A14_066T07_9000006522_54650cztM0_level2.fits | modeM0/AS1A14_066T07_9000006522_54650cztM0_level2_quad_clean.evt |
| Size (bytes) | 595,765,440 | 100,984,320 |
| Size | 568.2 MB | 96.3 MB |
| Events in quadrant A | 4,168,447 | 680,778 |
| Events in quadrant B | 3,776,606 | 729,703 |
| Events in quadrant C | 4,649,318 | 638,704 |
| Events in quadrant D | 8,898,108 | 505,489 |
| Mode M9 | |||
|---|---|---|---|
| Quadrant | BADHDUFLAG | Total packets | Discarded packets |
| A | 0 | 6 | 0 |
| B | 0 | 6 | 0 |
| C | 0 | 7 | 0 |
| D | 0 | 7 | 0 |
| Mode M0 | |||
|---|---|---|---|
| Quadrant | BADHDUFLAG | Total packets | Discarded packets |
| A | 0 | 17730 | 2 |
| B | 0 | 16644 | 2 |
| C | 0 | 18948 | 4 |
| D | 0 | 31375 | 5 |
| Mode SS | |||
|---|---|---|---|
| Quadrant | BADHDUFLAG | Total packets | Discarded packets |
| A | 0 | 146 | 0 |
| B | 0 | 146 | 0 |
| C | 0 | 146 | 0 |
| D | 0 | 146 | 0 |
| Quadrant | Total seconds | Saturated seconds | Saturation percentage |
|---|---|---|---|
| A | 7223 | 315 | 4.361069% |
| B | 7223 | 268 | 3.710370% |
| C | 7222 | 331 | 4.583218% |
| D | 7220 | 1648 | 22.825485% |
Noise dominated data is calculated using 1-second bins in cleaned event files. If a bin has >2000 counts, and if more than 50% of those come from <1% of pixels, then it is considered to be noise-dominated and hence unusable.
| Quadrant | # 1 sec bins | Bins with >0 counts | Bins with >2000 counts | High rate bins dominated by noise | Noise dominated (total time) | Noise dominated (detector-on time) | Marked lightcurve |
|---|---|---|---|---|---|---|---|
| A | 7648 | 7224 | 196 | 196 | 2.56% | 2.71% | 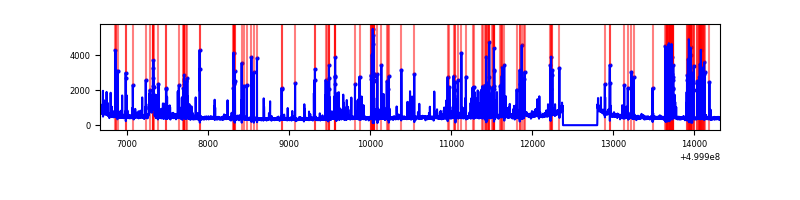 |
| B | 7648 | 7224 | 119 | 119 | 1.56% | 1.65% | 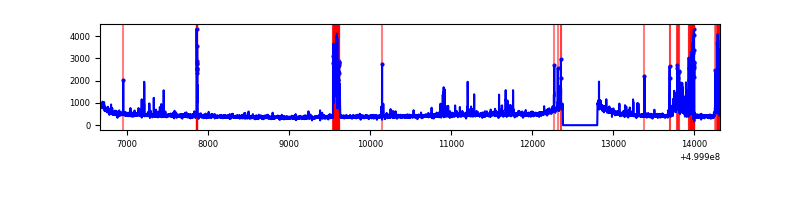 |
| C | 7647 | 7223 | 218 | 218 | 2.85% | 3.02% | 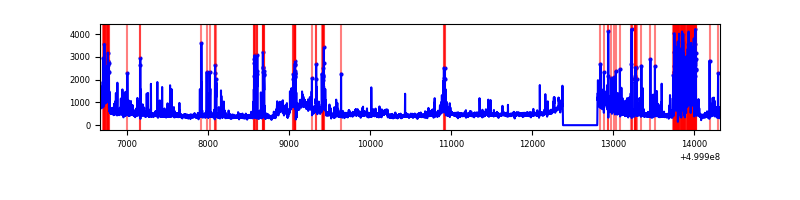 |
| D | 7647 | 7222 | 1240 | 1240 | 16.22% | 17.17% | 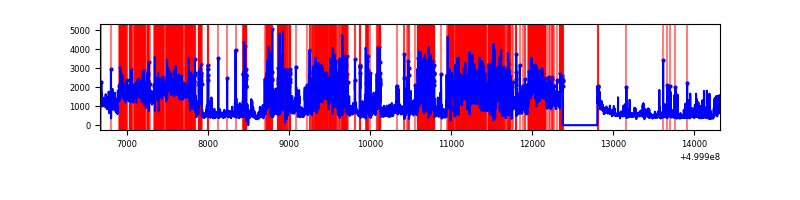 |
Top three noisy pixels from each quadrant. If the there are fewer than three noisy pixels in the level2.evt file, extra rows are filled as -1
| Pixel properties | Quadrant properties | ||||||
|---|---|---|---|---|---|---|---|
| Quadrant | DetID | PixID | Counts | Sigma | Mean | Median | Sigma |
| A | 11 | 3 | 794776 | 4067.2 | 790 | 770 | 195.2 |
| A | 7 | 190 | 154072 | 785.27 | 790 | 770 | 195.2 |
| A | 0 | 8 | 82736 | 419.86 | 790 | 770 | 195.2 |
| B | 2 | 249 | 487829 | 2832.81 | 789 | 759 | 171.9 |
| B | 10 | 247 | 109547 | 632.71 | 789 | 759 | 171.9 |
| B | 1 | 207 | 22341 | 125.52 | 789 | 759 | 171.9 |
| C | 6 | 223 | 705985 | 3321.02 | 765 | 758 | 212.4 |
| C | 9 | 38 | 355915 | 1672.49 | 765 | 758 | 212.4 |
| C | 13 | 3 | 244138 | 1146.11 | 765 | 758 | 212.4 |
| D | 2 | 62 | 3819770 | 18703.37 | 717 | 685 | 204.2 |
| D | 6 | 239 | 1073132 | 5252.14 | 717 | 685 | 204.2 |
| D | 15 | 94 | 460656 | 2252.64 | 717 | 685 | 204.2 |
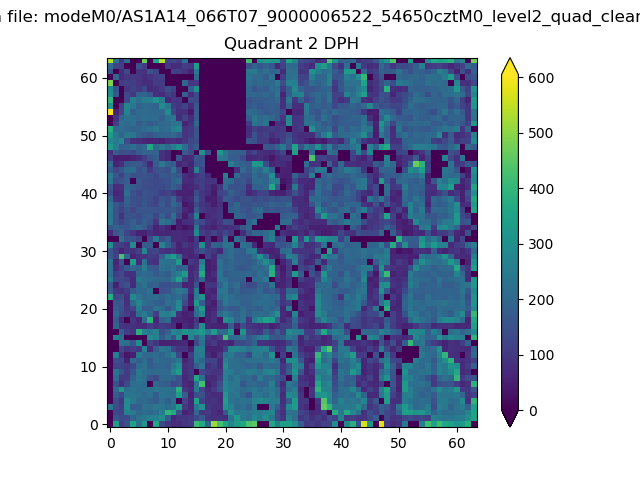
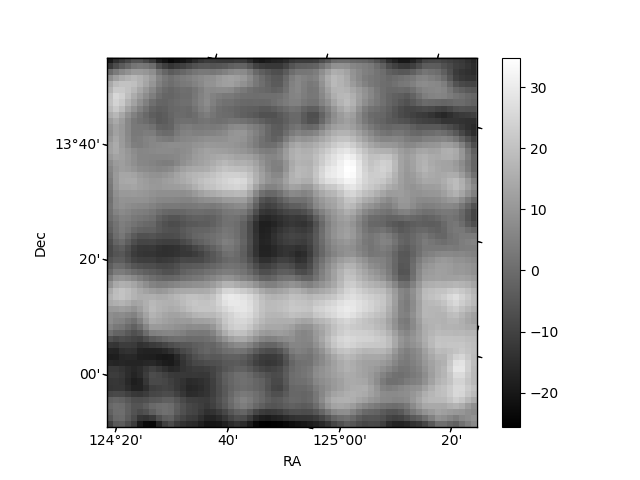
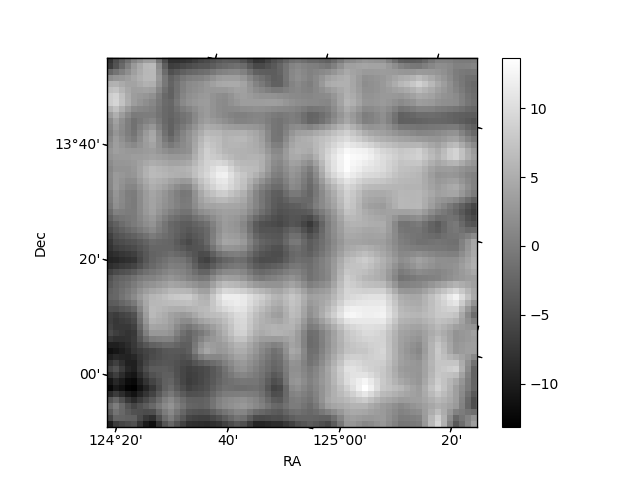
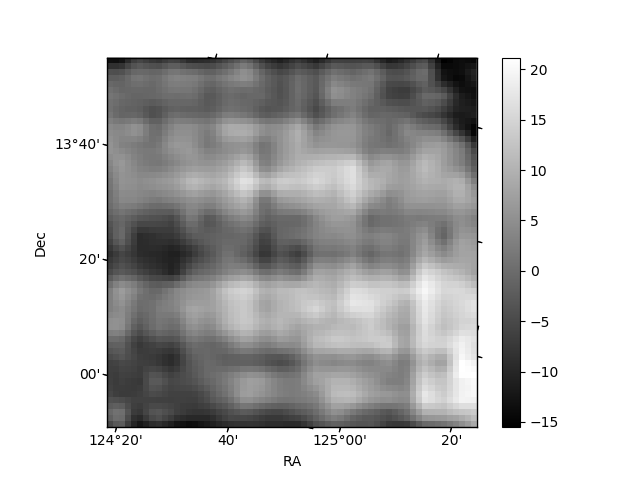
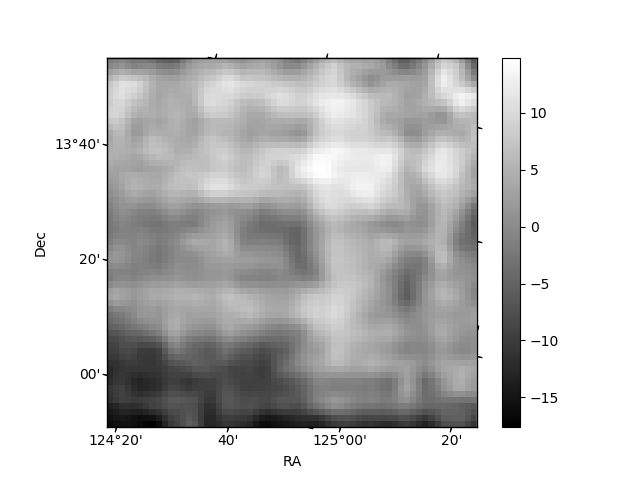
Histogram calculated using DETX and DETY for each event in the final _common_clean file
| Quadrant A | 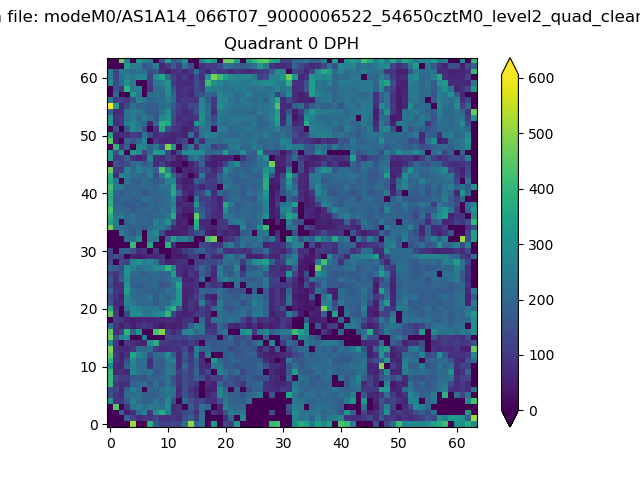 |
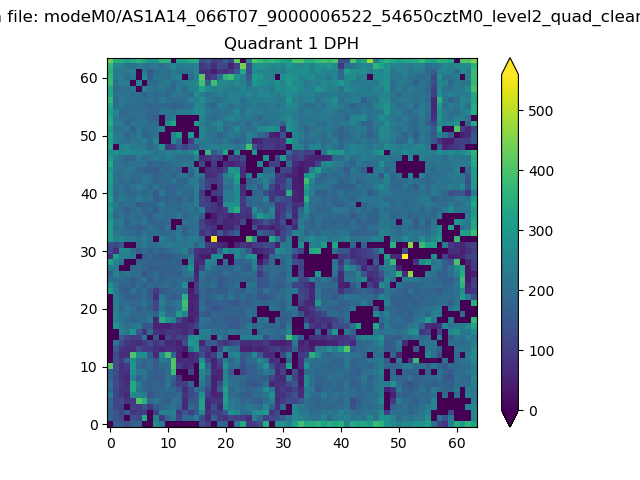 |
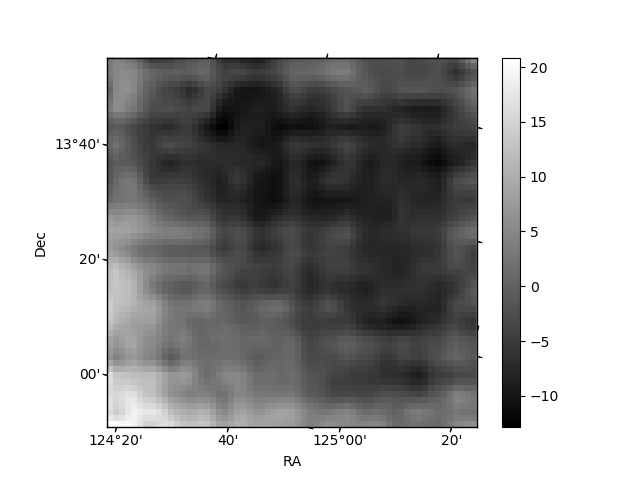
Quadrant B |
|---|---|---|---|
| Quadrant D | 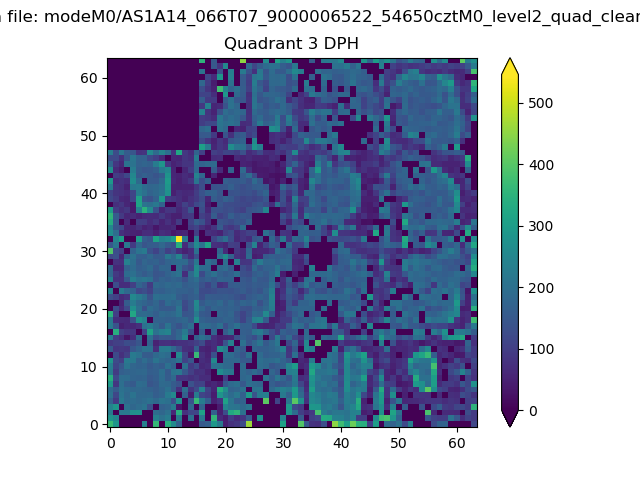 |
 |
Quadrant C |
| Plot type | Count rate plots | Images |
|---|---|---|
| Comparison with Poisson distribution Blue bars denote a histogram of data divided into 1 sec bins. Red curve is a Poisson curve with rate = median count rate of data. |
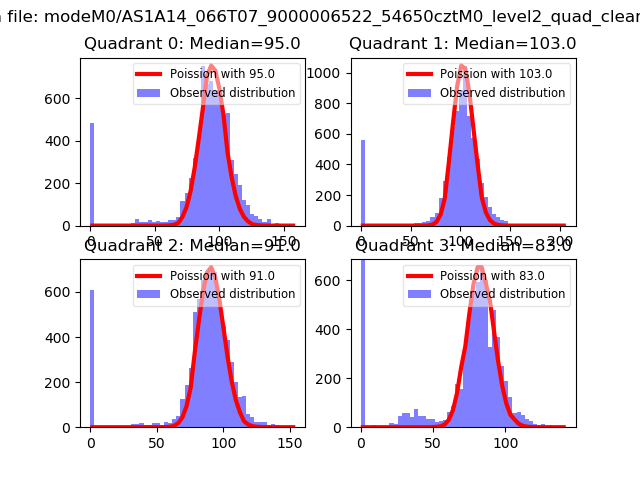 |
 |
| Quadrant-wise count rates Data is divided into 100 sec bins |
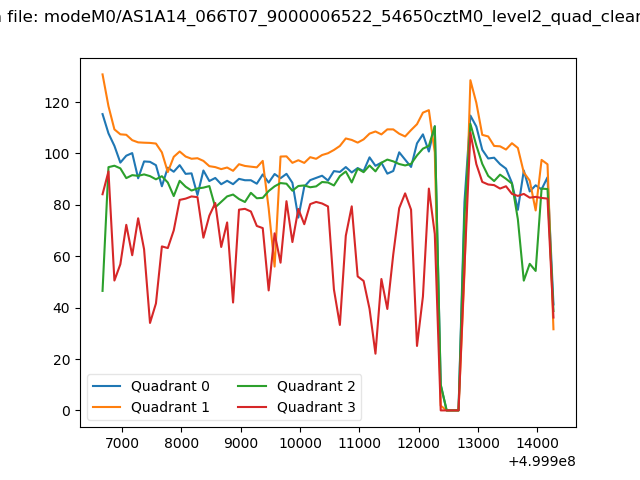 |
|
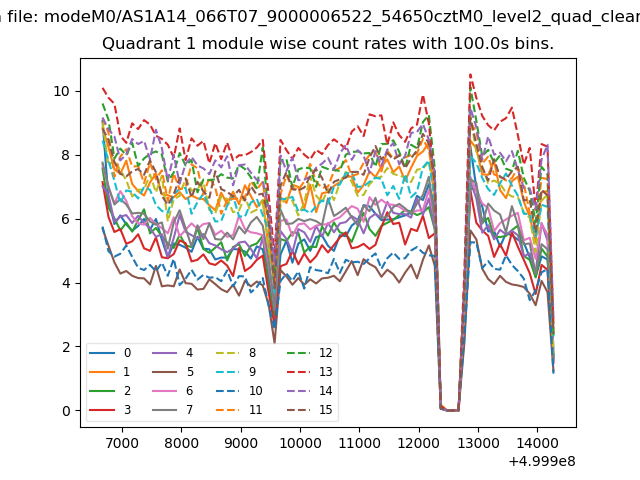
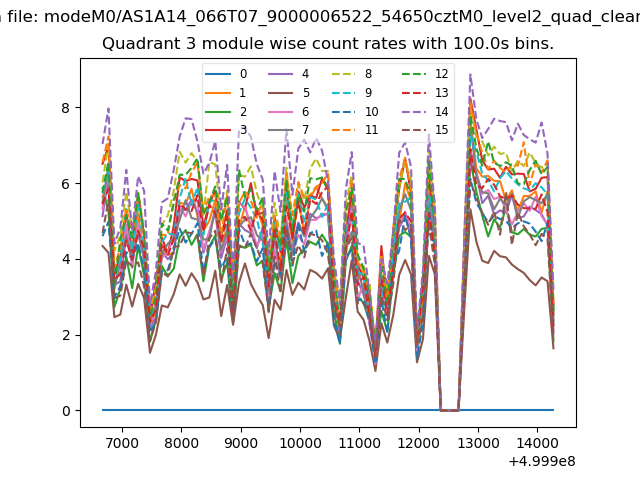
| Module-wise count rates for Quadrant A Data is divided into 100 sec bins |
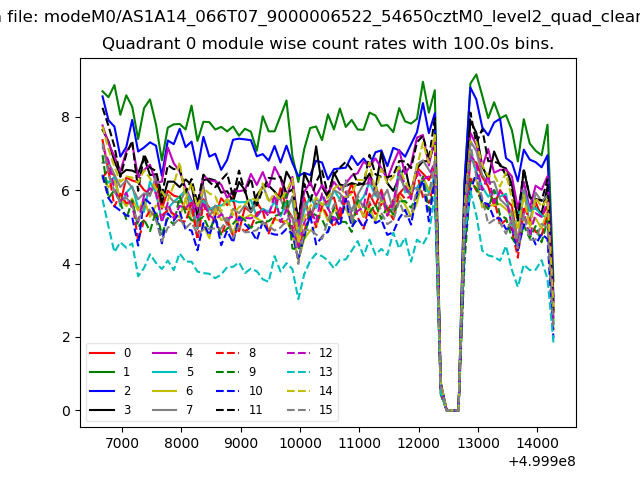 |
 |
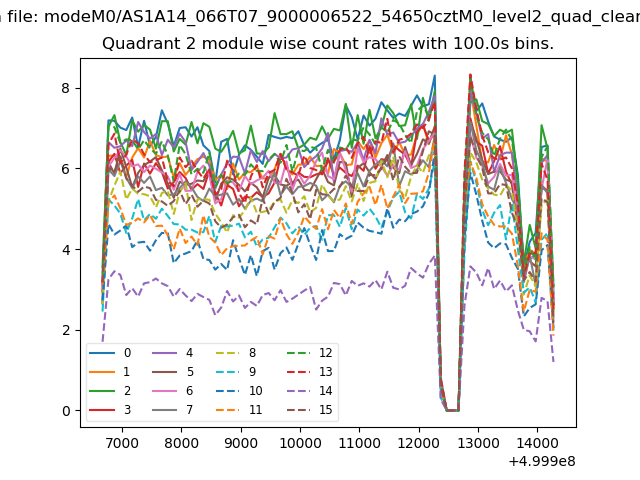
| Module-wise count rates for Quadrant B Data is divided into 100 sec bins |
 |
 |
| Module-wise count rates for Quadrant C Data is divided into 100 sec bins |
 |
 |
| Module-wise count rates for Quadrant D Data is divided into 100 sec bins |
 |
 |
| Parameter | Plot |
|---|---|
| CZT HV Monitor | 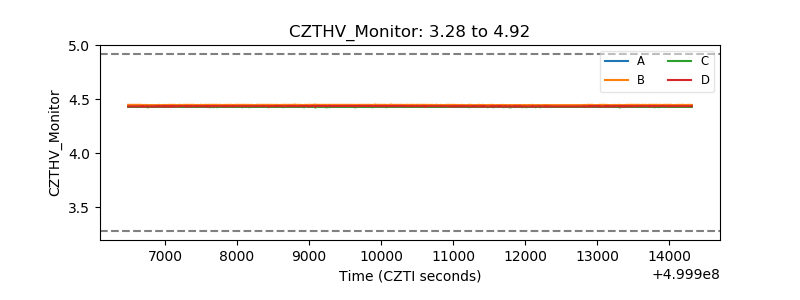 |
| D_VDD | 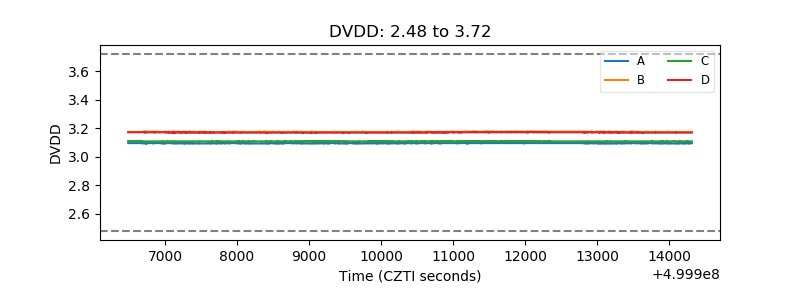 |
| Temperature 1 | 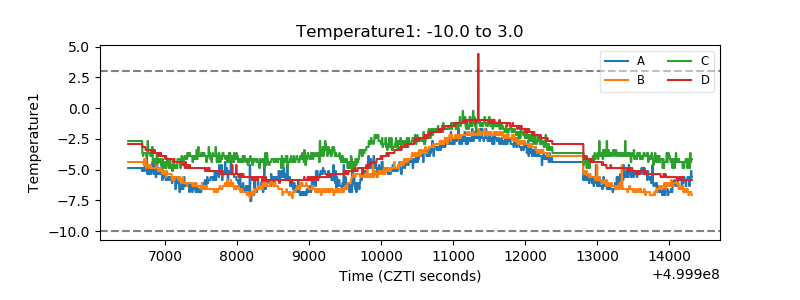 |
| Veto HV Monitor | 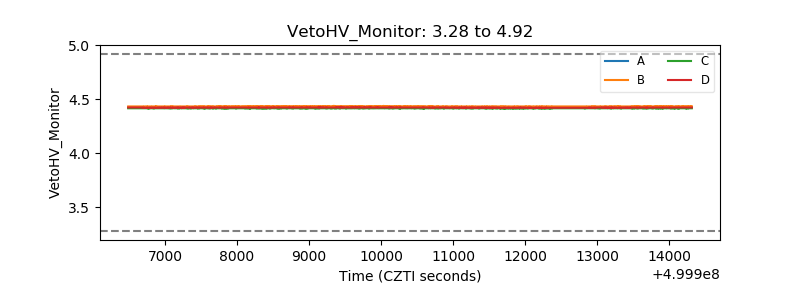 |
| Veto LLD | 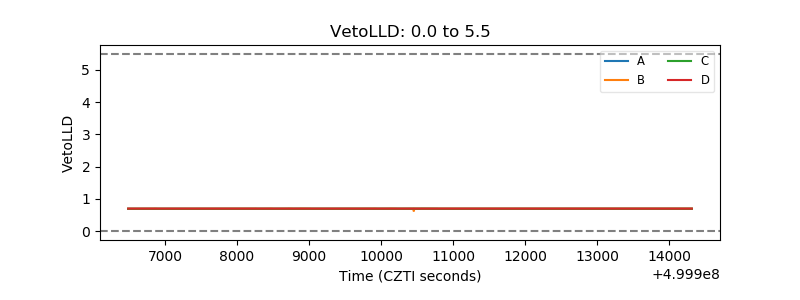 |
| Alpha Counter | 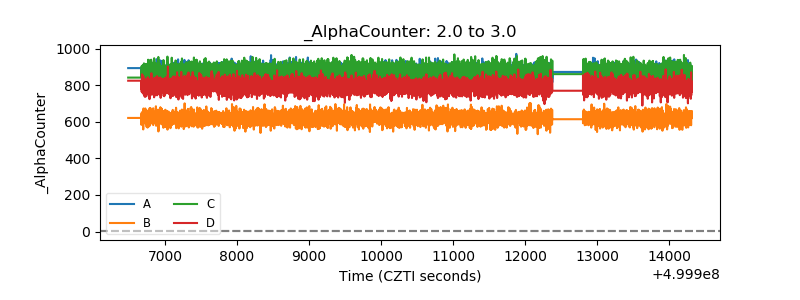 |
| _CPM_Rate | 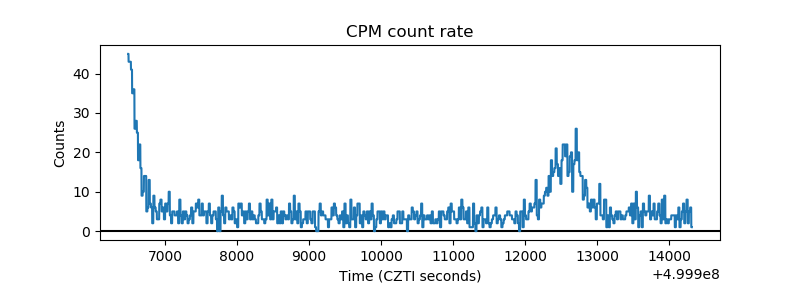 |
| CZT Counter | 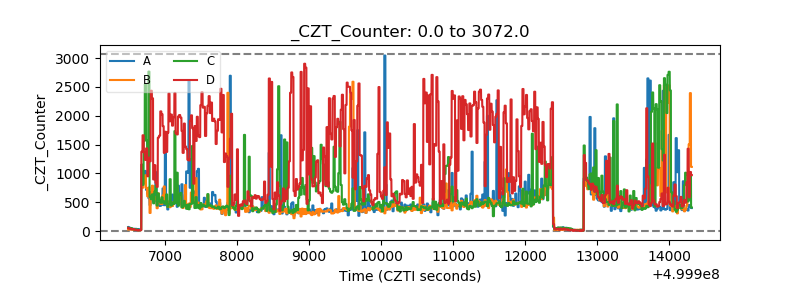 |
| +2.5 Volts monitor | 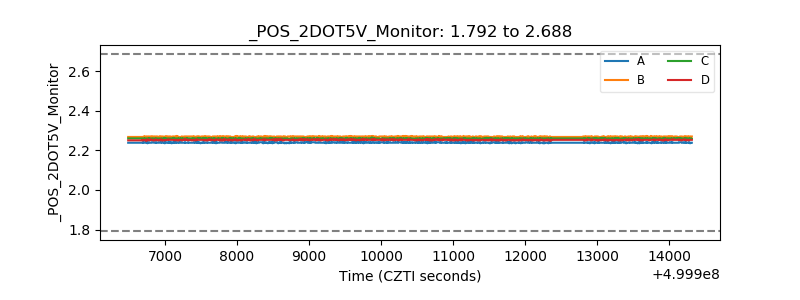 |
| +5 Volts monitor | 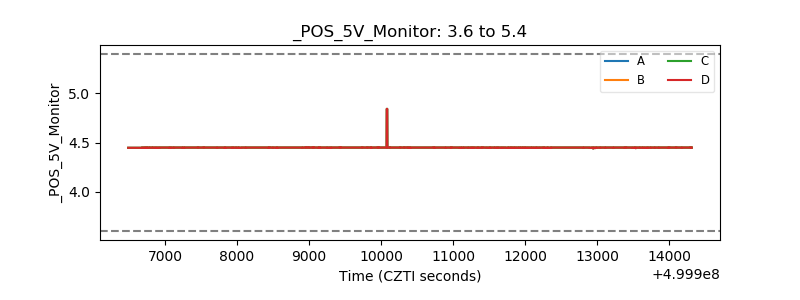 |
| _ROLL_ROT | 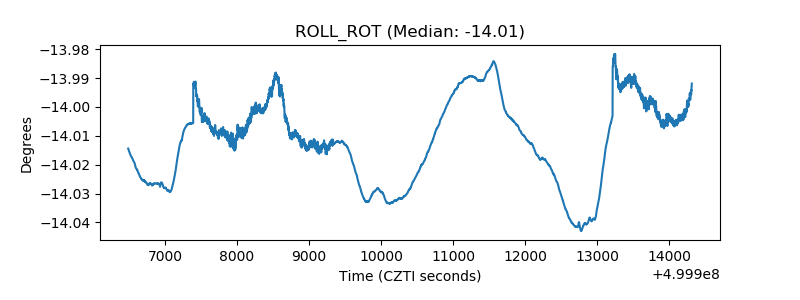 |
| _Roll_DEC | 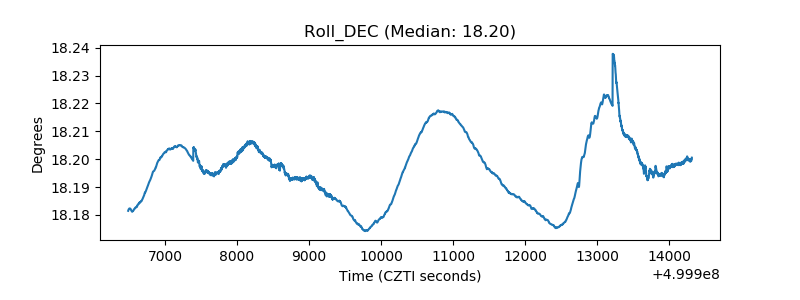 |
| _Roll_RA | 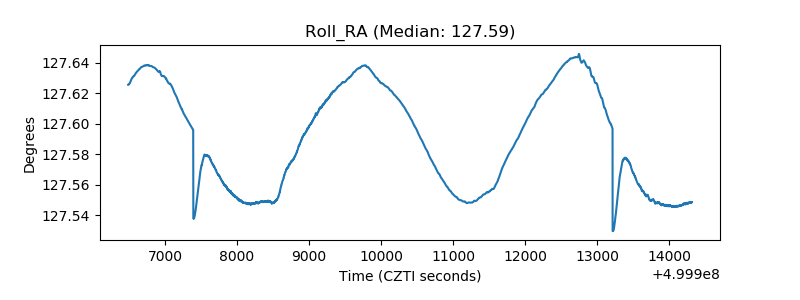 |
| Veto Counter | 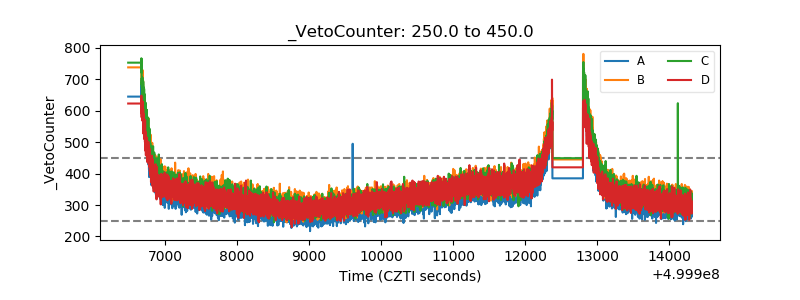 |