| Param | Original file | Final file |
|---|---|---|
| Filename | modeM0/AS1A14_066T07_9000006522_54651cztM0_level2.fits | modeM0/AS1A14_066T07_9000006522_54651cztM0_level2_quad_clean.evt |
| Size (bytes) | 610,689,600 | 120,957,120 |
| Size | 582.4 MB | 115.4 MB |
| Events in quadrant A | 4,565,846 | 804,757 |
| Events in quadrant B | 5,950,525 | 809,653 |
| Events in quadrant C | 5,508,588 | 743,495 |
| Events in quadrant D | 5,920,943 | 714,317 |
| Mode M9 | |||
|---|---|---|---|
| Quadrant | BADHDUFLAG | Total packets | Discarded packets |
| A | 0 | 5 | 0 |
| B | 0 | 5 | 0 |
| C | 0 | 5 | 0 |
| D | 0 | 5 | 0 |
| Mode M0 | |||
|---|---|---|---|
| Quadrant | BADHDUFLAG | Total packets | Discarded packets |
| A | 0 | 19920 | 1 |
| B | 0 | 23866 | 1 |
| C | 0 | 22624 | 1 |
| D | 0 | 23534 | 1 |
| Mode SS | |||
|---|---|---|---|
| Quadrant | BADHDUFLAG | Total packets | Discarded packets |
| A | 0 | 170 | 0 |
| B | 0 | 170 | 0 |
| C | 0 | 170 | 0 |
| D | 0 | 170 | 0 |
| Quadrant | Total seconds | Saturated seconds | Saturation percentage |
|---|---|---|---|
| A | 8502 | 216 | 2.540579% |
| B | 8502 | 773 | 9.091978% |
| C | 8503 | 447 | 5.256968% |
| D | 8503 | 310 | 3.645772% |
Noise dominated data is calculated using 1-second bins in cleaned event files. If a bin has >2000 counts, and if more than 50% of those come from <1% of pixels, then it is considered to be noise-dominated and hence unusable.
| Quadrant | # 1 sec bins | Bins with >0 counts | Bins with >2000 counts | High rate bins dominated by noise | Noise dominated (total time) | Noise dominated (detector-on time) | Marked lightcurve |
|---|---|---|---|---|---|---|---|
| A | 8927 | 8503 | 147 | 147 | 1.65% | 1.73% | 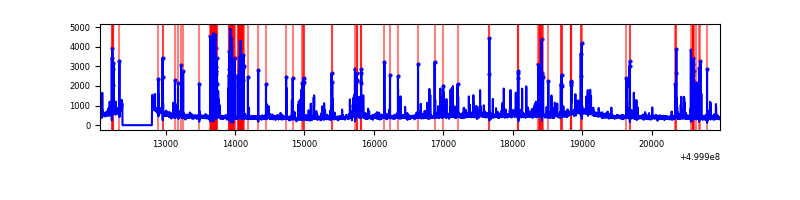 |
| B | 8927 | 8503 | 500 | 500 | 5.60% | 5.88% | 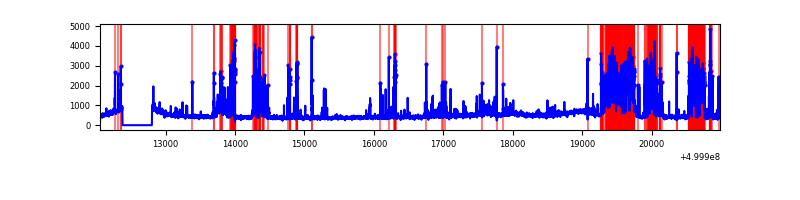 |
| C | 8928 | 8504 | 359 | 359 | 4.02% | 4.22% | 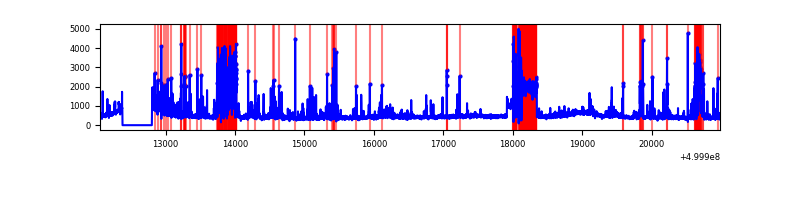 |
| D | 8928 | 8504 | 215 | 215 | 2.41% | 2.53% | 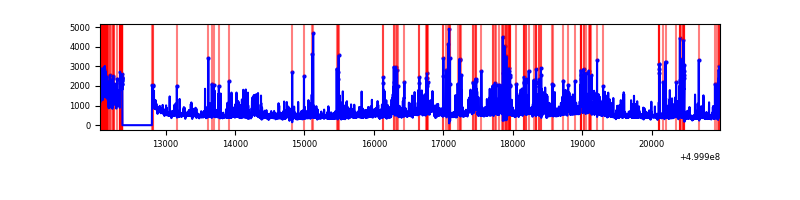 |
Top three noisy pixels from each quadrant. If the there are fewer than three noisy pixels in the level2.evt file, extra rows are filled as -1
| Pixel properties | Quadrant properties | ||||||
|---|---|---|---|---|---|---|---|
| Quadrant | DetID | PixID | Counts | Sigma | Mean | Median | Sigma |
| A | 11 | 3 | 569168 | 2441.81 | 938 | 912 | 232.7 |
| A | 0 | 8 | 189525 | 810.47 | 938 | 912 | 232.7 |
| A | 3 | 110 | 98859 | 420.88 | 938 | 912 | 232.7 |
| B | 2 | 249 | 1847326 | 9322.85 | 910 | 877 | 198.1 |
| B | 10 | 247 | 283949 | 1429.25 | 910 | 877 | 198.1 |
| B | 7 | 0 | 89661 | 448.28 | 910 | 877 | 198.1 |
| C | 9 | 38 | 510457 | 2033.8 | 905 | 896 | 250.5 |
| C | 6 | 223 | 509376 | 2029.48 | 905 | 896 | 250.5 |
| C | 13 | 3 | 403920 | 1608.58 | 905 | 896 | 250.5 |
| D | 2 | 62 | 1262786 | 4912.79 | 898 | 856 | 256.9 |
| D | 2 | 172 | 412202 | 1601.4 | 898 | 856 | 256.9 |
| D | 6 | 239 | 354203 | 1375.61 | 898 | 856 | 256.9 |
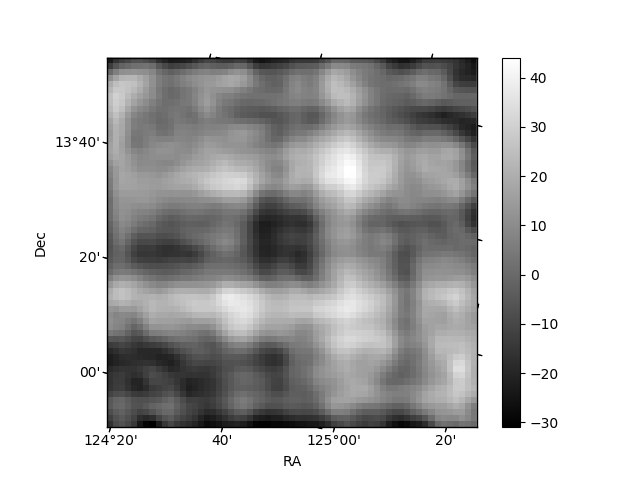
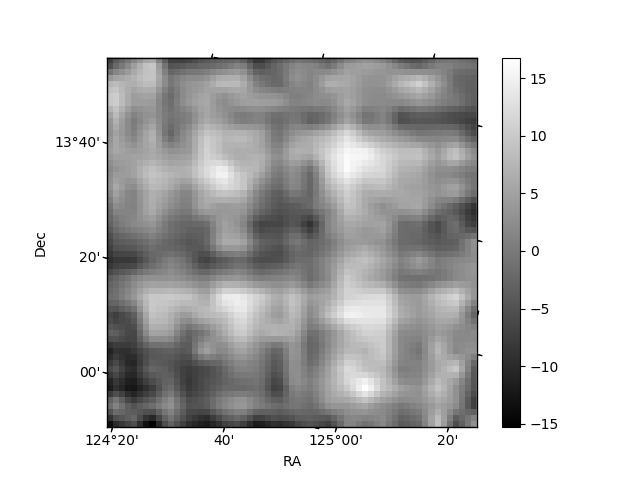
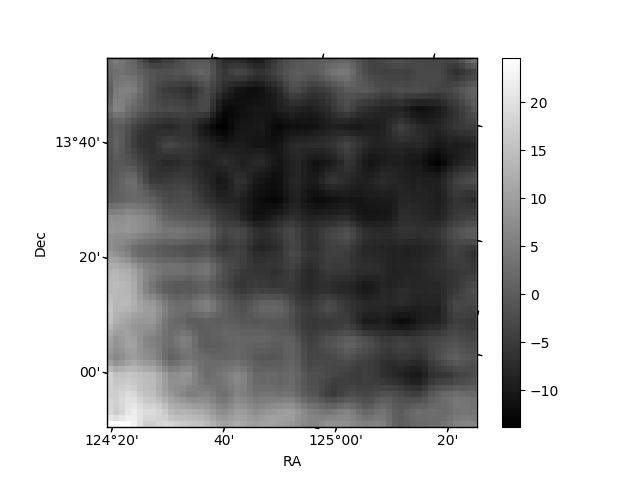
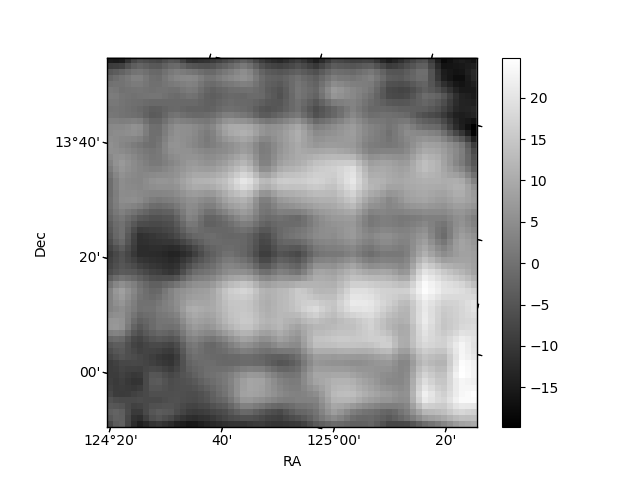
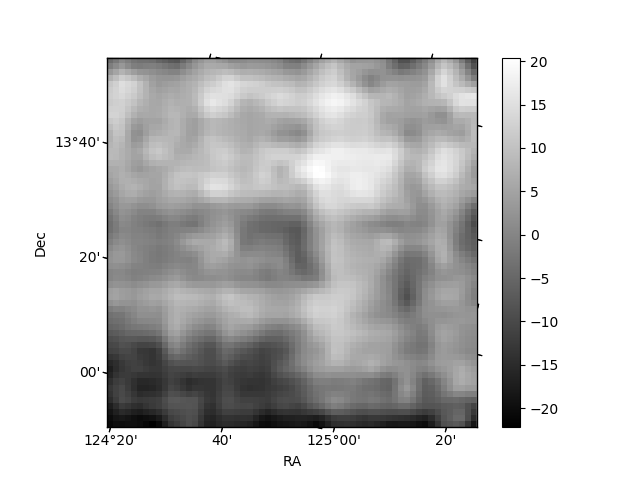
Histogram calculated using DETX and DETY for each event in the final _common_clean file
| Quadrant A | 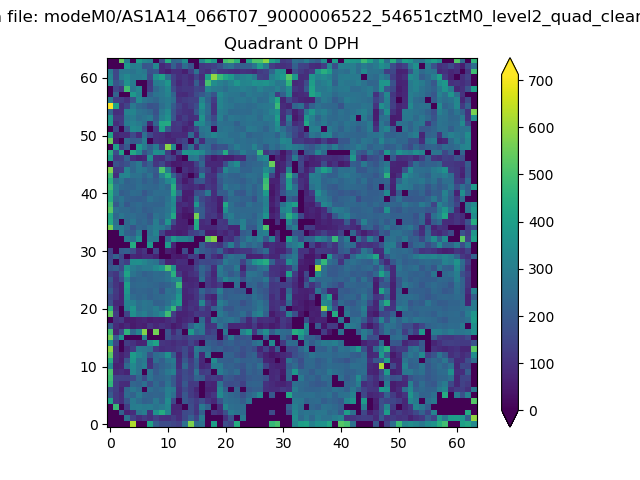 |
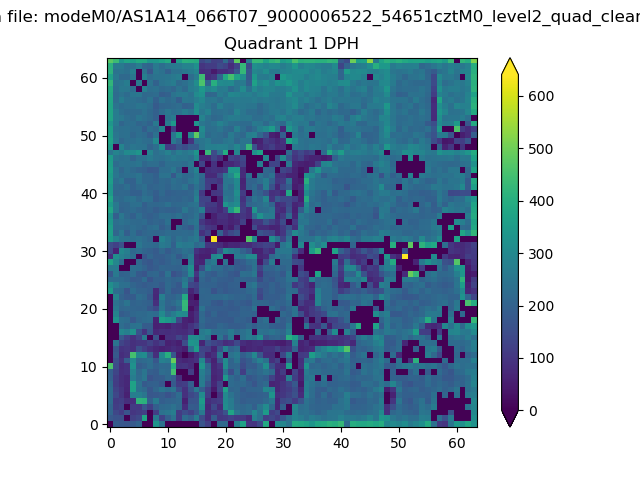 |
Quadrant B |
|---|---|---|---|
| Quadrant D | 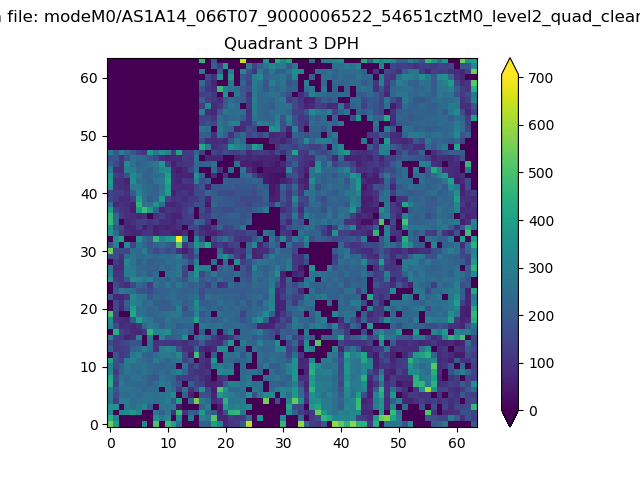 |
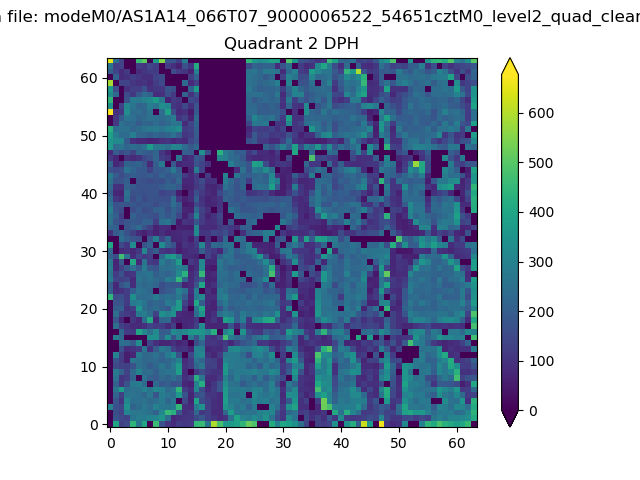 |
Quadrant C |
| Plot type | Count rate plots | Images |
|---|---|---|
| Comparison with Poisson distribution Blue bars denote a histogram of data divided into 1 sec bins. Red curve is a Poisson curve with rate = median count rate of data. |
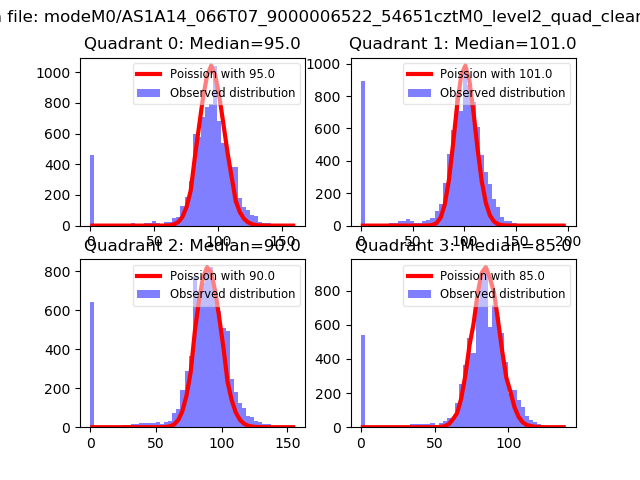 |
 |
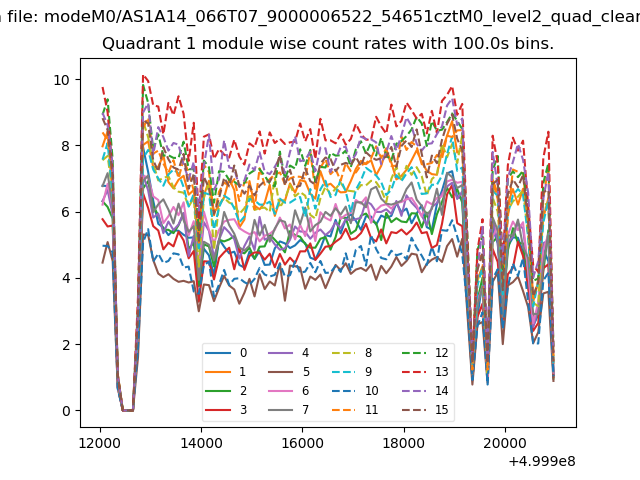
| Quadrant-wise count rates Data is divided into 100 sec bins |
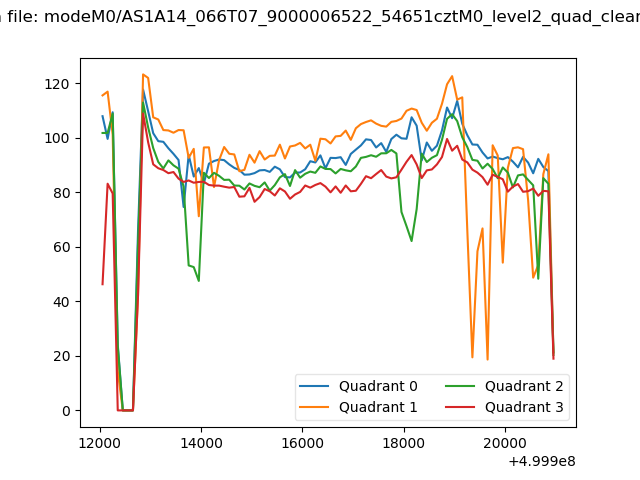 |
|
| Module-wise count rates for Quadrant A Data is divided into 100 sec bins |
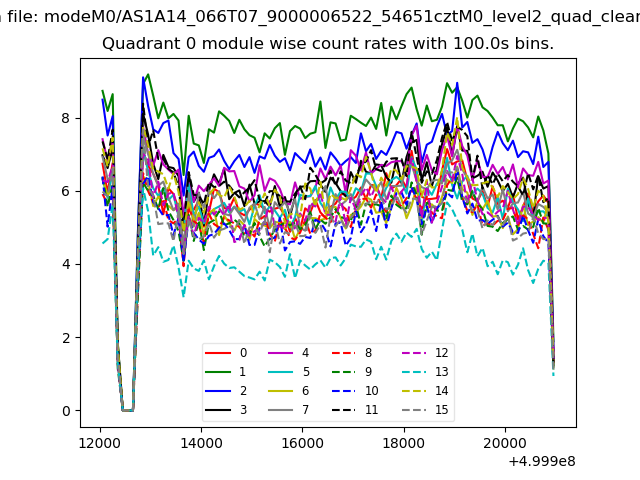 |
 |
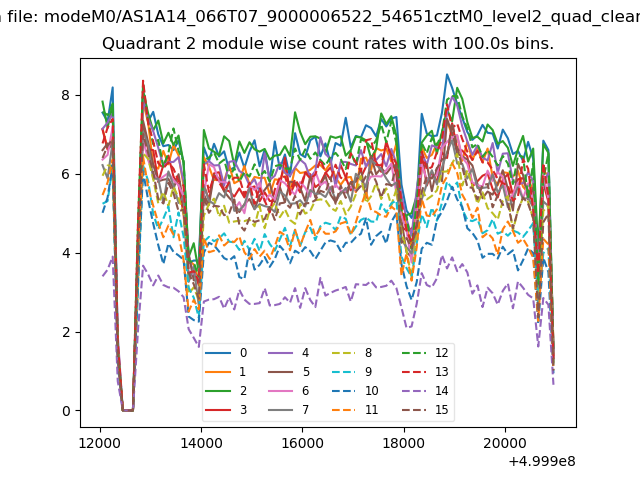
| Module-wise count rates for Quadrant B Data is divided into 100 sec bins |
 |
 |
| Module-wise count rates for Quadrant C Data is divided into 100 sec bins |
 |
 |
| Module-wise count rates for Quadrant D Data is divided into 100 sec bins |
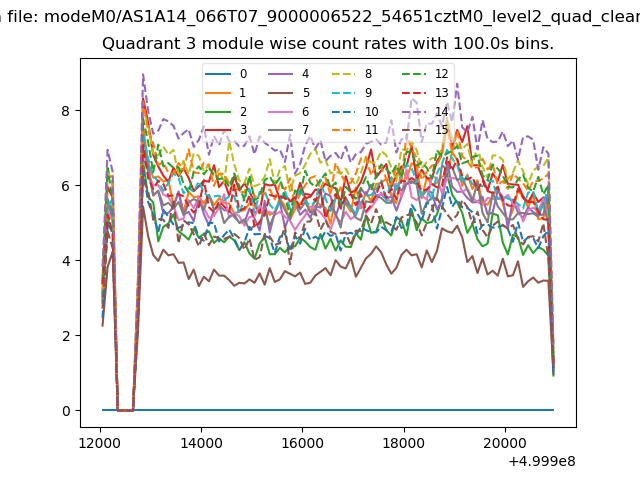 |
 |
| Parameter | Plot |
|---|---|
| CZT HV Monitor | 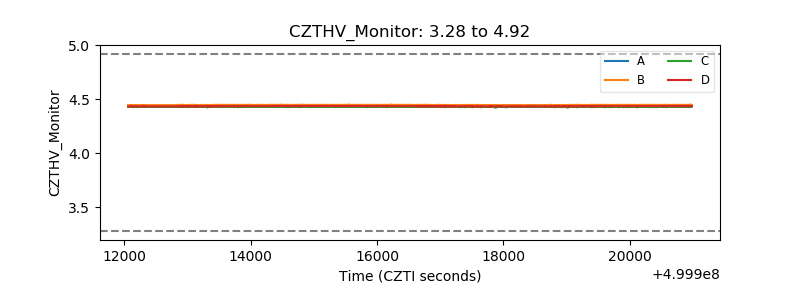 |
| D_VDD | 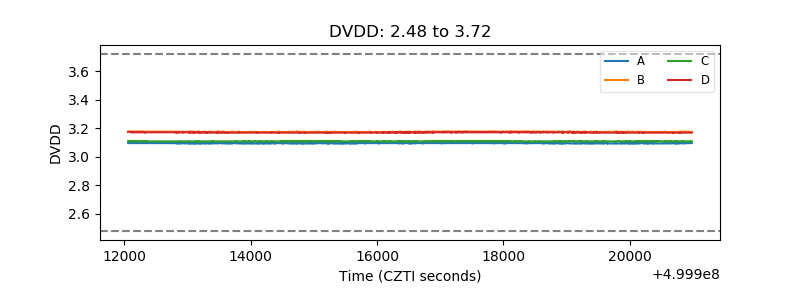 |
| Temperature 1 | 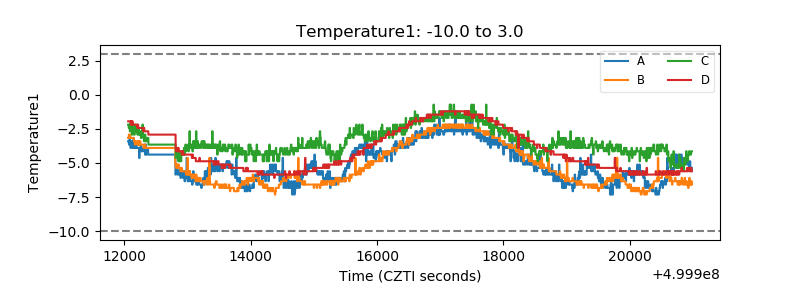 |
| Veto HV Monitor | 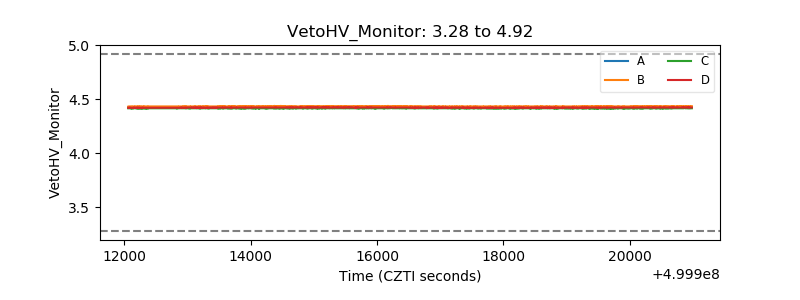 |
| Veto LLD | 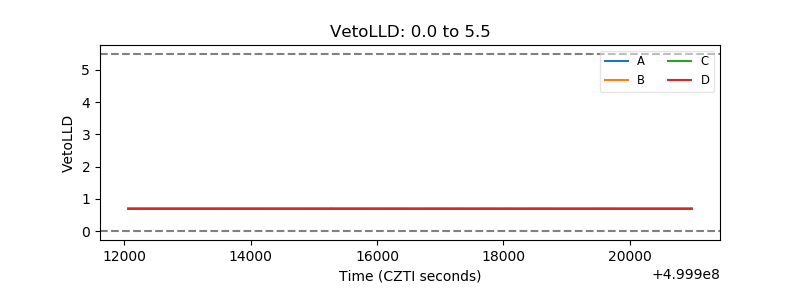 |
| Alpha Counter | 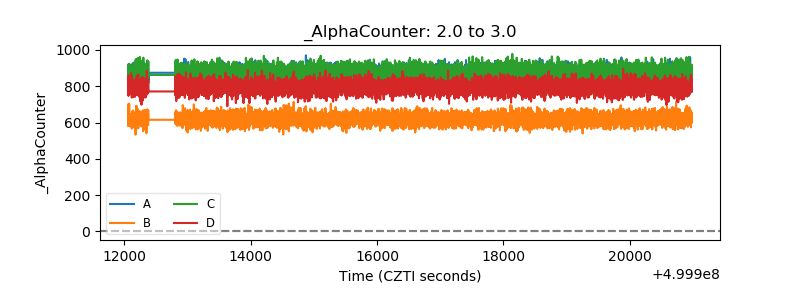 |
| _CPM_Rate | 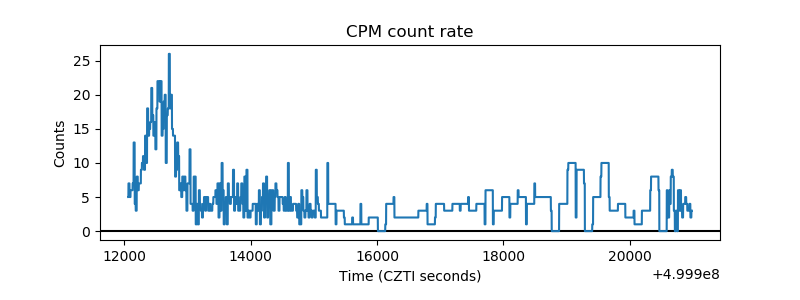 |
| CZT Counter | 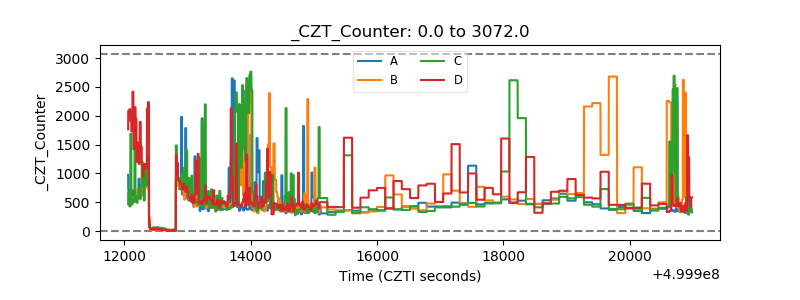 |
| +2.5 Volts monitor |  |
| +5 Volts monitor | 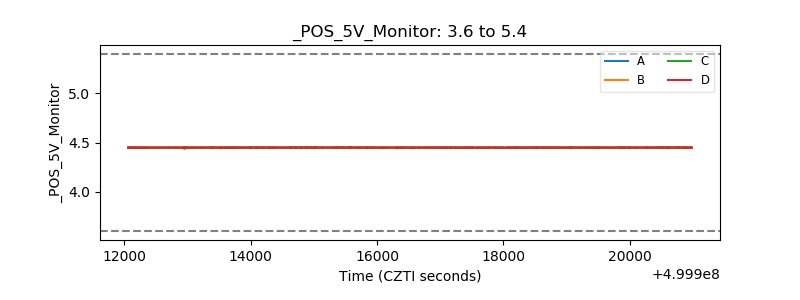 |
| _ROLL_ROT | 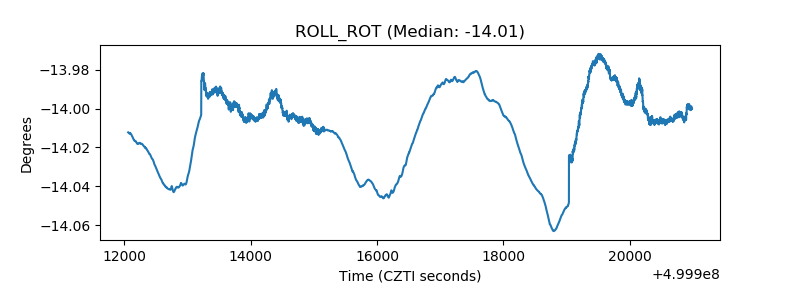 |
| _Roll_DEC | 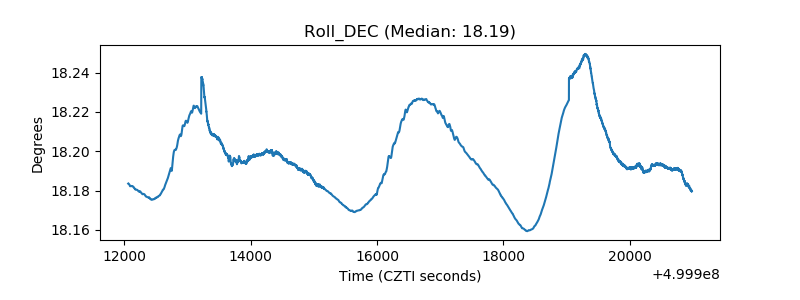 |
| _Roll_RA | 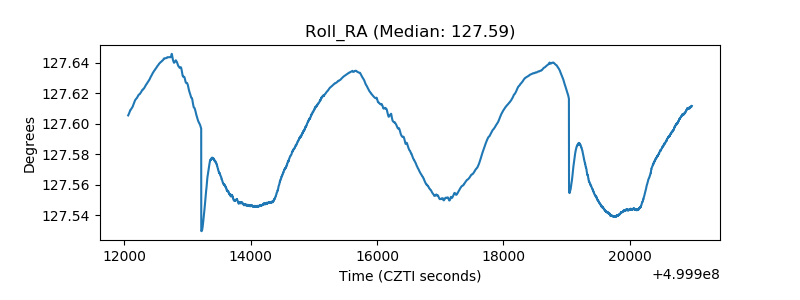 |
| Veto Counter | 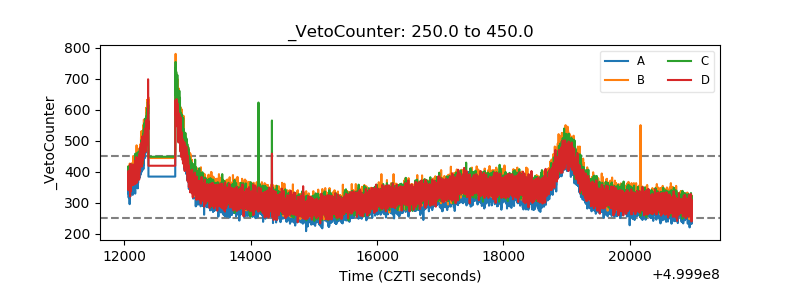 |