| Param | Original file | Final file |
|---|---|---|
| Filename | modeM0/AS1A14_066T07_9000006522_54652cztM0_level2.fits | modeM0/AS1A14_066T07_9000006522_54652cztM0_level2_quad_clean.evt |
| Size (bytes) | 513,385,920 | 112,950,720 |
| Size | 489.6 MB | 107.7 MB |
| Events in quadrant A | 3,657,542 | 749,249 |
| Events in quadrant B | 5,713,608 | 732,804 |
| Events in quadrant C | 3,944,643 | 706,295 |
| Events in quadrant D | 5,063,553 | 672,924 |
| Mode M0 | |||
|---|---|---|---|
| Quadrant | BADHDUFLAG | Total packets | Discarded packets |
| A | 0 | 16973 | 0 |
| B | 0 | 22790 | 0 |
| C | 0 | 17802 | 0 |
| D | 0 | 20691 | 0 |
| Mode SS | |||
|---|---|---|---|
| Quadrant | BADHDUFLAG | Total packets | Discarded packets |
| A | 0 | 162 | 0 |
| B | 0 | 162 | 0 |
| C | 0 | 162 | 0 |
| D | 0 | 162 | 0 |
| Quadrant | Total seconds | Saturated seconds | Saturation percentage |
|---|---|---|---|
| A | 8033 | 54 | 0.672227% |
| B | 8033 | 828 | 10.307482% |
| C | 8034 | 118 | 1.468758% |
| D | 8034 | 94 | 1.170027% |
Noise dominated data is calculated using 1-second bins in cleaned event files. If a bin has >2000 counts, and if more than 50% of those come from <1% of pixels, then it is considered to be noise-dominated and hence unusable.
| Quadrant | # 1 sec bins | Bins with >0 counts | Bins with >2000 counts | High rate bins dominated by noise | Noise dominated (total time) | Noise dominated (detector-on time) | Marked lightcurve |
|---|---|---|---|---|---|---|---|
| A | 8033 | 8033 | 46 | 46 | 0.57% | 0.57% | 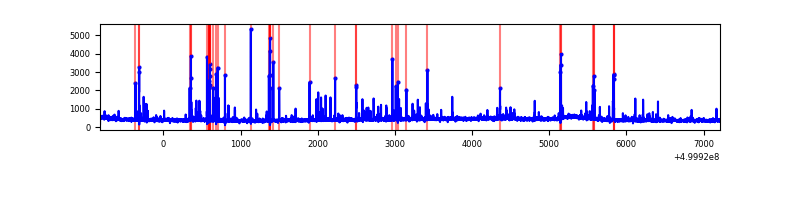 |
| B | 8033 | 8033 | 623 | 623 | 7.76% | 7.76% | 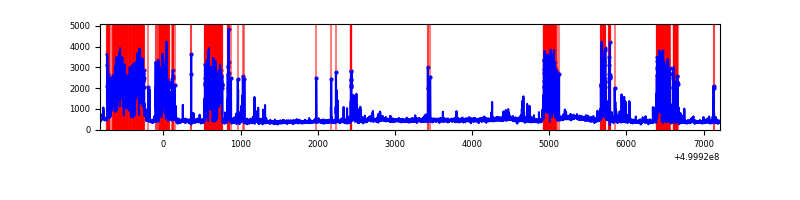 |
| C | 8034 | 8034 | 97 | 97 | 1.21% | 1.21% | 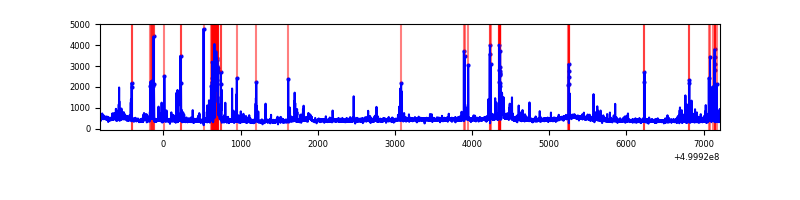 |
| D | 8034 | 8034 | 96 | 96 | 1.19% | 1.19% | 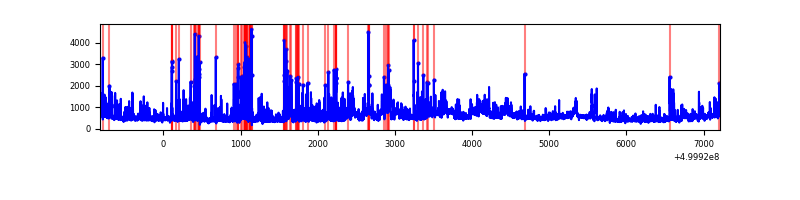 |
Top three noisy pixels from each quadrant. If the there are fewer than three noisy pixels in the level2.evt file, extra rows are filled as -1
| Pixel properties | Quadrant properties | ||||||
|---|---|---|---|---|---|---|---|
| Quadrant | DetID | PixID | Counts | Sigma | Mean | Median | Sigma |
| A | 11 | 3 | 223240 | 1054.6 | 843 | 822 | 210.9 |
| A | 0 | 8 | 66307 | 310.5 | 843 | 822 | 210.9 |
| A | 3 | 110 | 46321 | 215.73 | 843 | 822 | 210.9 |
| B | 2 | 249 | 2162926 | 12351.85 | 804 | 775 | 175.0 |
| B | 10 | 247 | 174037 | 989.8 | 804 | 775 | 175.0 |
| B | 12 | 0 | 91614 | 518.94 | 804 | 775 | 175.0 |
| C | 13 | 3 | 346222 | 1529.51 | 819 | 812 | 225.8 |
| C | 9 | 237 | 127274 | 559.99 | 819 | 812 | 225.8 |
| C | 4 | 5 | 109141 | 479.69 | 819 | 812 | 225.8 |
| D | 2 | 62 | 985261 | 4207.41 | 813 | 776 | 234.0 |
| D | 6 | 239 | 527825 | 2252.46 | 813 | 776 | 234.0 |
| D | 8 | 240 | 93368 | 395.71 | 813 | 776 | 234.0 |
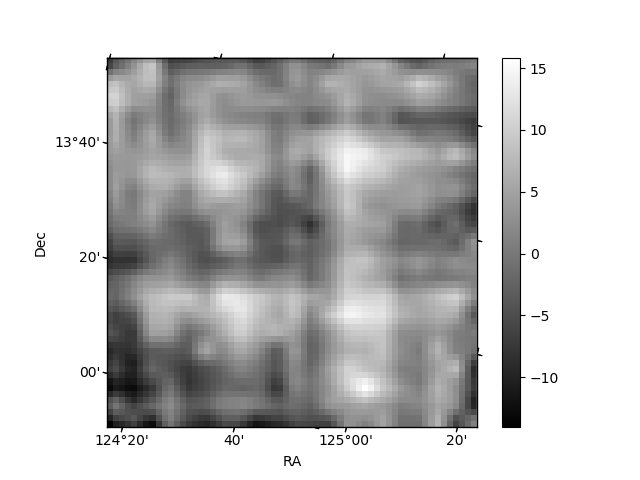
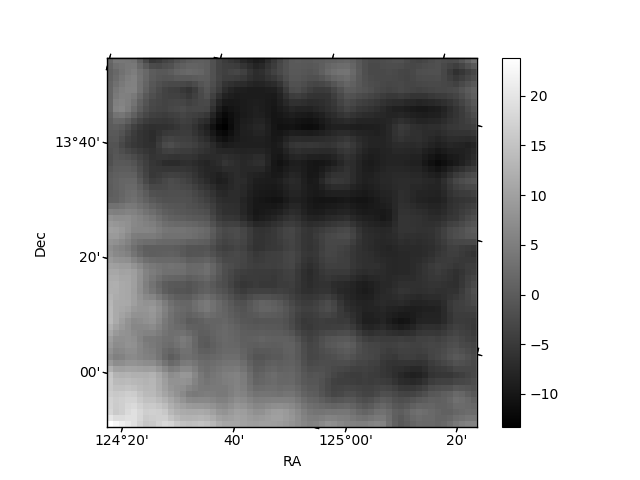
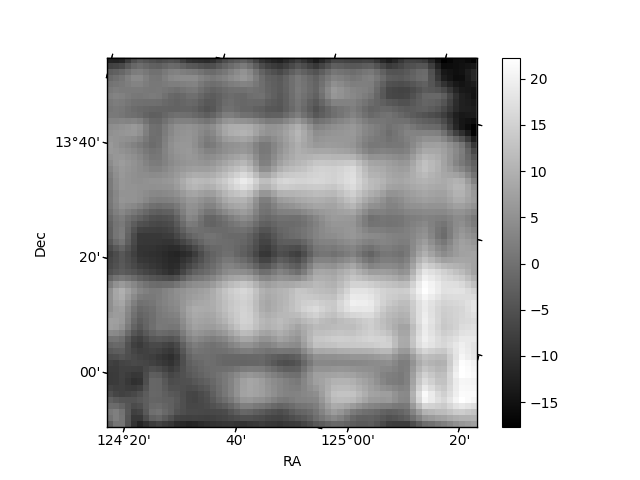
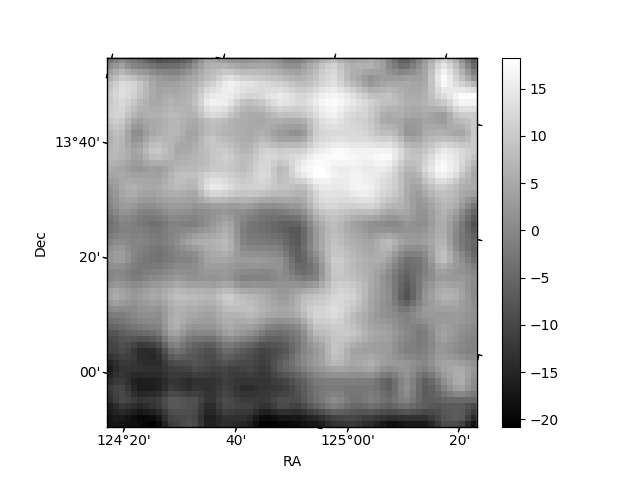
Histogram calculated using DETX and DETY for each event in the final _common_clean file
| Quadrant A | 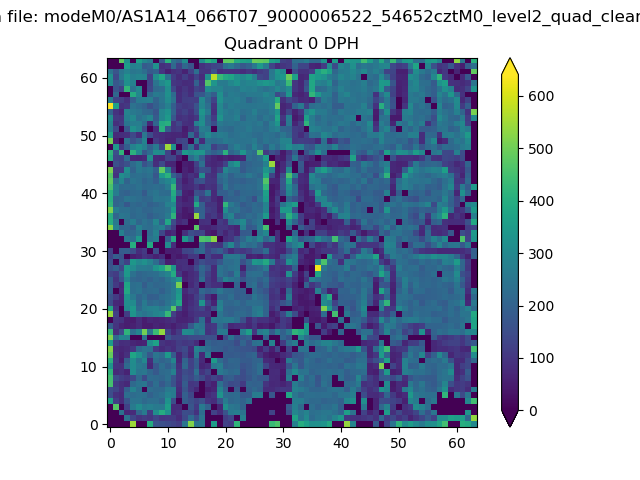 |
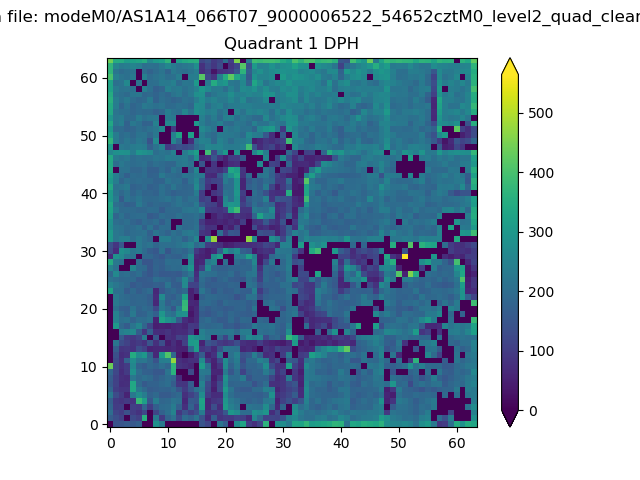 |
Quadrant B |
|---|---|---|---|
| Quadrant D | 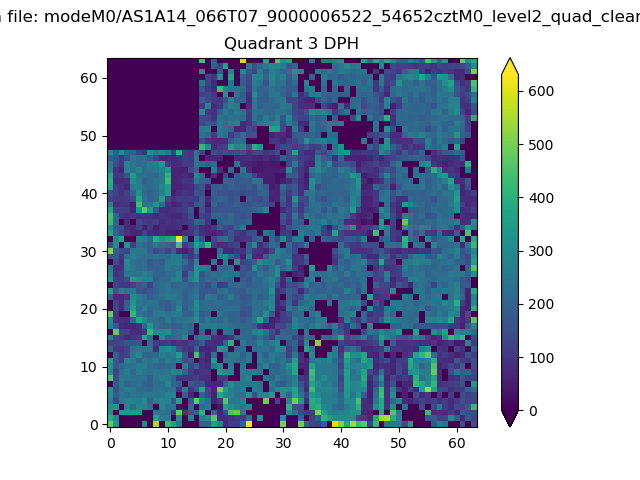 |
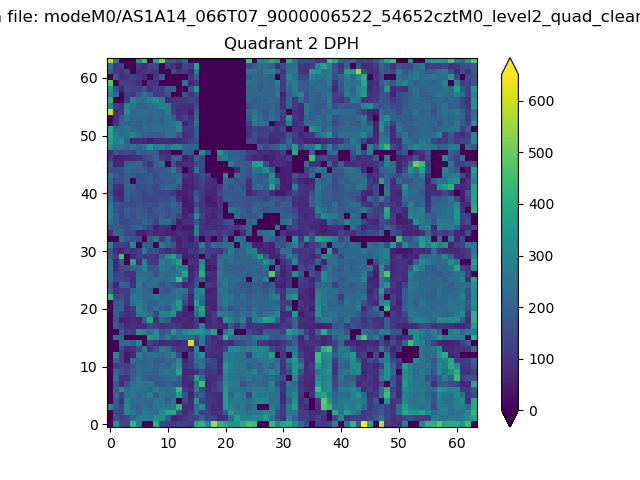 |
Quadrant C |
| Plot type | Count rate plots | Images |
|---|---|---|
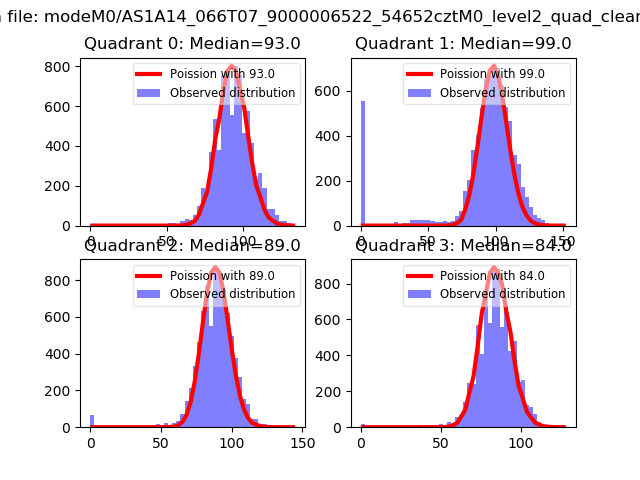
| Comparison with Poisson distribution Blue bars denote a histogram of data divided into 1 sec bins. Red curve is a Poisson curve with rate = median count rate of data. |
 |
 |
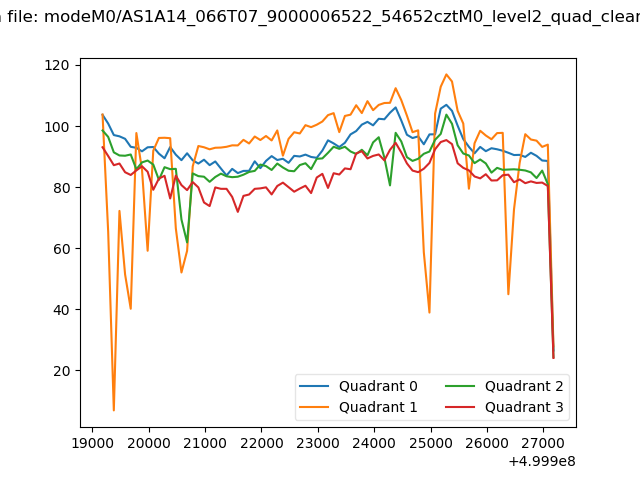
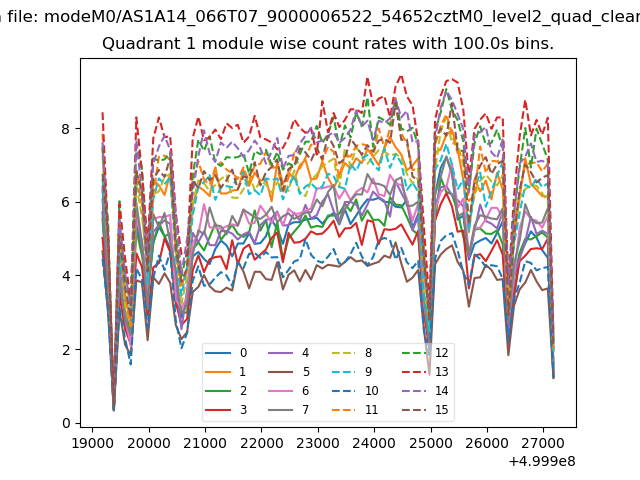
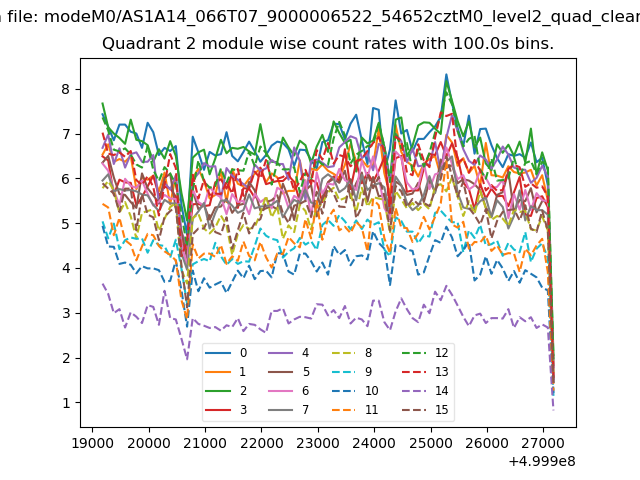
| Quadrant-wise count rates Data is divided into 100 sec bins |
 |
|
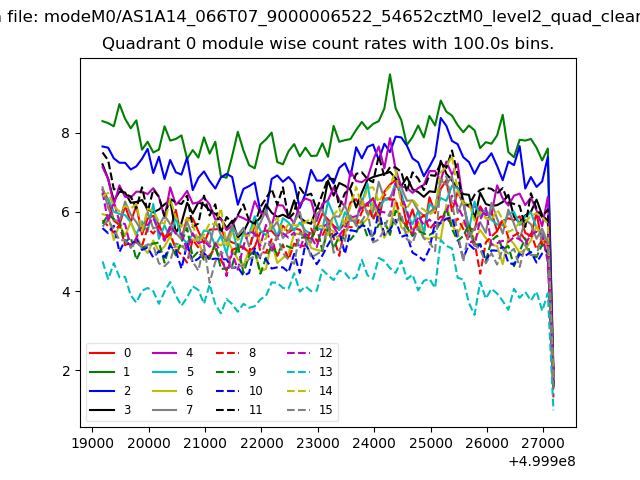
| Module-wise count rates for Quadrant A Data is divided into 100 sec bins |
 |
 |
| Module-wise count rates for Quadrant B Data is divided into 100 sec bins |
 |
 |
| Module-wise count rates for Quadrant C Data is divided into 100 sec bins |
 |
 |
| Module-wise count rates for Quadrant D Data is divided into 100 sec bins |
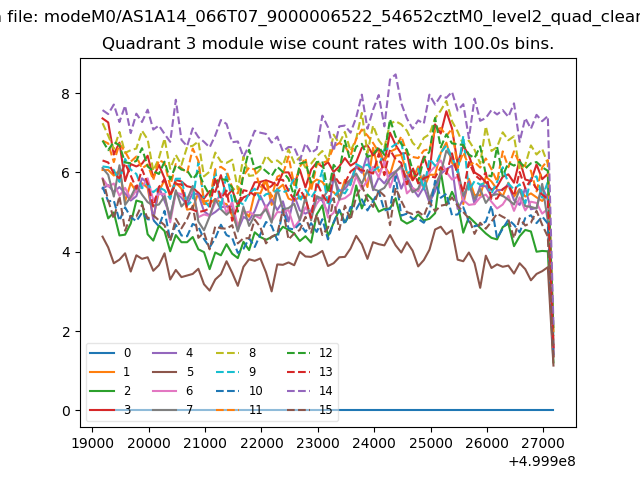 |
 |
| Parameter | Plot |
|---|---|
| CZT HV Monitor | 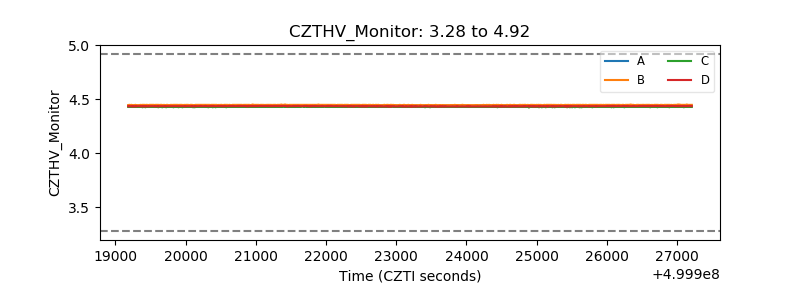 |
| D_VDD | 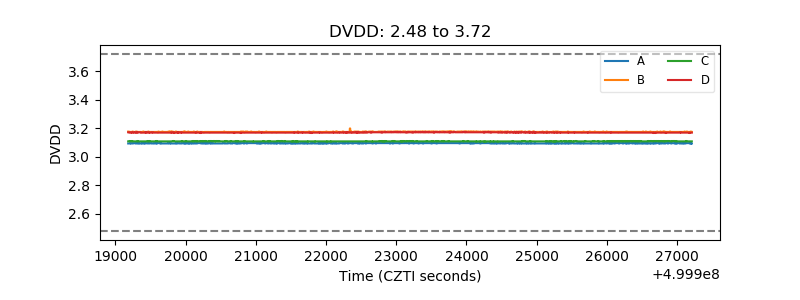 |
| Temperature 1 | 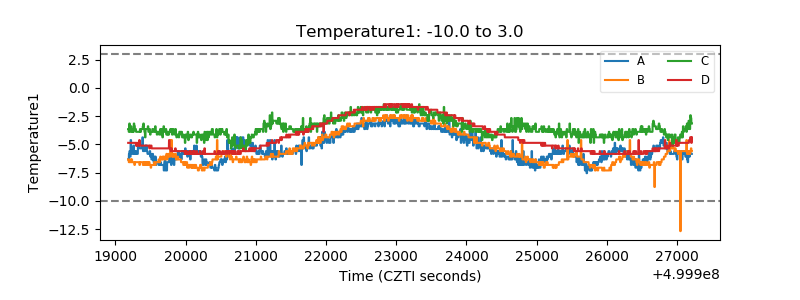 |
| Veto HV Monitor | 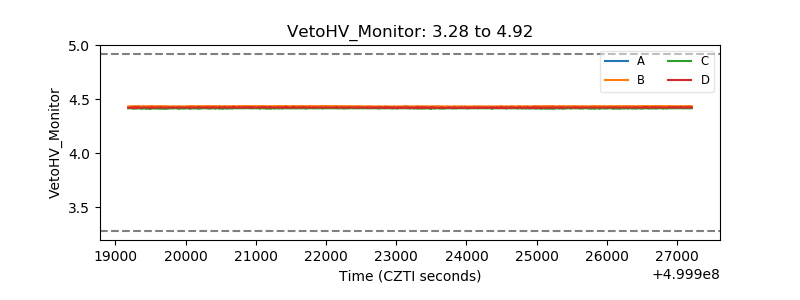 |
| Veto LLD | 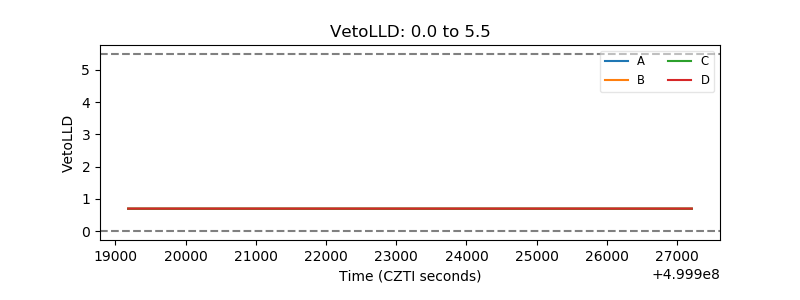 |
| Alpha Counter | 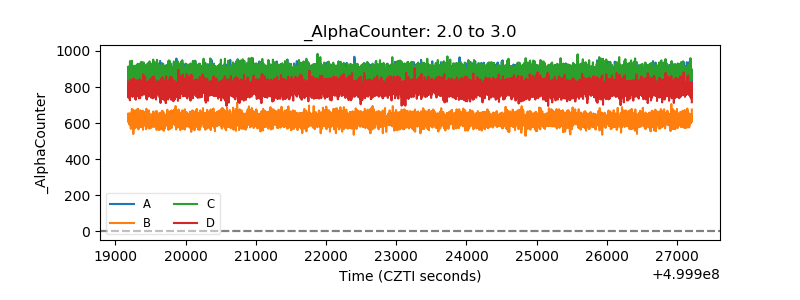 |
| _CPM_Rate | 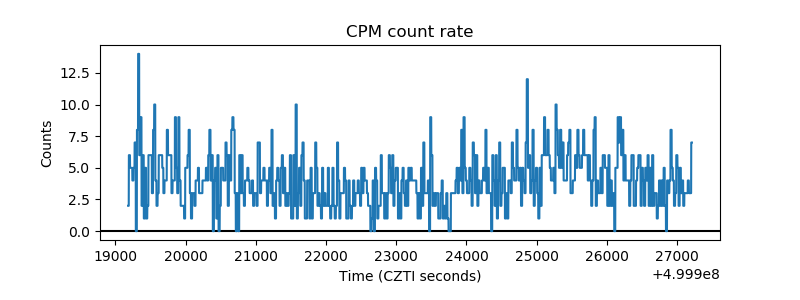 |
| CZT Counter | 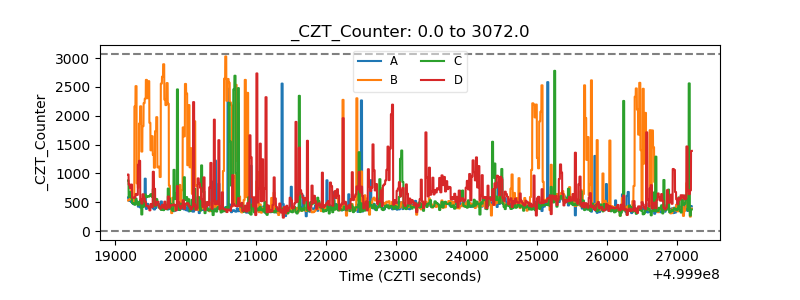 |
| +2.5 Volts monitor |  |
| +5 Volts monitor |  |
| _ROLL_ROT | 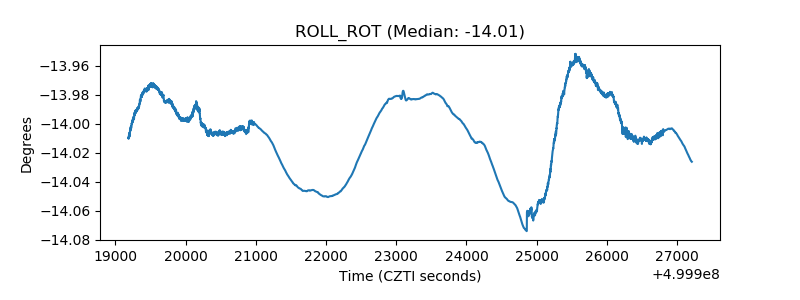 |
| _Roll_DEC | 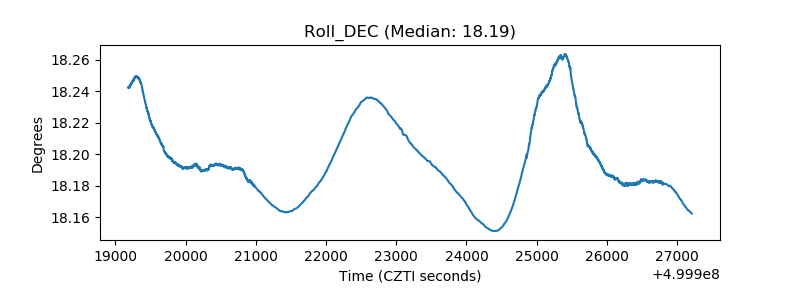 |
| _Roll_RA | 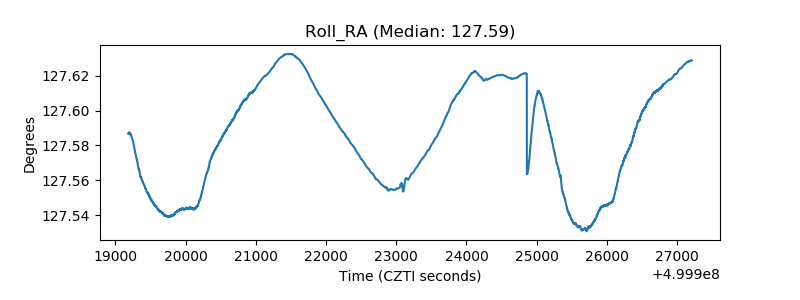 |
| Veto Counter | 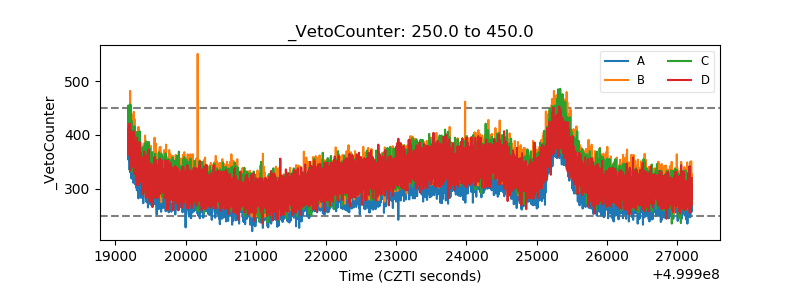 |