| Param | Original file | Final file |
|---|---|---|
| Filename | modeM0/AS1A14_066T07_9000006522_54655cztM0_level2.fits | modeM0/AS1A14_066T07_9000006522_54655cztM0_level2_quad_clean.evt |
| Size (bytes) | 773,386,560 | 134,046,720 |
| Size | 737.6 MB | 127.8 MB |
| Events in quadrant A | 4,967,651 | 917,986 |
| Events in quadrant B | 5,848,580 | 955,330 |
| Events in quadrant C | 5,033,758 | 869,514 |
| Events in quadrant D | 12,005,165 | 624,990 |
| Mode M0 | |||
|---|---|---|---|
| Quadrant | BADHDUFLAG | Total packets | Discarded packets |
| A | 0 | 22341 | 0 |
| B | 0 | 24762 | 0 |
| C | 0 | 22488 | 0 |
| D | 0 | 42625 | 0 |
| Mode SS | |||
|---|---|---|---|
| Quadrant | BADHDUFLAG | Total packets | Discarded packets |
| A | 0 | 200 | 0 |
| B | 0 | 200 | 0 |
| C | 0 | 200 | 0 |
| D | 0 | 200 | 0 |
| Quadrant | Total seconds | Saturated seconds | Saturation percentage |
|---|---|---|---|
| A | 9965 | 139 | 1.394882% |
| B | 9965 | 500 | 5.017561% |
| C | 9965 | 173 | 1.736076% |
| D | 9965 | 2502 | 25.107878% |
Noise dominated data is calculated using 1-second bins in cleaned event files. If a bin has >2000 counts, and if more than 50% of those come from <1% of pixels, then it is considered to be noise-dominated and hence unusable.
| Quadrant | # 1 sec bins | Bins with >0 counts | Bins with >2000 counts | High rate bins dominated by noise | Noise dominated (total time) | Noise dominated (detector-on time) | Marked lightcurve |
|---|---|---|---|---|---|---|---|
| A | 9965 | 9965 | 128 | 128 | 1.28% | 1.28% | 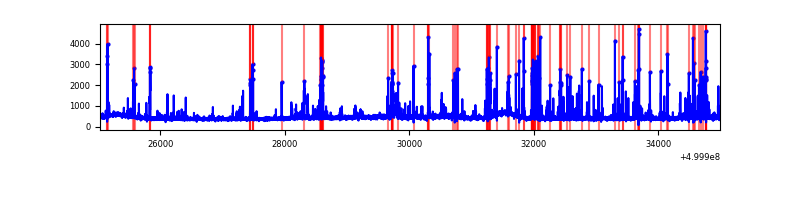 |
| B | 9965 | 9965 | 314 | 314 | 3.15% | 3.15% | 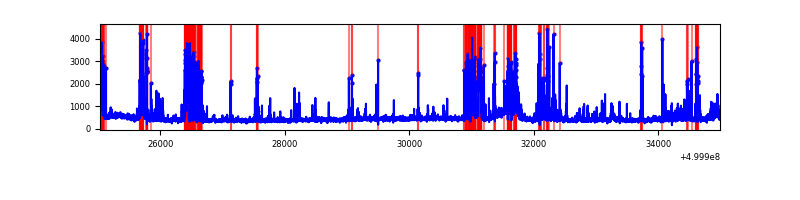 |
| C | 9965 | 9965 | 159 | 159 | 1.60% | 1.60% | 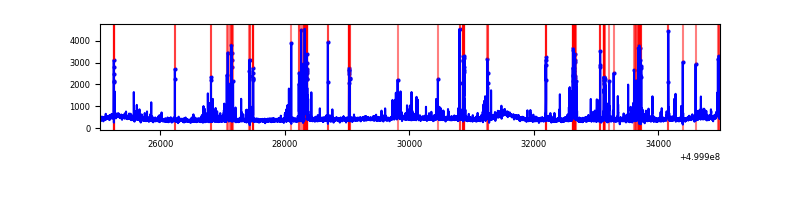 |
| D | 9965 | 9965 | 2120 | 2120 | 21.27% | 21.27% | 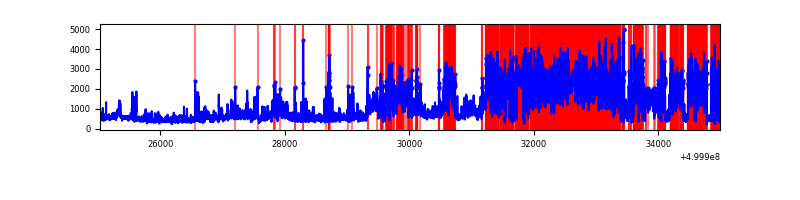 |
Top three noisy pixels from each quadrant. If the there are fewer than three noisy pixels in the level2.evt file, extra rows are filled as -1
| Pixel properties | Quadrant properties | ||||||
|---|---|---|---|---|---|---|---|
| Quadrant | DetID | PixID | Counts | Sigma | Mean | Median | Sigma |
| A | 11 | 3 | 465775 | 1779.4 | 1057 | 1031 | 261.2 |
| A | 0 | 8 | 320814 | 1224.38 | 1057 | 1031 | 261.2 |
| A | 3 | 110 | 44237 | 165.43 | 1057 | 1031 | 261.2 |
| B | 2 | 249 | 1181899 | 5299.56 | 1027 | 989 | 222.8 |
| B | 5 | 172 | 274920 | 1229.32 | 1027 | 989 | 222.8 |
| B | 10 | 247 | 180526 | 805.71 | 1027 | 989 | 222.8 |
| C | 13 | 3 | 299094 | 1066.13 | 1022 | 1012 | 279.6 |
| C | 15 | 147 | 208888 | 743.5 | 1022 | 1012 | 279.6 |
| C | 12 | 250 | 104168 | 368.95 | 1022 | 1012 | 279.6 |
| D | 2 | 62 | 7975028 | 31165.01 | 898 | 858 | 255.9 |
| D | 5 | 173 | 81654 | 315.77 | 898 | 858 | 255.9 |
| D | 2 | 249 | 72915 | 281.62 | 898 | 858 | 255.9 |
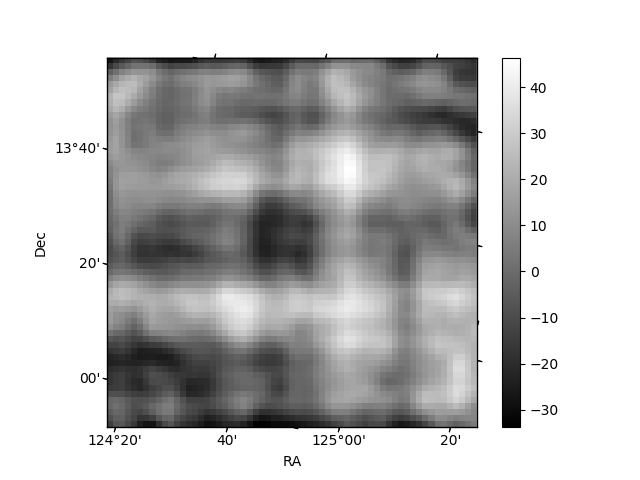
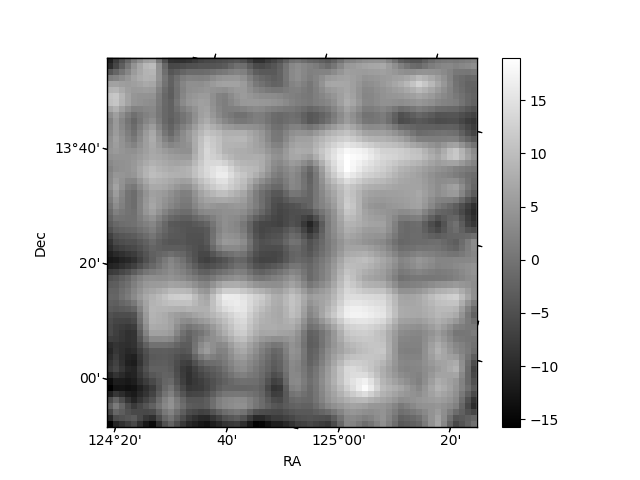
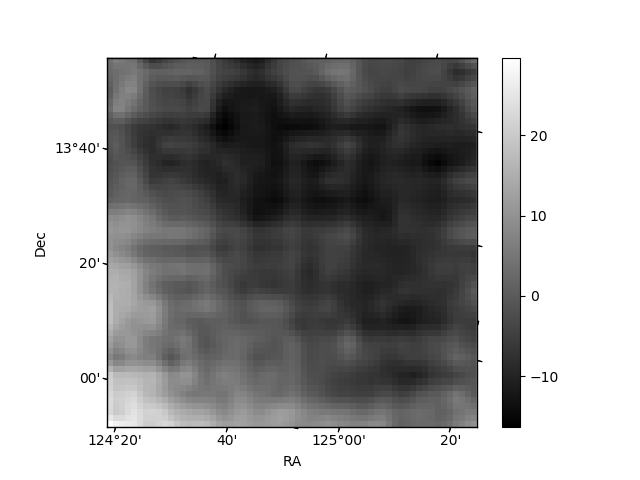
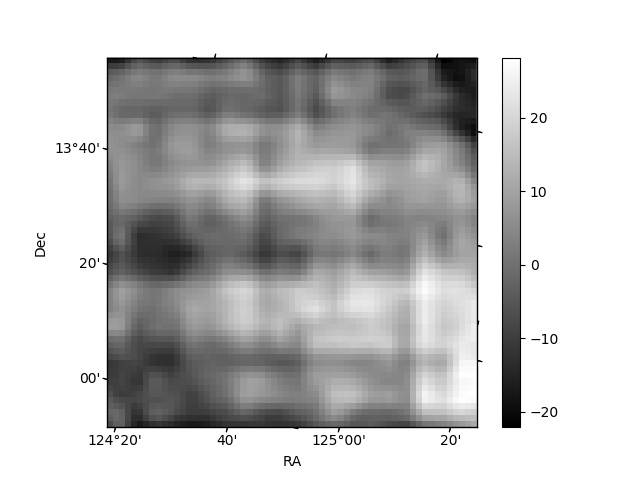
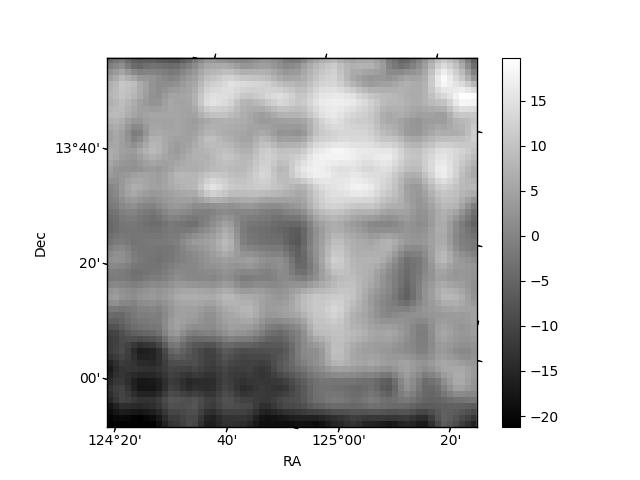
Histogram calculated using DETX and DETY for each event in the final _common_clean file
| Quadrant A | 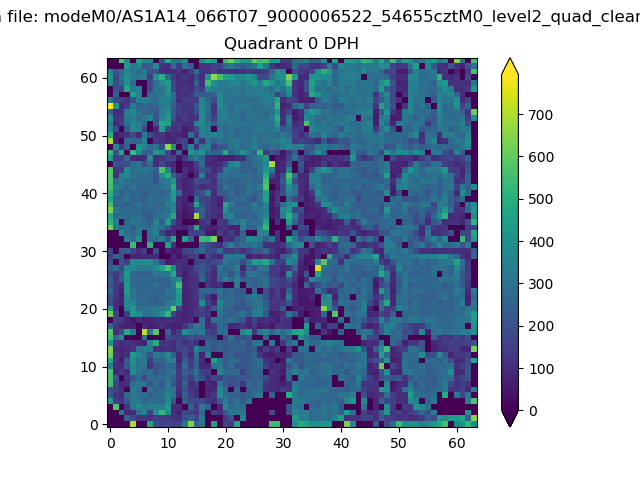 |
 |
Quadrant B |
|---|---|---|---|
| Quadrant D | 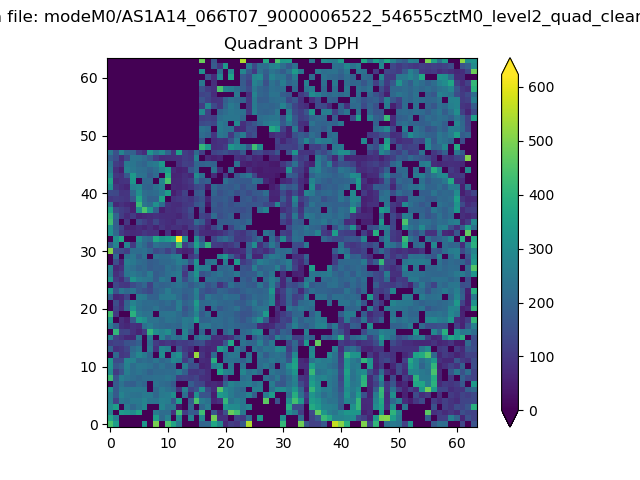 |
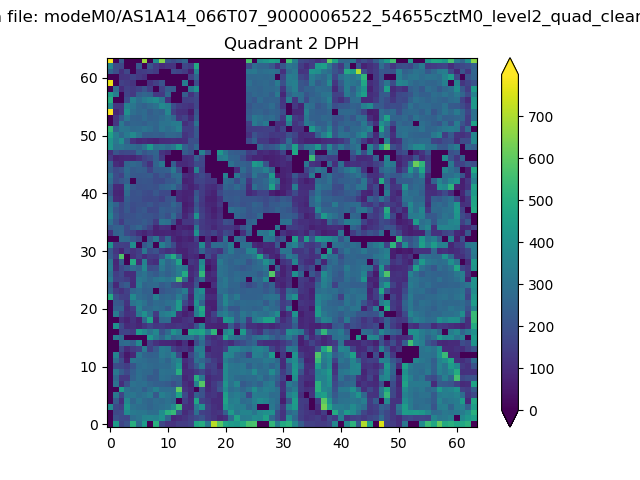 |
Quadrant C |
| Plot type | Count rate plots | Images |
|---|---|---|
| Comparison with Poisson distribution Blue bars denote a histogram of data divided into 1 sec bins. Red curve is a Poisson curve with rate = median count rate of data. |
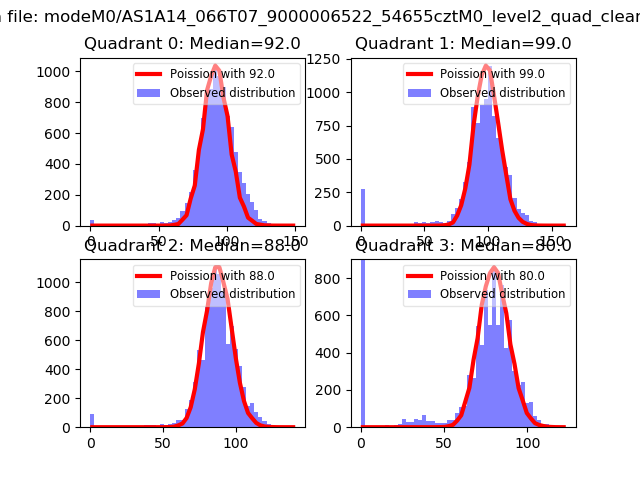 |
 |
| Quadrant-wise count rates Data is divided into 100 sec bins |
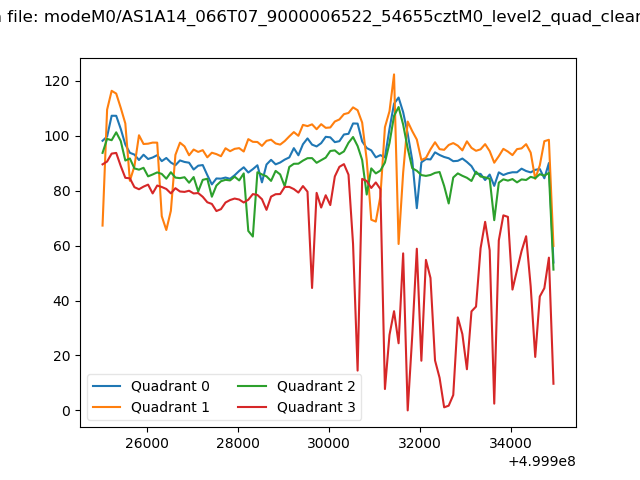 |
|
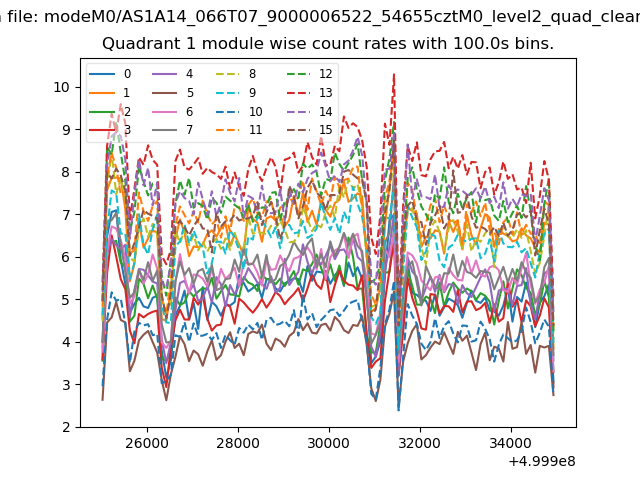
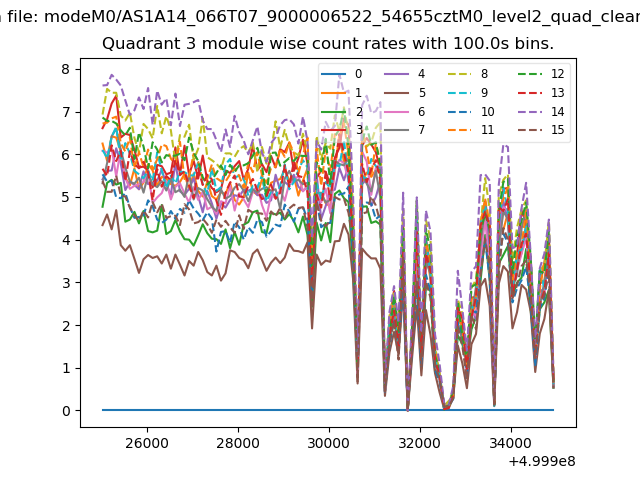
| Module-wise count rates for Quadrant A Data is divided into 100 sec bins |
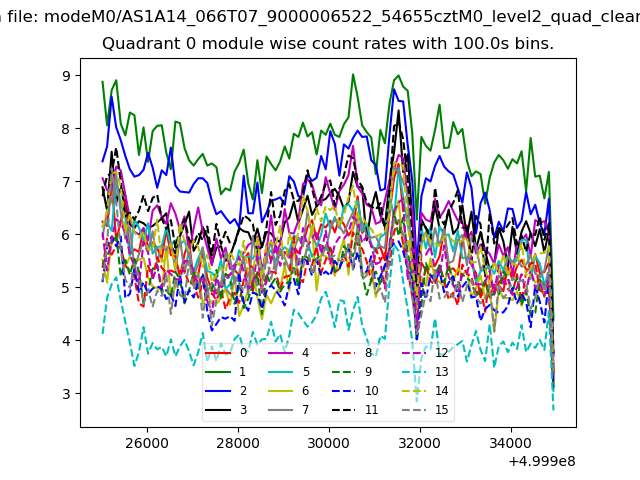 |
 |
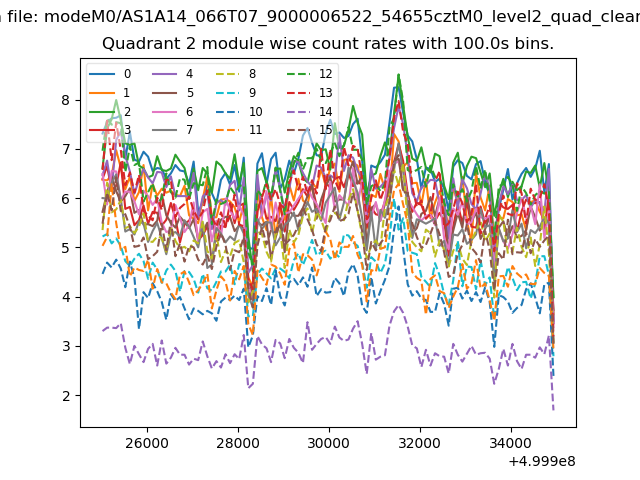
| Module-wise count rates for Quadrant B Data is divided into 100 sec bins |
 |
 |
| Module-wise count rates for Quadrant C Data is divided into 100 sec bins |
 |
 |
| Module-wise count rates for Quadrant D Data is divided into 100 sec bins |
 |
 |
| Parameter | Plot |
|---|---|
| CZT HV Monitor | 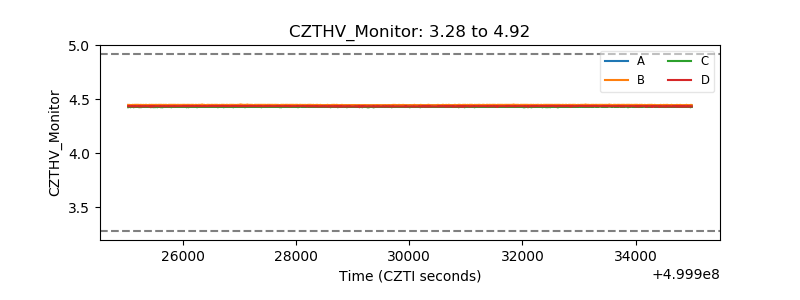 |
| D_VDD | 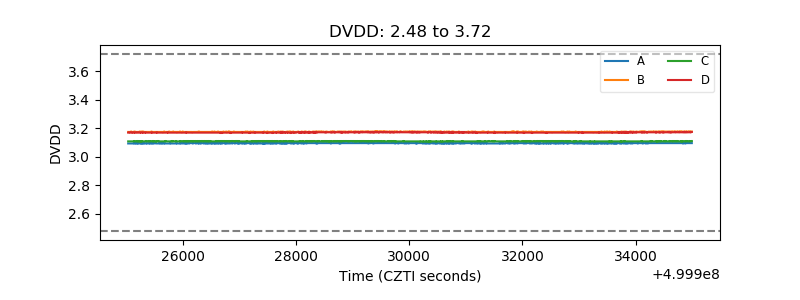 |
| Temperature 1 | 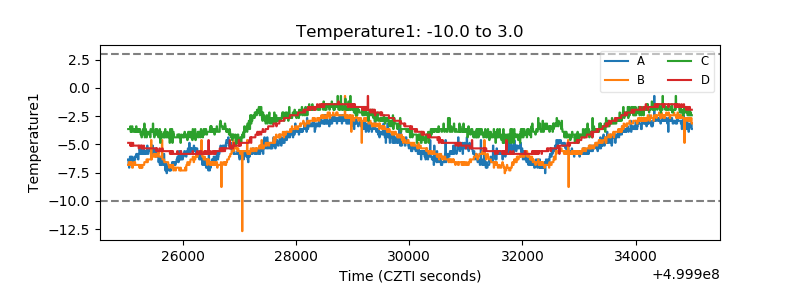 |
| Veto HV Monitor | 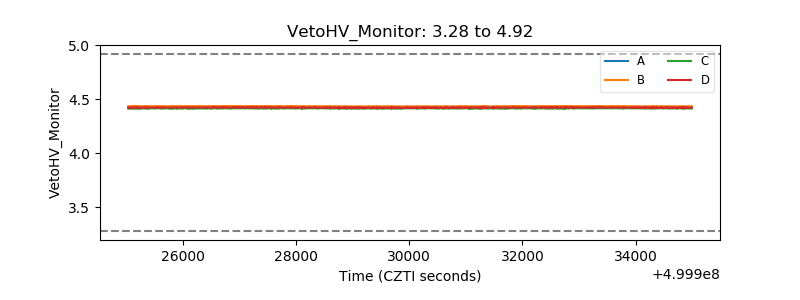 |
| Veto LLD | 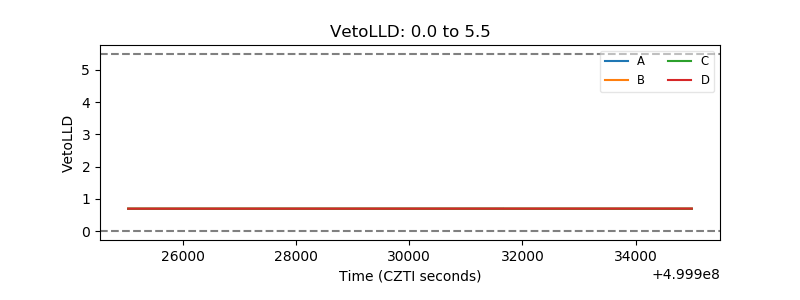 |
| Alpha Counter | 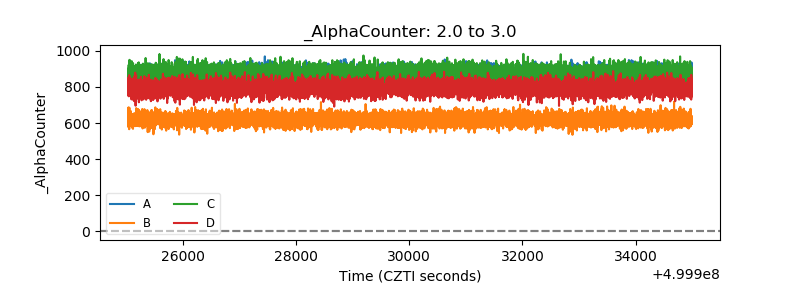 |
| _CPM_Rate | 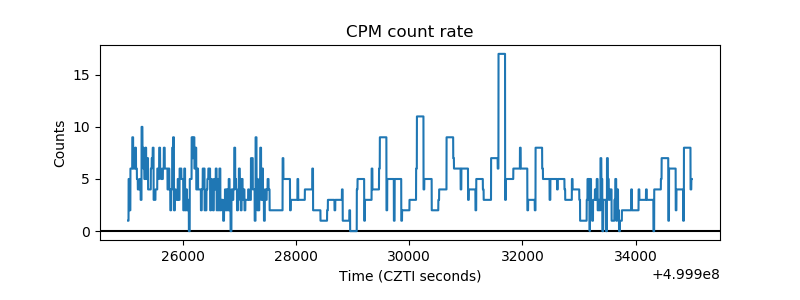 |
| CZT Counter | 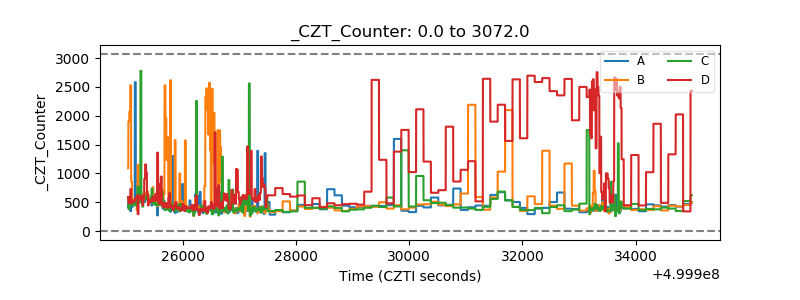 |
| +2.5 Volts monitor |  |
| +5 Volts monitor | 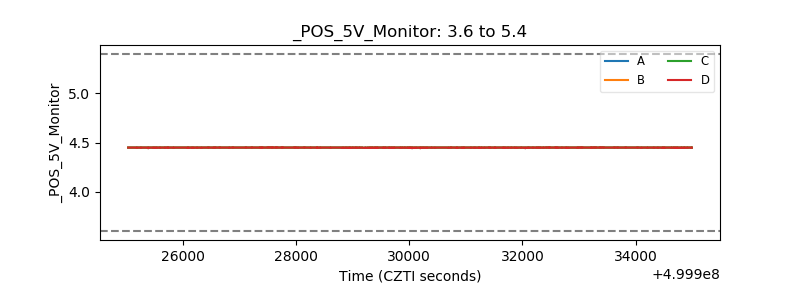 |
| _ROLL_ROT | 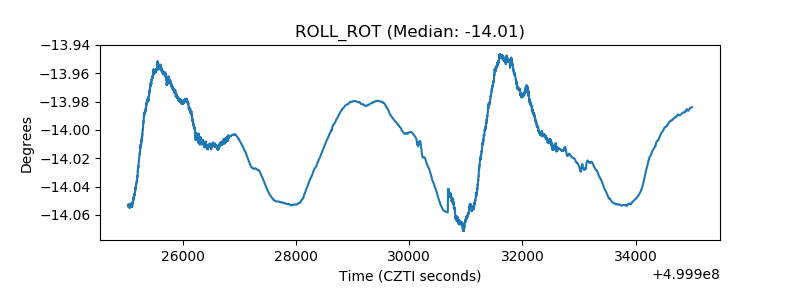 |
| _Roll_DEC | 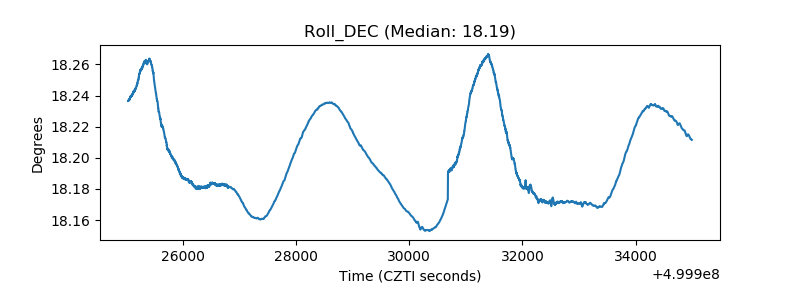 |
| _Roll_RA | 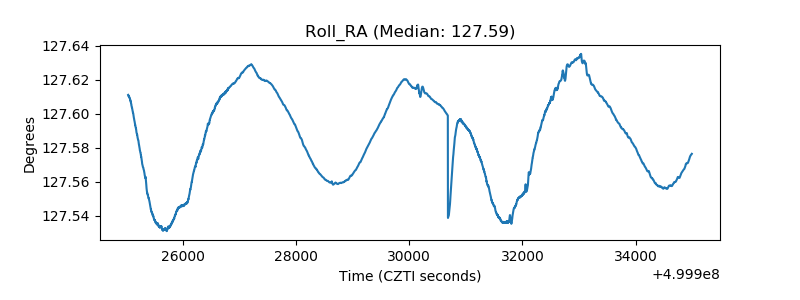 |
| Veto Counter | 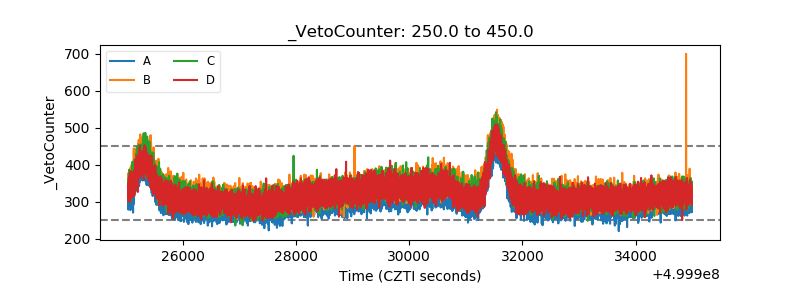 |