| Param | Original file | Final file |
|---|---|---|
| Filename | modeM0/AS1A14_066T07_9000006522_54657cztM0_level2.fits | modeM0/AS1A14_066T07_9000006522_54657cztM0_level2_quad_clean.evt |
| Size (bytes) | 606,136,320 | 95,284,800 |
| Size | 578.1 MB | 90.9 MB |
| Events in quadrant A | 3,605,709 | 657,817 |
| Events in quadrant B | 3,905,896 | 708,952 |
| Events in quadrant C | 4,616,272 | 600,674 |
| Events in quadrant D | 9,761,411 | 426,616 |
| Mode M9 | |||
|---|---|---|---|
| Quadrant | BADHDUFLAG | Total packets | Discarded packets |
| A | 0 | 9 | 0 |
| B | 0 | 9 | 0 |
| C | 0 | 10 | 0 |
| D | 0 | 10 | 0 |
| Mode M0 | |||
|---|---|---|---|
| Quadrant | BADHDUFLAG | Total packets | Discarded packets |
| A | 0 | 15831 | 2 |
| B | 0 | 16443 | 2 |
| C | 0 | 18849 | 2 |
| D | 0 | 33851 | 2 |
| Mode SS | |||
|---|---|---|---|
| Quadrant | BADHDUFLAG | Total packets | Discarded packets |
| A | 0 | 142 | 0 |
| B | 0 | 142 | 0 |
| C | 0 | 142 | 0 |
| D | 0 | 142 | 0 |
| Quadrant | Total seconds | Saturated seconds | Saturation percentage |
|---|---|---|---|
| A | 7053 | 231 | 3.275202% |
| B | 7053 | 196 | 2.778959% |
| C | 7053 | 561 | 7.954062% |
| D | 7052 | 2306 | 32.699943% |
Noise dominated data is calculated using 1-second bins in cleaned event files. If a bin has >2000 counts, and if more than 50% of those come from <1% of pixels, then it is considered to be noise-dominated and hence unusable.
| Quadrant | # 1 sec bins | Bins with >0 counts | Bins with >2000 counts | High rate bins dominated by noise | Noise dominated (total time) | Noise dominated (detector-on time) | Marked lightcurve |
|---|---|---|---|---|---|---|---|
| A | 7953 | 7053 | 105 | 105 | 1.32% | 1.49% | 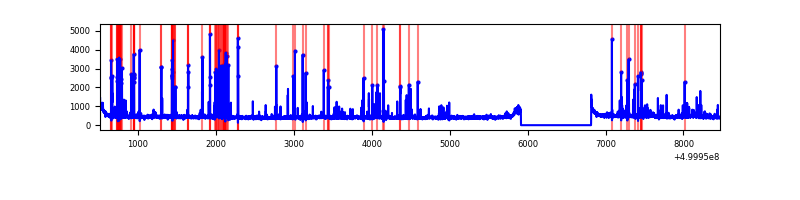 |
| B | 7953 | 7053 | 45 | 45 | 0.57% | 0.64% | 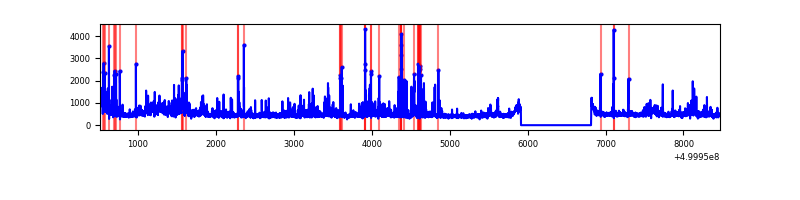 |
| C | 7953 | 7053 | 368 | 368 | 4.63% | 5.22% | 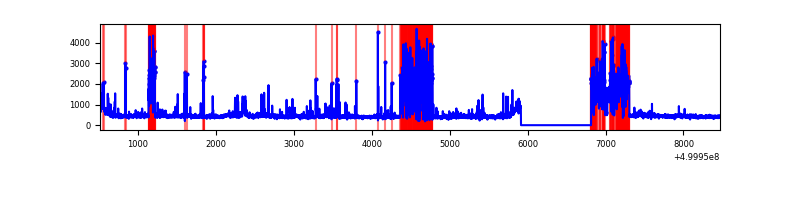 |
| D | 7952 | 7052 | 1947 | 1947 | 24.48% | 27.61% | 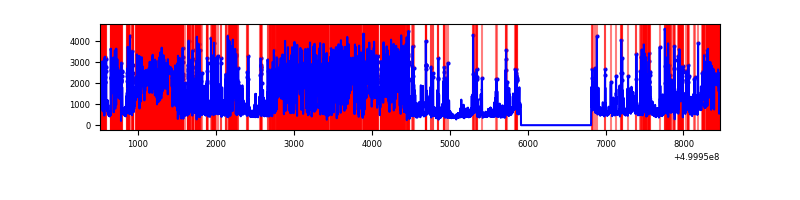 |
Top three noisy pixels from each quadrant. If the there are fewer than three noisy pixels in the level2.evt file, extra rows are filled as -1
| Pixel properties | Quadrant properties | ||||||
|---|---|---|---|---|---|---|---|
| Quadrant | DetID | PixID | Counts | Sigma | Mean | Median | Sigma |
| A | 11 | 3 | 391613 | 2026.5 | 780 | 761 | 192.9 |
| A | 5 | 240 | 97769 | 502.97 | 780 | 761 | 192.9 |
| A | 0 | 8 | 48295 | 246.45 | 780 | 761 | 192.9 |
| B | 5 | 172 | 357182 | 2157.83 | 766 | 737 | 165.2 |
| B | 10 | 247 | 166075 | 1000.91 | 766 | 737 | 165.2 |
| B | 2 | 249 | 130169 | 783.55 | 766 | 737 | 165.2 |
| C | 4 | 5 | 1387315 | 6907.99 | 736 | 727 | 200.7 |
| C | 13 | 3 | 179600 | 891.15 | 736 | 727 | 200.7 |
| C | 12 | 250 | 66510 | 327.73 | 736 | 727 | 200.7 |
| D | 11 | 129 | 5973146 | 32524.76 | 646 | 616 | 183.6 |
| D | 2 | 62 | 634663 | 3452.85 | 646 | 616 | 183.6 |
| D | 15 | 94 | 249437 | 1355.01 | 646 | 616 | 183.6 |
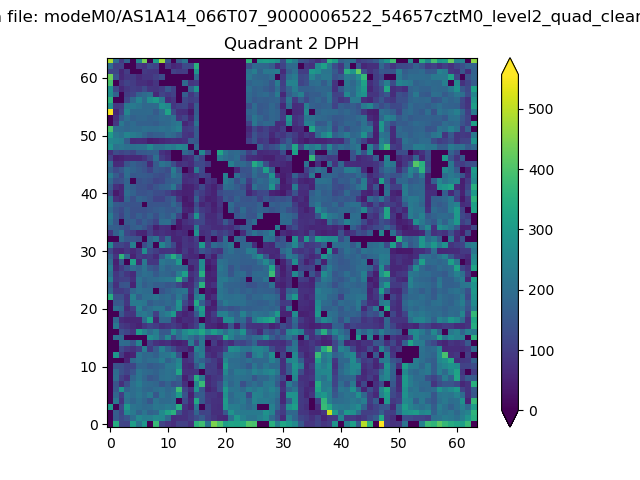
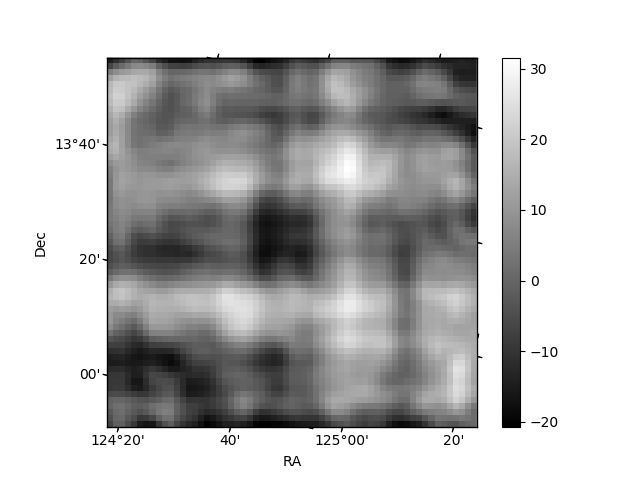
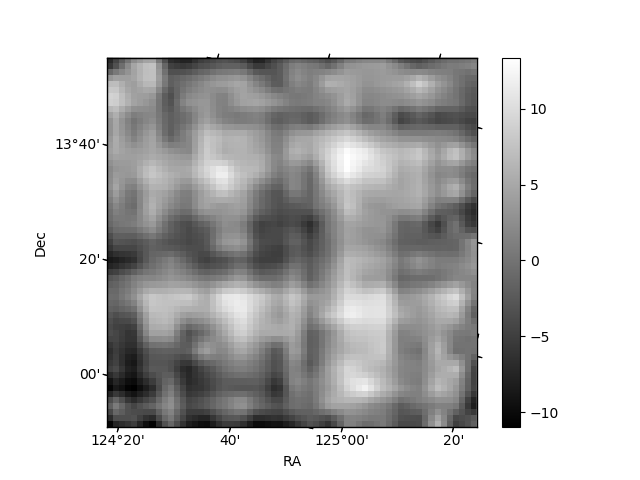
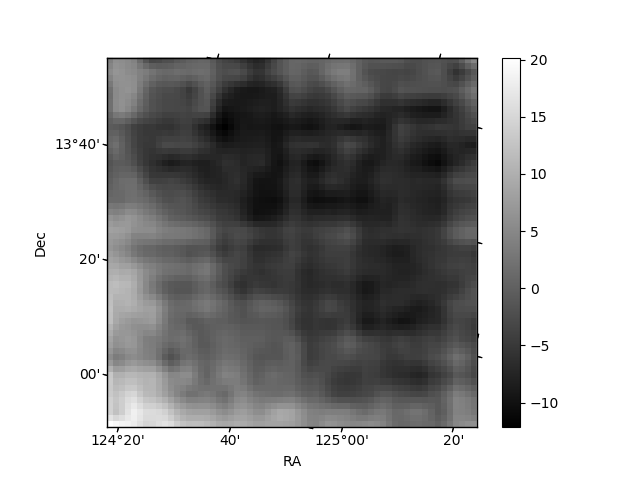
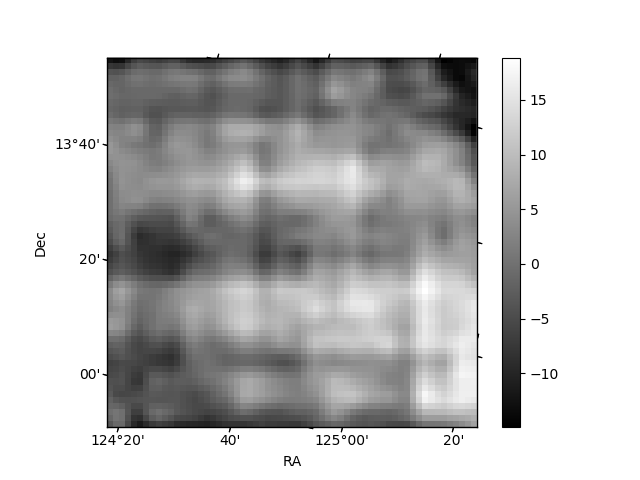
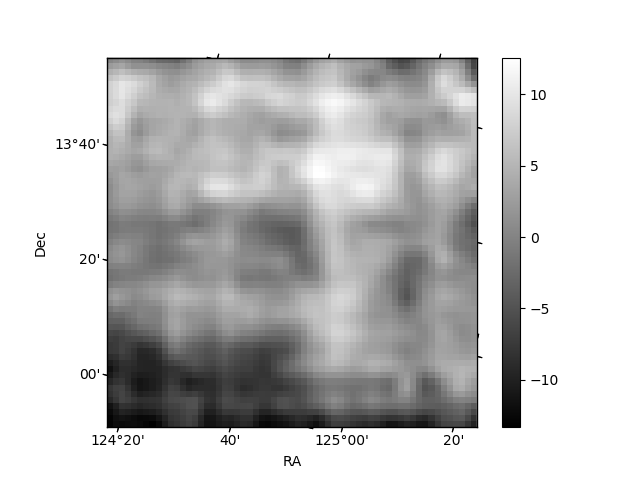
Histogram calculated using DETX and DETY for each event in the final _common_clean file
| Quadrant A | 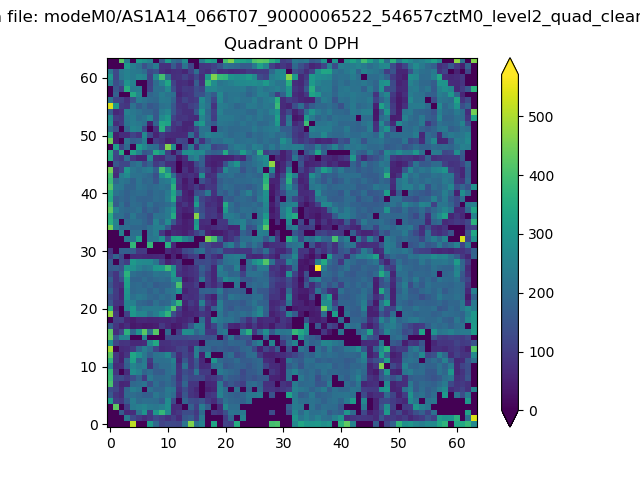 |
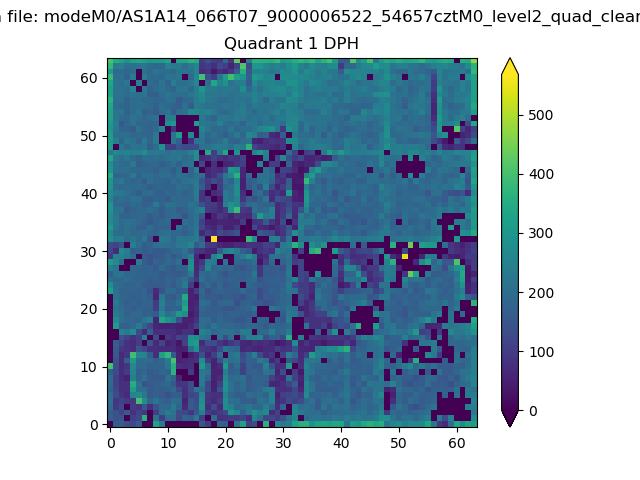 |
Quadrant B |
|---|---|---|---|
| Quadrant D | 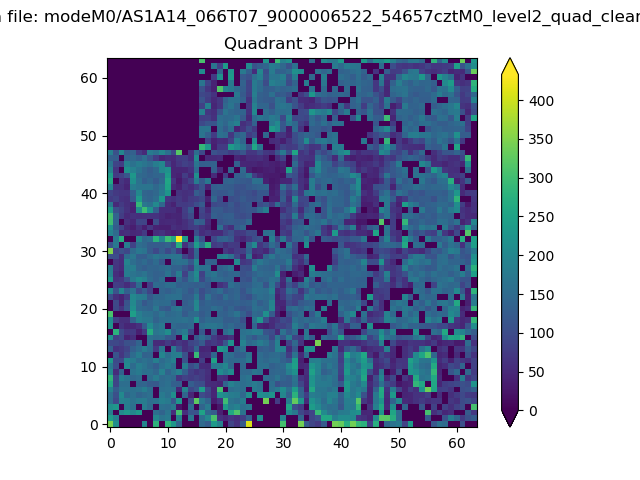 |
 |
Quadrant C |
| Plot type | Count rate plots | Images |
|---|---|---|
| Comparison with Poisson distribution Blue bars denote a histogram of data divided into 1 sec bins. Red curve is a Poisson curve with rate = median count rate of data. |
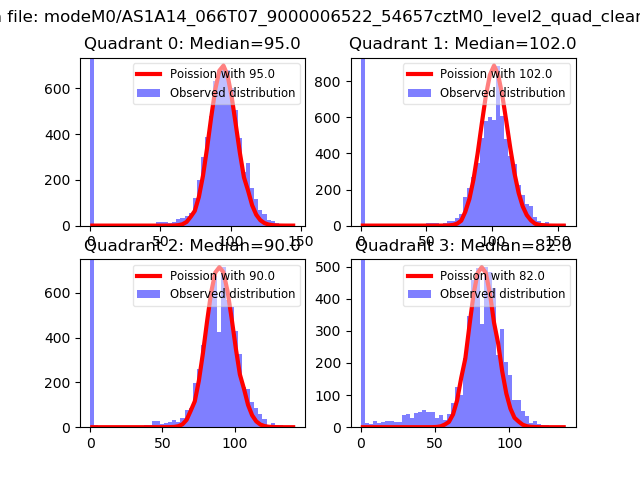 |
 |
| Quadrant-wise count rates Data is divided into 100 sec bins |
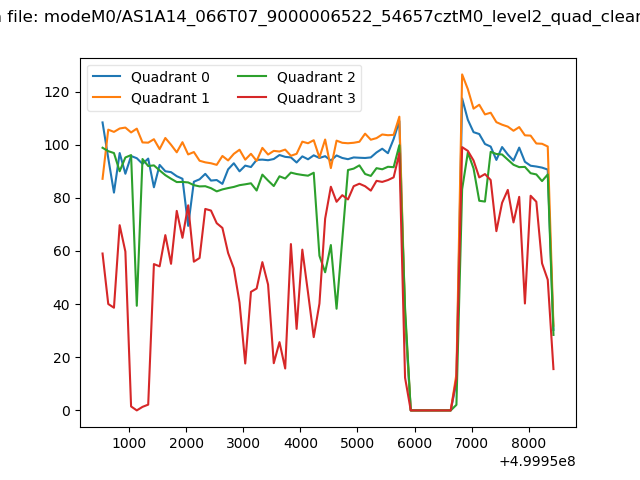 |
|
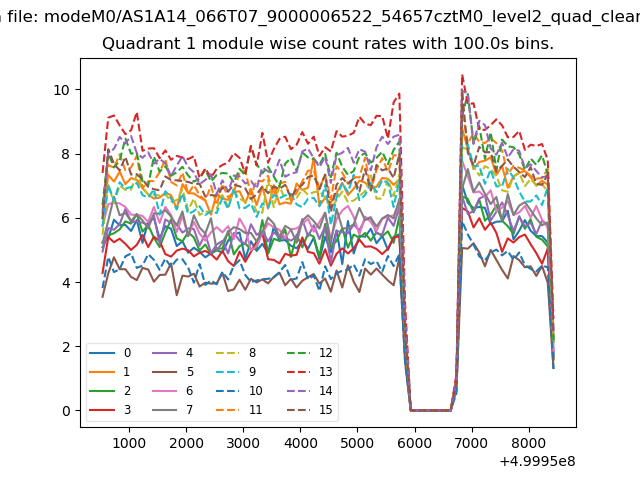
| Module-wise count rates for Quadrant A Data is divided into 100 sec bins |
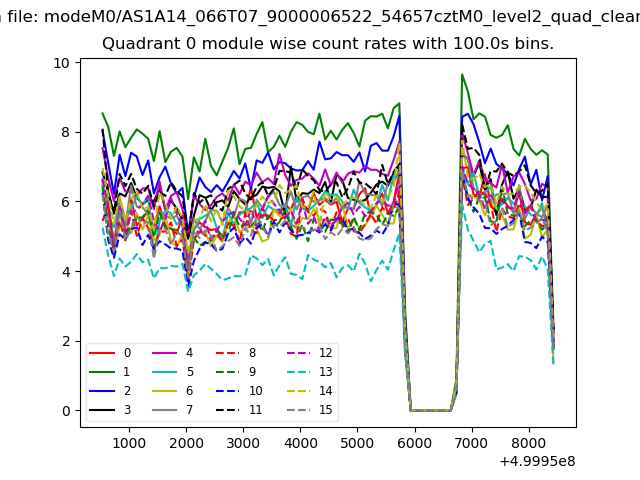 |
 |
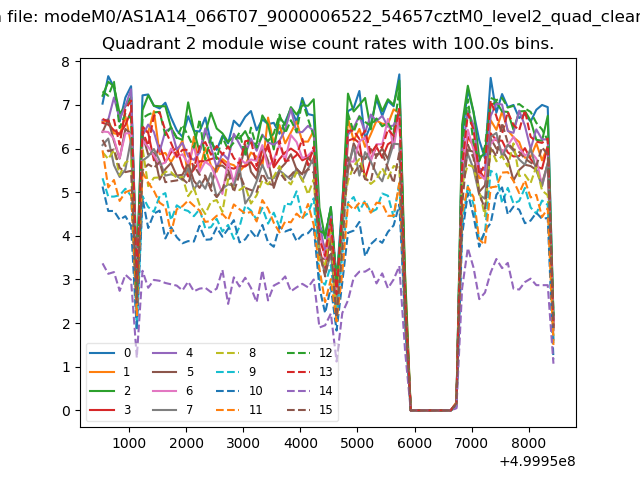
| Module-wise count rates for Quadrant B Data is divided into 100 sec bins |
 |
 |
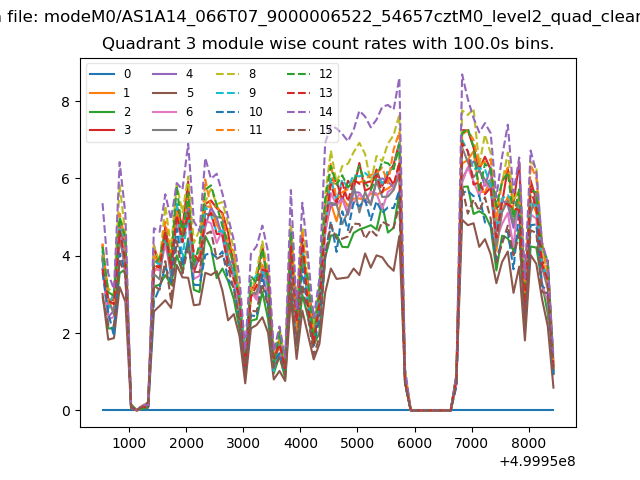
| Module-wise count rates for Quadrant C Data is divided into 100 sec bins |
 |
 |
| Module-wise count rates for Quadrant D Data is divided into 100 sec bins |
 |
 |
| Parameter | Plot |
|---|---|
| CZT HV Monitor | 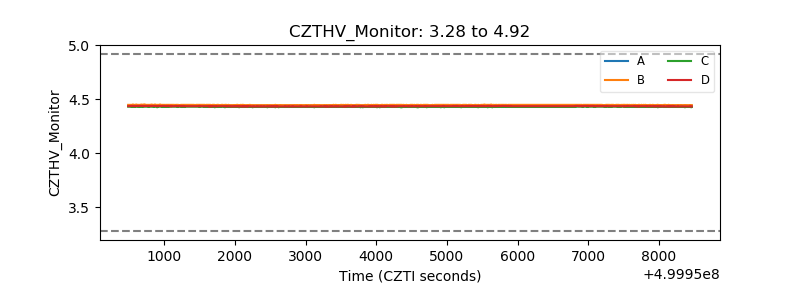 |
| D_VDD | 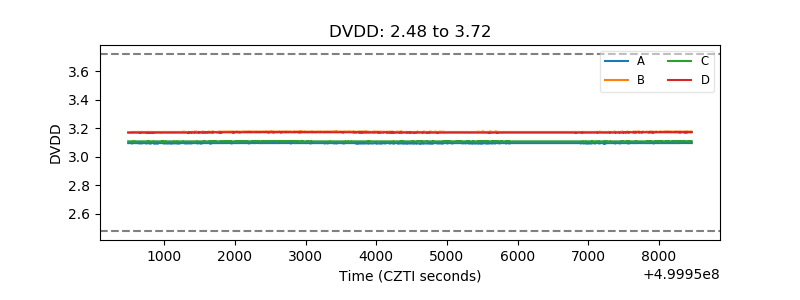 |
| Temperature 1 | 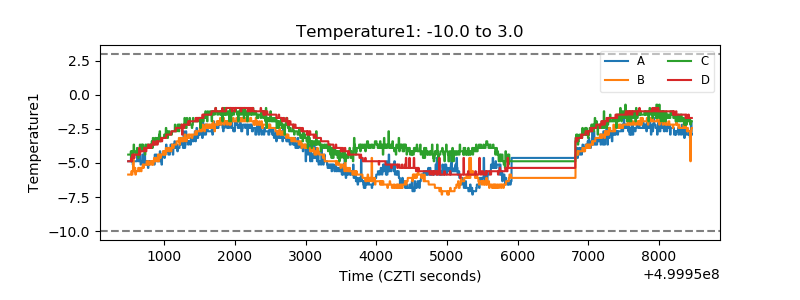 |
| Veto HV Monitor | 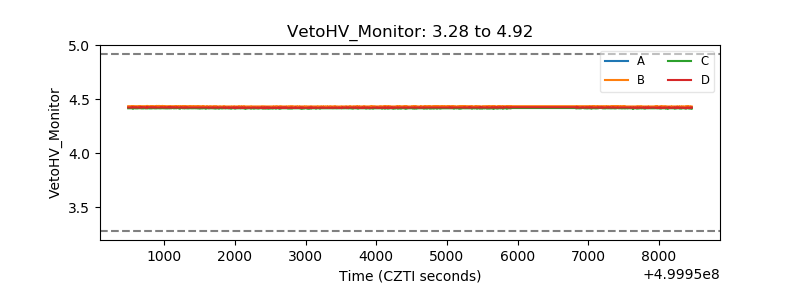 |
| Veto LLD | 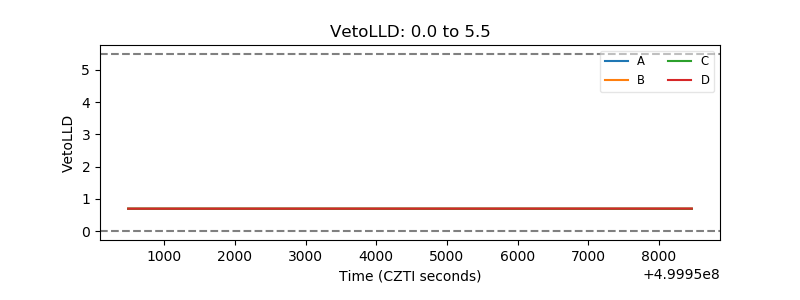 |
| Alpha Counter | 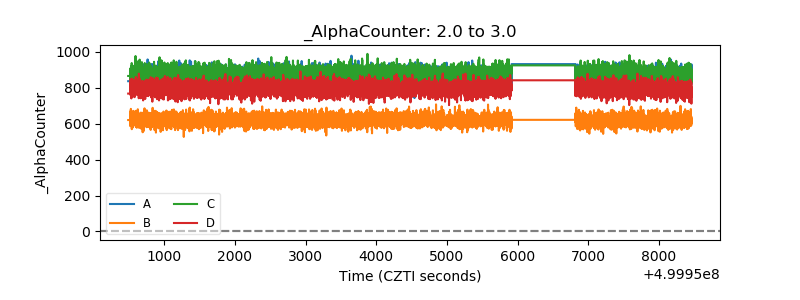 |
| _CPM_Rate | 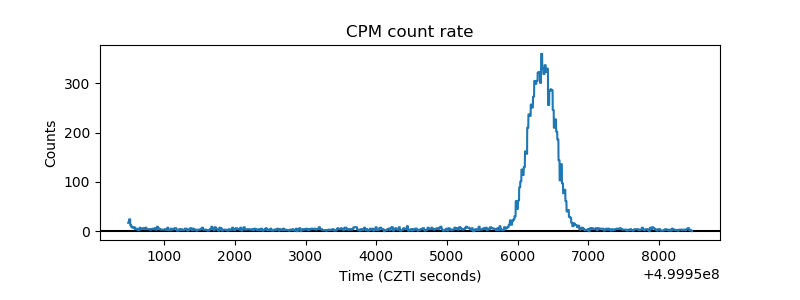 |
| CZT Counter | 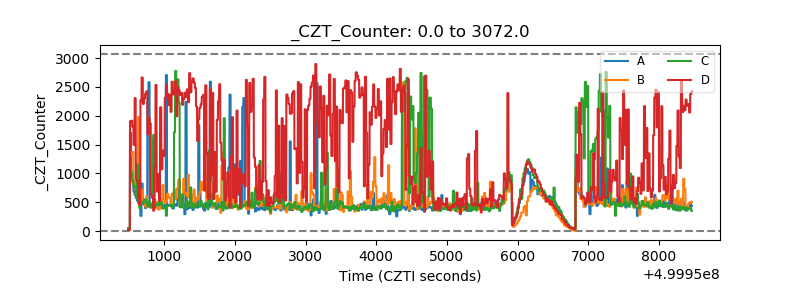 |
| +2.5 Volts monitor |  |
| +5 Volts monitor |  |
| _ROLL_ROT | 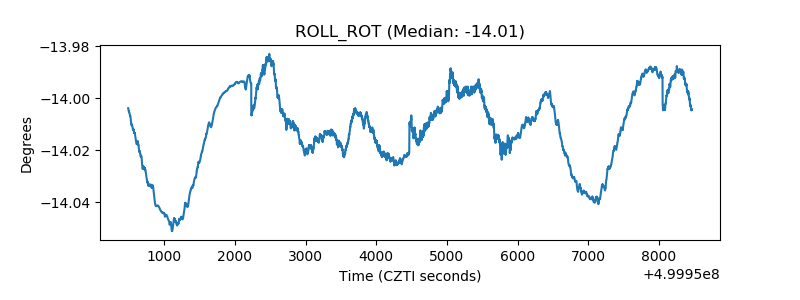 |
| _Roll_DEC | 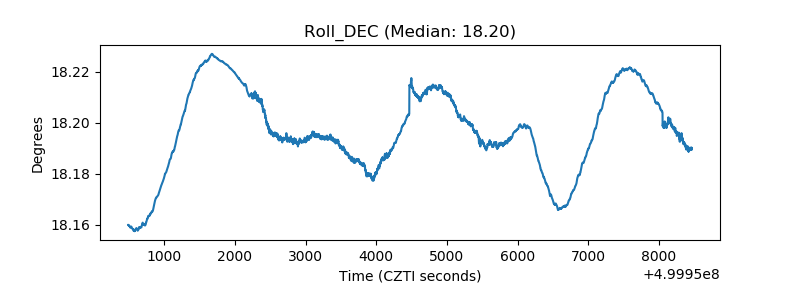 |
| _Roll_RA | 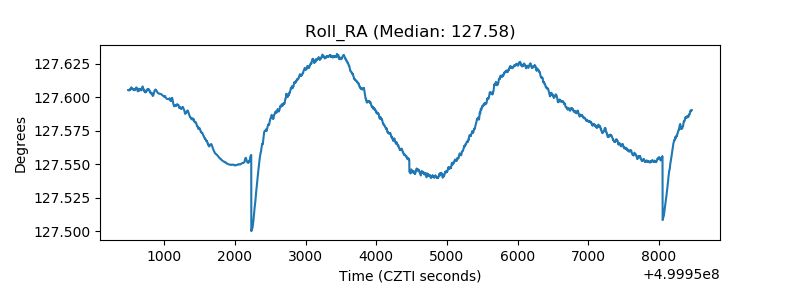 |
| Veto Counter | 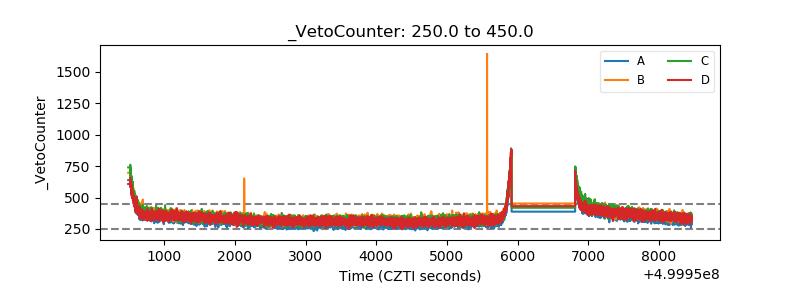 |