| Param | Original file | Final file |
|---|---|---|
| Filename | modeM0/AS1A14_066T07_9000006522_54659cztM0_level2.fits | modeM0/AS1A14_066T07_9000006522_54659cztM0_level2_quad_clean.evt |
| Size (bytes) | 548,951,040 | 91,172,160 |
| Size | 523.5 MB | 86.9 MB |
| Events in quadrant A | 3,421,662 | 628,347 |
| Events in quadrant B | 3,648,265 | 673,374 |
| Events in quadrant C | 3,357,618 | 597,534 |
| Events in quadrant D | 9,388,502 | 408,251 |
| Mode M9 | |||
|---|---|---|---|
| Quadrant | BADHDUFLAG | Total packets | Discarded packets |
| A | 0 | 10 | 0 |
| B | 0 | 10 | 0 |
| C | 0 | 10 | 0 |
| D | 0 | 10 | 0 |
| Mode M0 | |||
|---|---|---|---|
| Quadrant | BADHDUFLAG | Total packets | Discarded packets |
| A | 0 | 14794 | 1 |
| B | 0 | 15117 | 2 |
| C | 0 | 14728 | 1 |
| D | 0 | 32482 | 1 |
| Mode SS | |||
|---|---|---|---|
| Quadrant | BADHDUFLAG | Total packets | Discarded packets |
| A | 0 | 134 | 0 |
| B | 0 | 134 | 0 |
| C | 0 | 134 | 0 |
| D | 0 | 134 | 0 |
| Quadrant | Total seconds | Saturated seconds | Saturation percentage |
|---|---|---|---|
| A | 6488 | 193 | 2.974723% |
| B | 6488 | 125 | 1.926634% |
| C | 6488 | 150 | 2.311961% |
| D | 6488 | 2135 | 32.906905% |
Noise dominated data is calculated using 1-second bins in cleaned event files. If a bin has >2000 counts, and if more than 50% of those come from <1% of pixels, then it is considered to be noise-dominated and hence unusable.
| Quadrant | # 1 sec bins | Bins with >0 counts | Bins with >2000 counts | High rate bins dominated by noise | Noise dominated (total time) | Noise dominated (detector-on time) | Marked lightcurve |
|---|---|---|---|---|---|---|---|
| A | 7528 | 6488 | 98 | 98 | 1.30% | 1.51% | 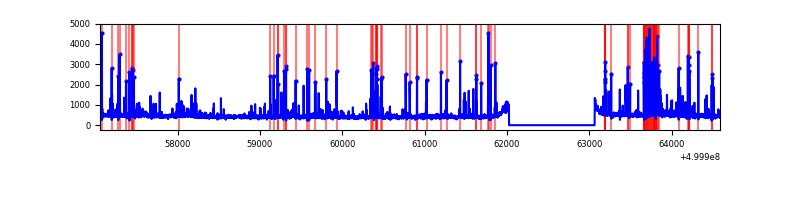 |
| B | 7528 | 6488 | 26 | 26 | 0.35% | 0.40% | 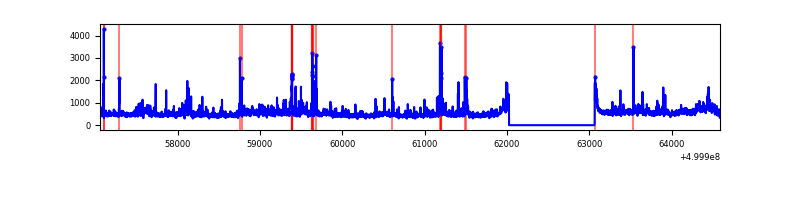 |
| C | 7528 | 6489 | 86 | 86 | 1.14% | 1.33% | 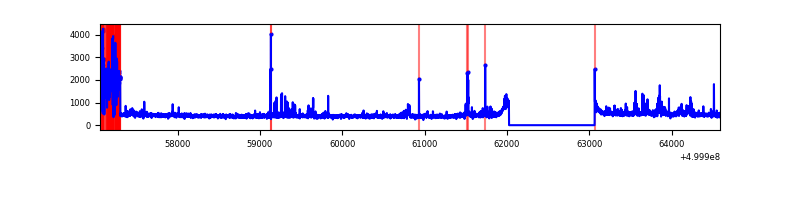 |
| D | 7528 | 6488 | 1802 | 1802 | 23.94% | 27.77% | 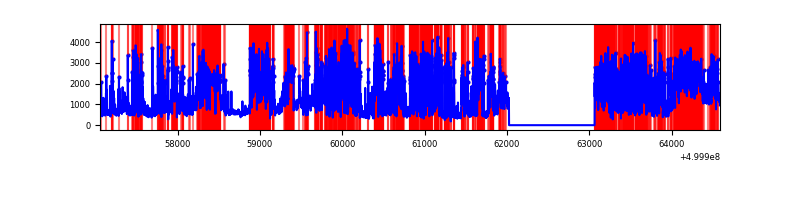 |
Top three noisy pixels from each quadrant. If the there are fewer than three noisy pixels in the level2.evt file, extra rows are filled as -1
| Pixel properties | Quadrant properties | ||||||
|---|---|---|---|---|---|---|---|
| Quadrant | DetID | PixID | Counts | Sigma | Mean | Median | Sigma |
| A | 11 | 3 | 429780 | 2419.47 | 723 | 706 | 177.3 |
| A | 13 | 248 | 103641 | 580.43 | 723 | 706 | 177.3 |
| A | 0 | 8 | 28346 | 155.86 | 723 | 706 | 177.3 |
| B | 5 | 172 | 295660 | 1929.17 | 711 | 685 | 152.9 |
| B | 7 | 0 | 246204 | 1605.72 | 711 | 685 | 152.9 |
| B | 12 | 0 | 120249 | 781.96 | 711 | 685 | 152.9 |
| C | 4 | 5 | 379074 | 1965.49 | 704 | 698 | 192.5 |
| C | 9 | 38 | 72854 | 374.82 | 704 | 698 | 192.5 |
| C | 6 | 223 | 69933 | 359.64 | 704 | 698 | 192.5 |
| D | 11 | 129 | 5435029 | 31825.57 | 601 | 574 | 170.8 |
| D | 2 | 62 | 610087 | 3569.47 | 601 | 574 | 170.8 |
| D | 15 | 94 | 348625 | 2038.28 | 601 | 574 | 170.8 |
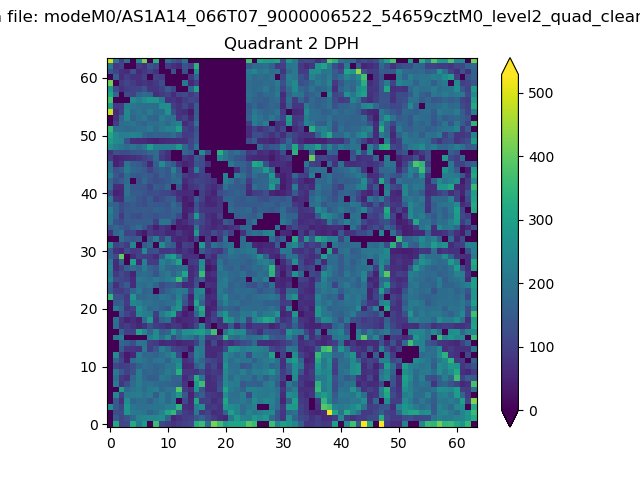
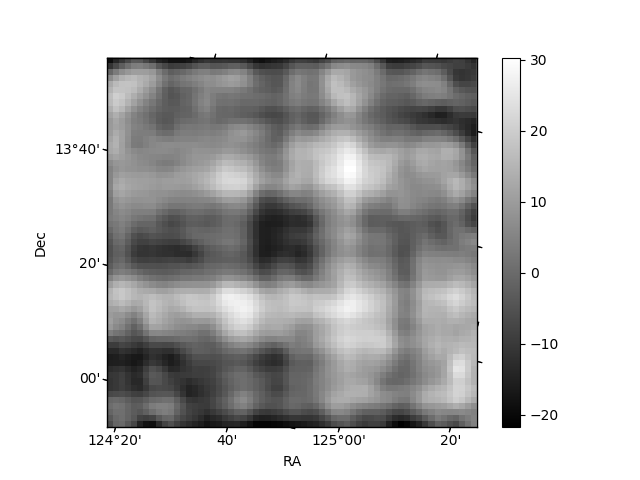
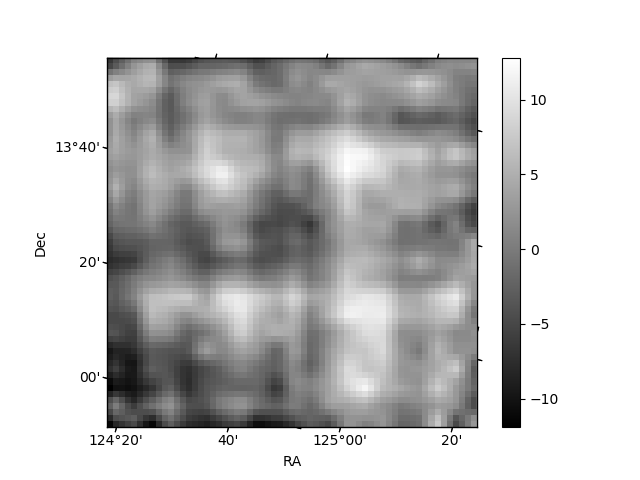
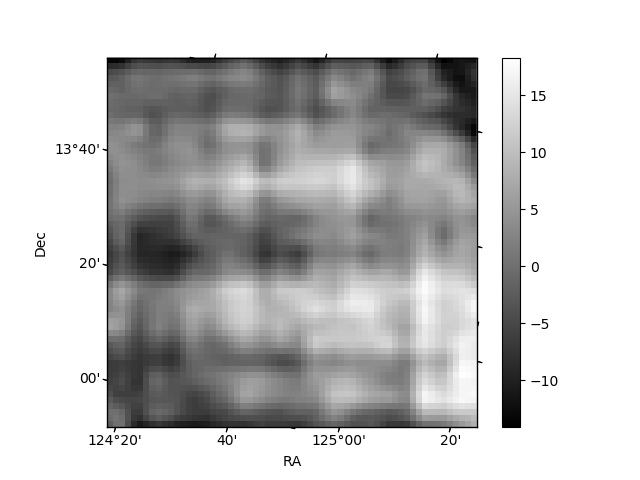
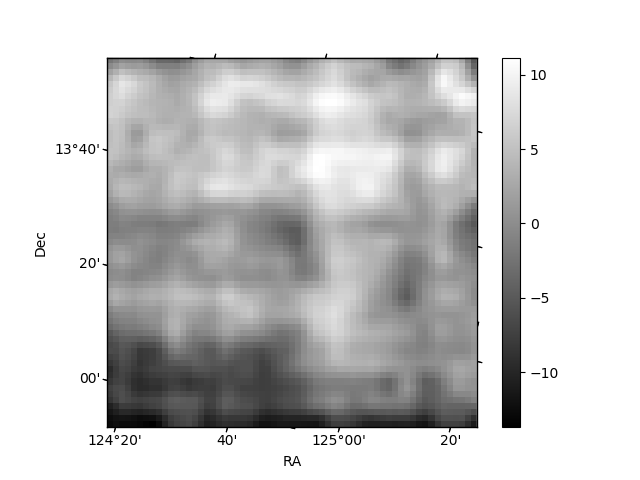
Histogram calculated using DETX and DETY for each event in the final _common_clean file
| Quadrant A | 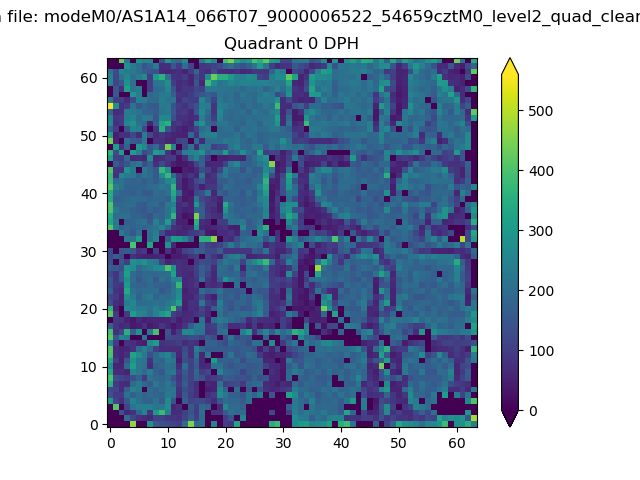 |
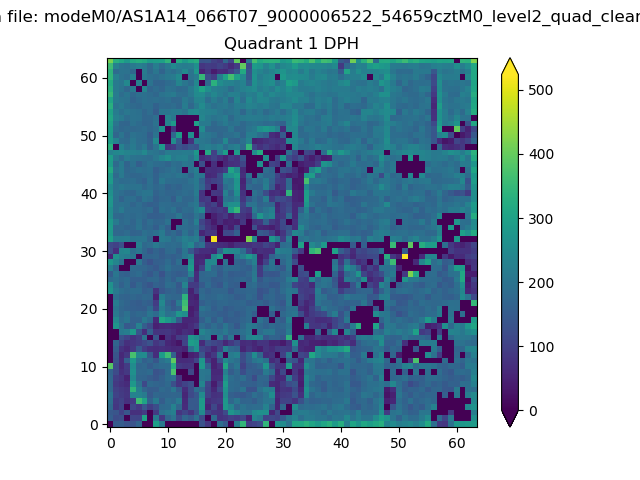 |
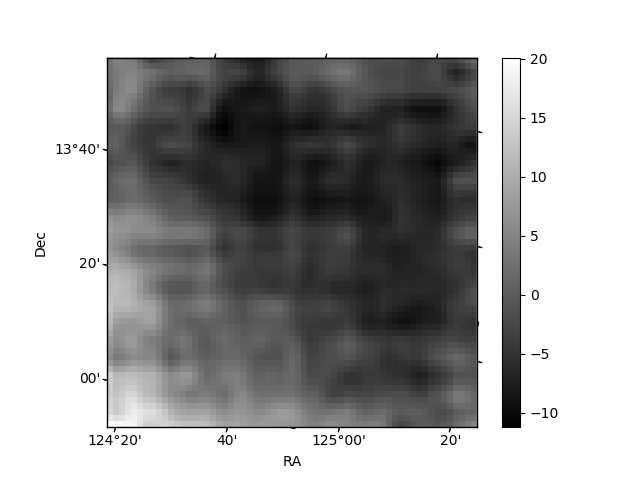
Quadrant B |
|---|---|---|---|
| Quadrant D | 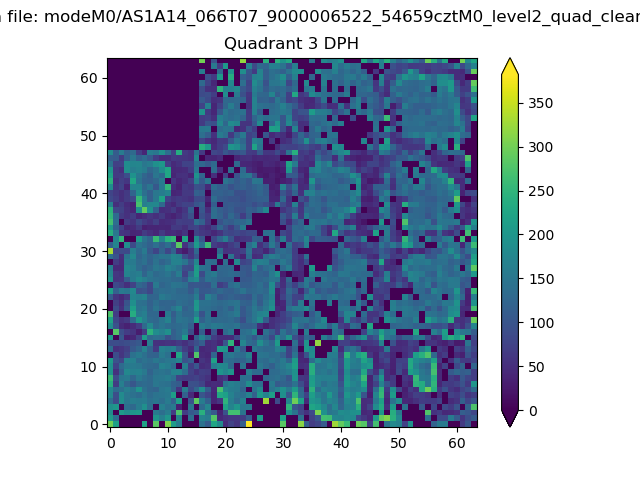 |
 |
Quadrant C |
| Plot type | Count rate plots | Images |
|---|---|---|
| Comparison with Poisson distribution Blue bars denote a histogram of data divided into 1 sec bins. Red curve is a Poisson curve with rate = median count rate of data. |
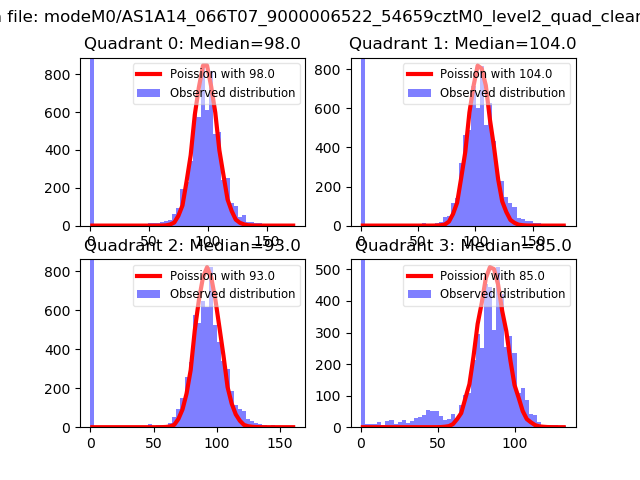 |
 |
| Quadrant-wise count rates Data is divided into 100 sec bins |
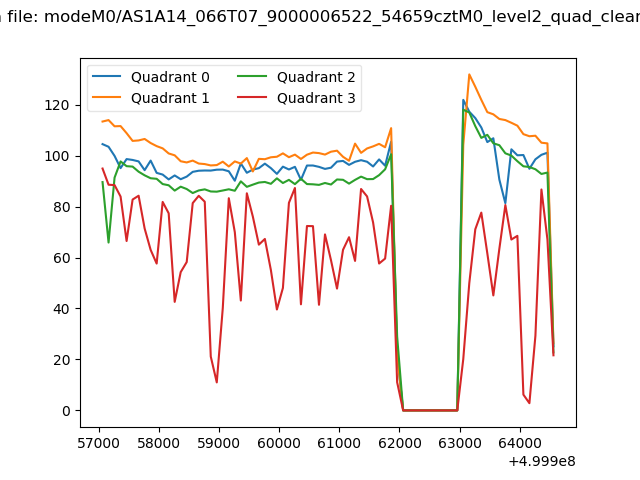 |
|
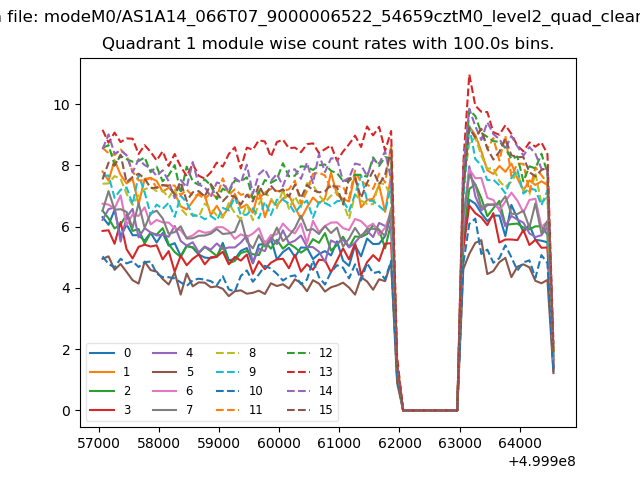
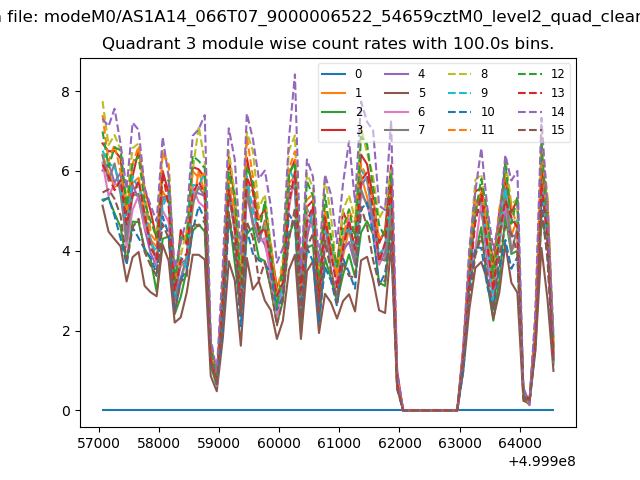
| Module-wise count rates for Quadrant A Data is divided into 100 sec bins |
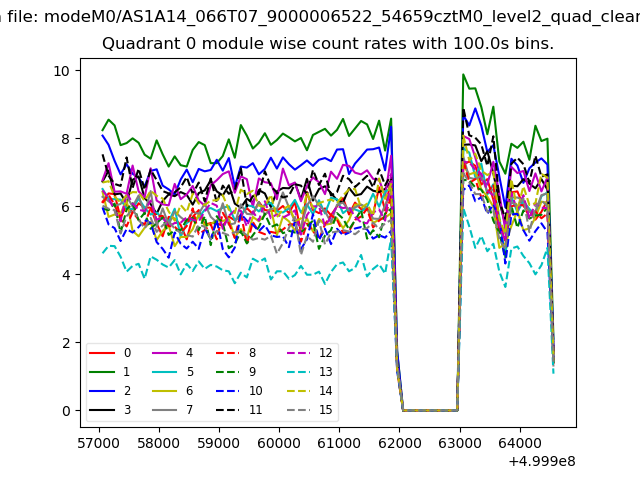 |
 |
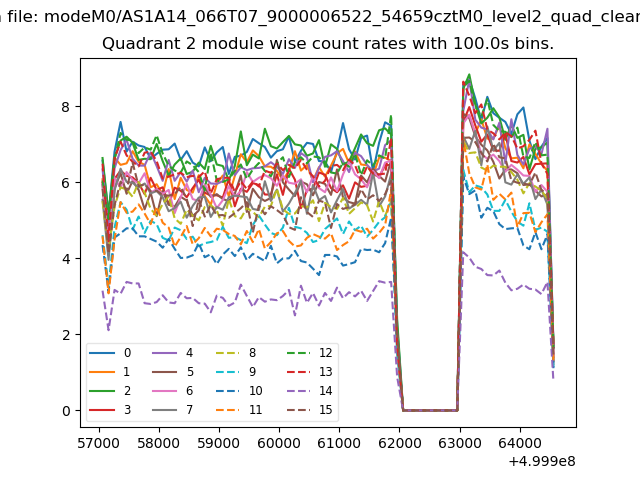
| Module-wise count rates for Quadrant B Data is divided into 100 sec bins |
 |
 |
| Module-wise count rates for Quadrant C Data is divided into 100 sec bins |
 |
 |
| Module-wise count rates for Quadrant D Data is divided into 100 sec bins |
 |
 |
| Parameter | Plot |
|---|---|
| CZT HV Monitor | 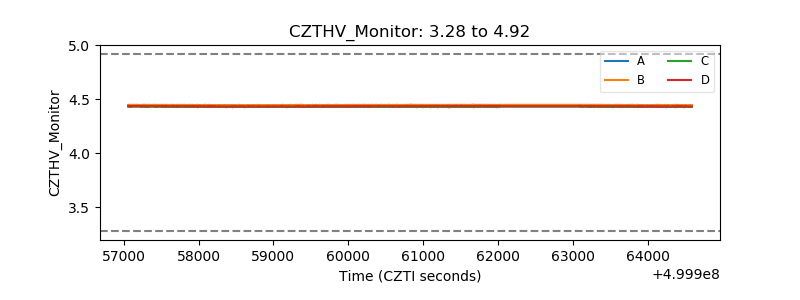 |
| D_VDD | 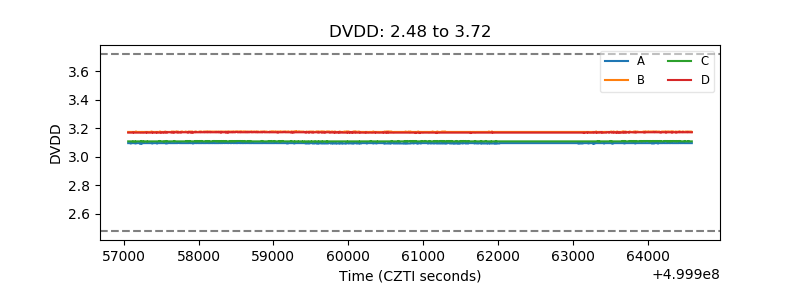 |
| Temperature 1 | 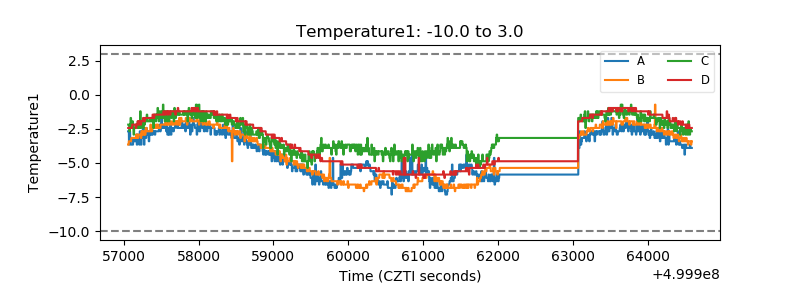 |
| Veto HV Monitor |  |
| Veto LLD | 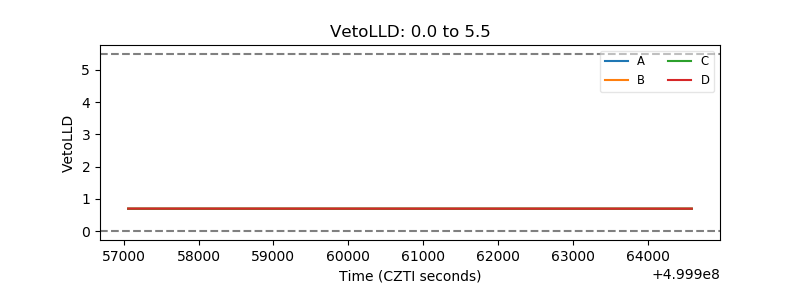 |
| Alpha Counter | 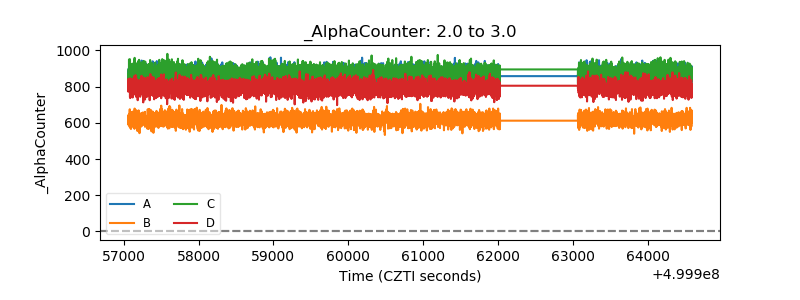 |
| _CPM_Rate | 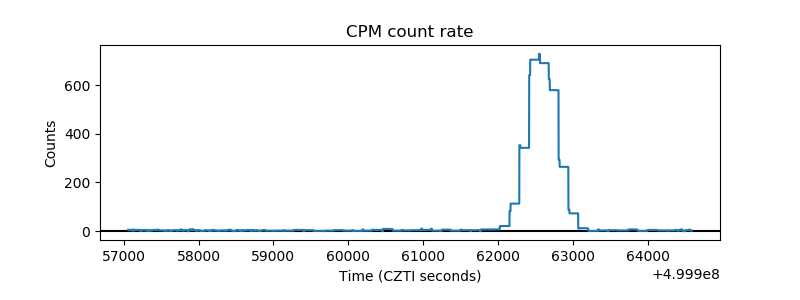 |
| CZT Counter | 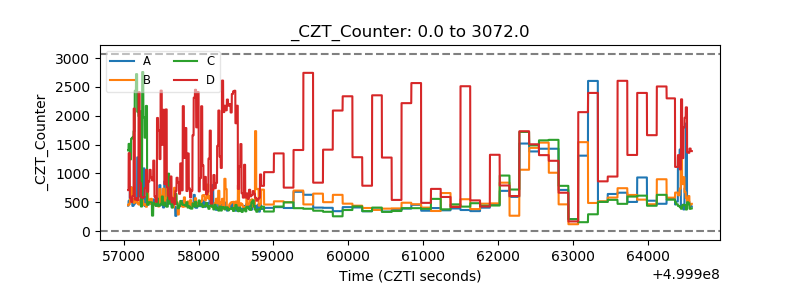 |
| +2.5 Volts monitor | 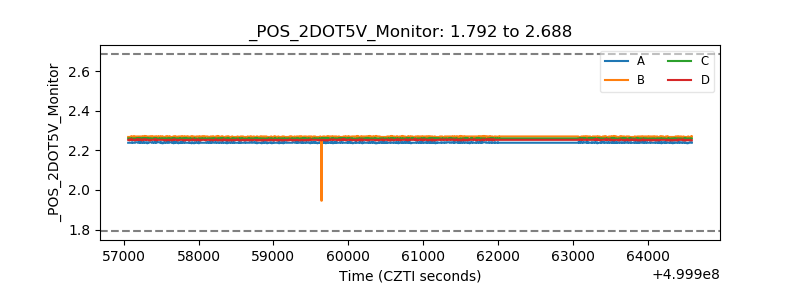 |
| +5 Volts monitor | 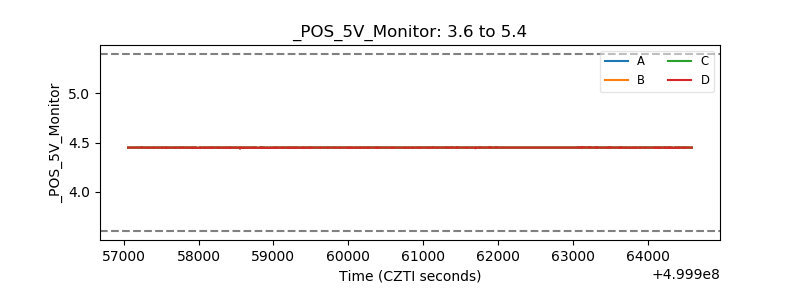 |
| _ROLL_ROT | 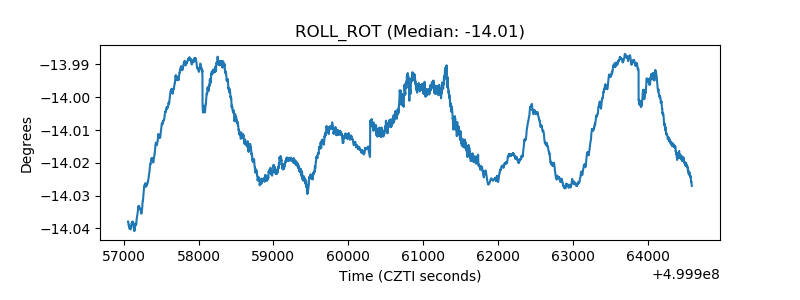 |
| _Roll_DEC | 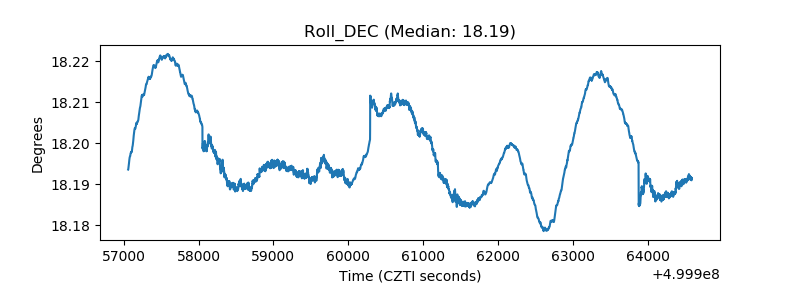 |
| _Roll_RA | 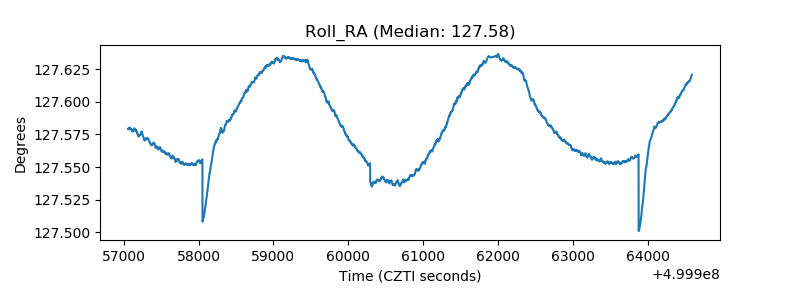 |
| Veto Counter | 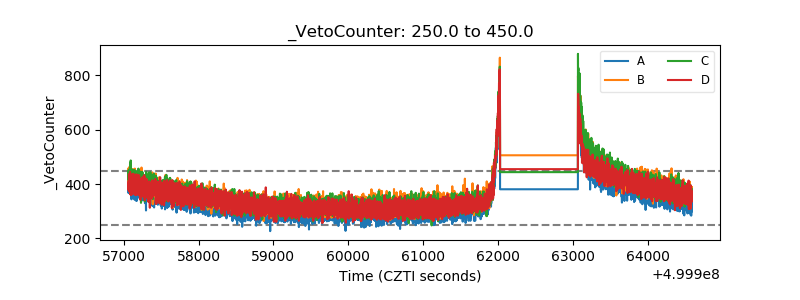 |