| Param | Original file | Final file |
|---|---|---|
| Filename | modeM0/AS1A14_066T07_9000006522_54660cztM0_level2.fits | modeM0/AS1A14_066T07_9000006522_54660cztM0_level2_quad_clean.evt |
| Size (bytes) | 621,074,880 | 92,684,160 |
| Size | 592.3 MB | 88.4 MB |
| Events in quadrant A | 3,511,450 | 658,762 |
| Events in quadrant B | 3,597,827 | 708,488 |
| Events in quadrant C | 4,140,597 | 609,299 |
| Events in quadrant D | 11,233,661 | 374,619 |
| Mode M9 | |||
|---|---|---|---|
| Quadrant | BADHDUFLAG | Total packets | Discarded packets |
| A | 0 | 12 | 0 |
| B | 0 | 13 | 0 |
| C | 0 | 13 | 0 |
| D | 0 | 13 | 0 |
| Mode M0 | |||
|---|---|---|---|
| Quadrant | BADHDUFLAG | Total packets | Discarded packets |
| A | 0 | 14977 | 2 |
| B | 0 | 15137 | 2 |
| C | 0 | 16848 | 2 |
| D | 0 | 37953 | 2 |
| Mode SS | |||
|---|---|---|---|
| Quadrant | BADHDUFLAG | Total packets | Discarded packets |
| A | 0 | 132 | 0 |
| B | 0 | 132 | 0 |
| C | 0 | 132 | 0 |
| D | 0 | 132 | 0 |
| Quadrant | Total seconds | Saturated seconds | Saturation percentage |
|---|---|---|---|
| A | 6525 | 201 | 3.080460% |
| B | 6525 | 133 | 2.038314% |
| C | 6525 | 366 | 5.609195% |
| D | 6525 | 2800 | 42.911877% |
Noise dominated data is calculated using 1-second bins in cleaned event files. If a bin has >2000 counts, and if more than 50% of those come from <1% of pixels, then it is considered to be noise-dominated and hence unusable.
| Quadrant | # 1 sec bins | Bins with >0 counts | Bins with >2000 counts | High rate bins dominated by noise | Noise dominated (total time) | Noise dominated (detector-on time) | Marked lightcurve |
|---|---|---|---|---|---|---|---|
| A | 7670 | 6525 | 95 | 95 | 1.24% | 1.46% | 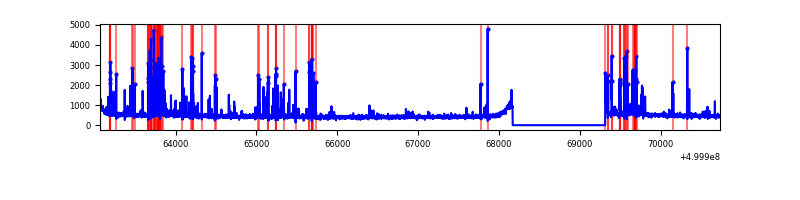 |
| B | 7670 | 6525 | 20 | 20 | 0.26% | 0.31% | 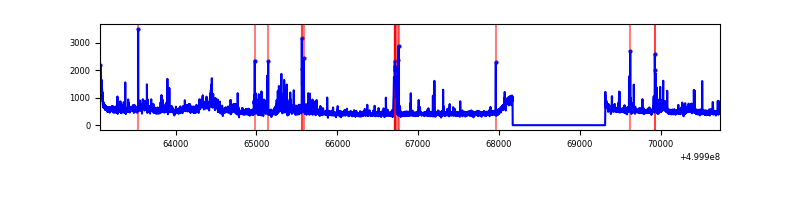 |
| C | 7670 | 6526 | 257 | 257 | 3.35% | 3.94% | 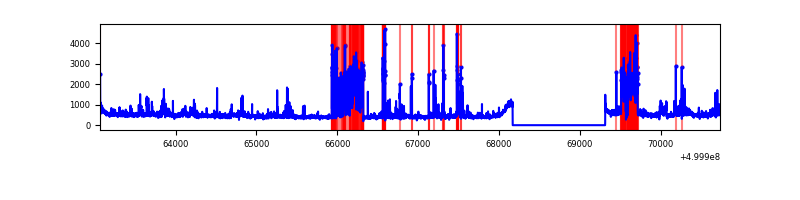 |
| D | 7670 | 6525 | 2407 | 2407 | 31.38% | 36.89% | 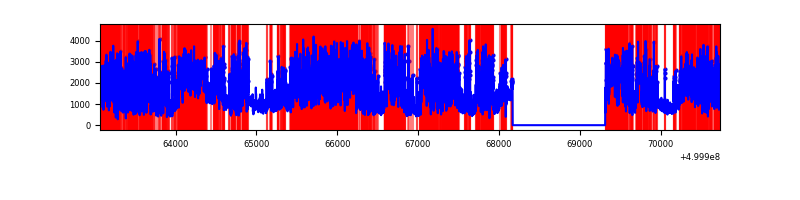 |
Top three noisy pixels from each quadrant. If the there are fewer than three noisy pixels in the level2.evt file, extra rows are filled as -1
| Pixel properties | Quadrant properties | ||||||
|---|---|---|---|---|---|---|---|
| Quadrant | DetID | PixID | Counts | Sigma | Mean | Median | Sigma |
| A | 11 | 3 | 298856 | 1623.61 | 750 | 733 | 183.6 |
| A | 13 | 248 | 203810 | 1105.98 | 750 | 733 | 183.6 |
| A | 7 | 14 | 40482 | 216.48 | 750 | 733 | 183.6 |
| B | 5 | 172 | 187270 | 1163.14 | 742 | 717 | 160.4 |
| B | 7 | 0 | 159263 | 988.52 | 742 | 717 | 160.4 |
| B | 5 | 185 | 61236 | 377.33 | 742 | 717 | 160.4 |
| C | 14 | 254 | 458439 | 2317.04 | 724 | 719 | 197.5 |
| C | 13 | 3 | 322701 | 1629.91 | 724 | 719 | 197.5 |
| C | 9 | 38 | 202329 | 1020.57 | 724 | 719 | 197.5 |
| D | 11 | 129 | 6127220 | 36052.45 | 595 | 567 | 169.9 |
| D | 2 | 172 | 1553964 | 9141.01 | 595 | 567 | 169.9 |
| D | 2 | 62 | 714688 | 4202.26 | 595 | 567 | 169.9 |
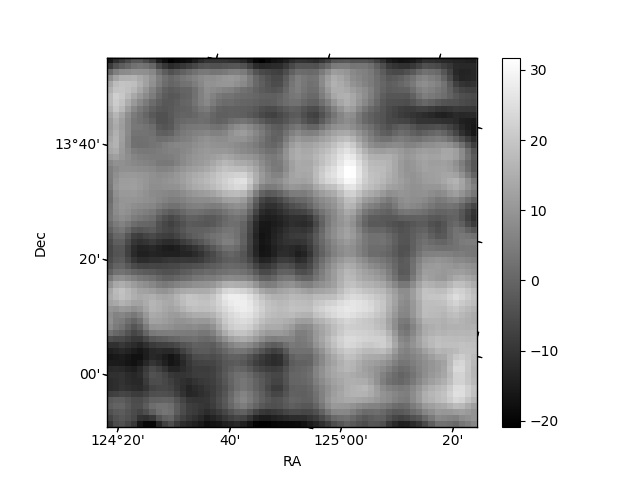
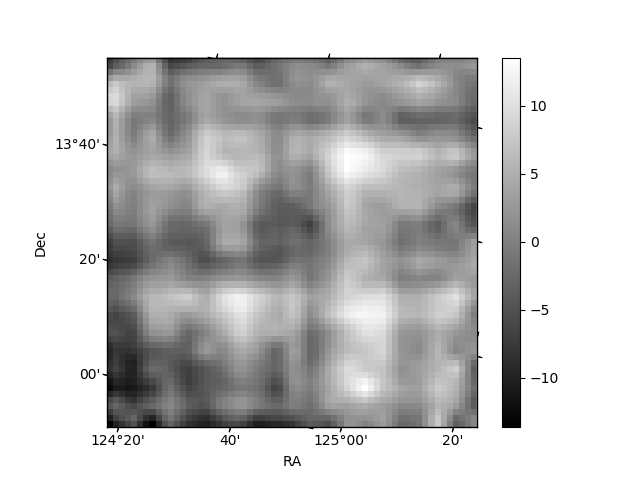
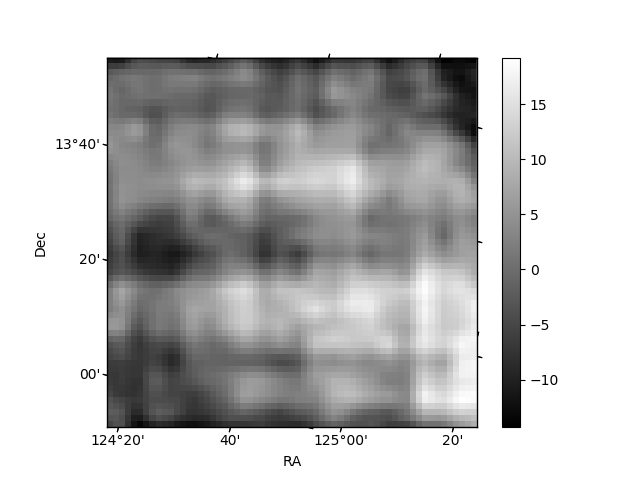
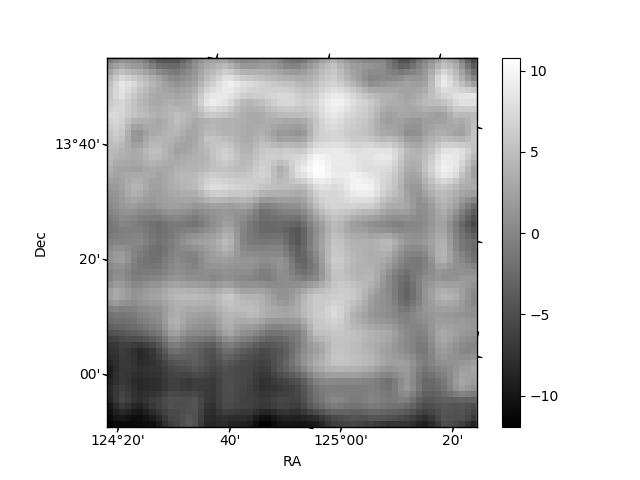
Histogram calculated using DETX and DETY for each event in the final _common_clean file
| Quadrant A | 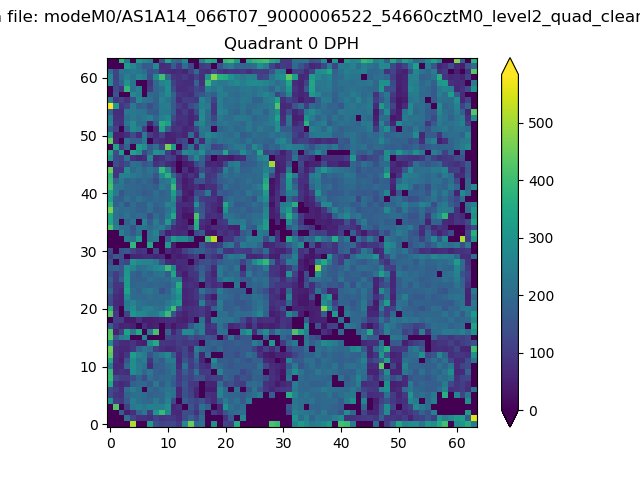 |
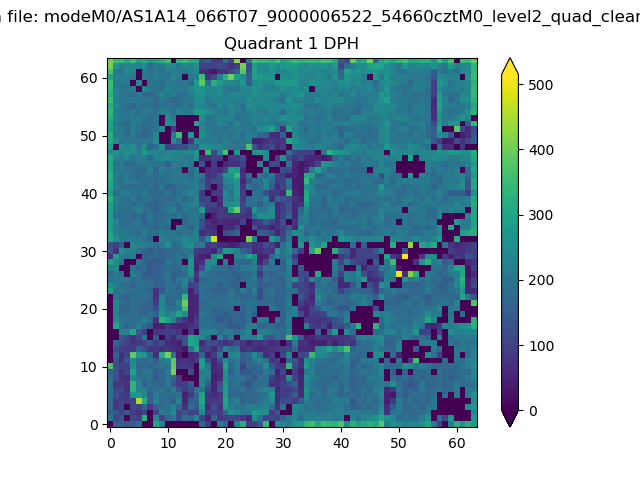 |
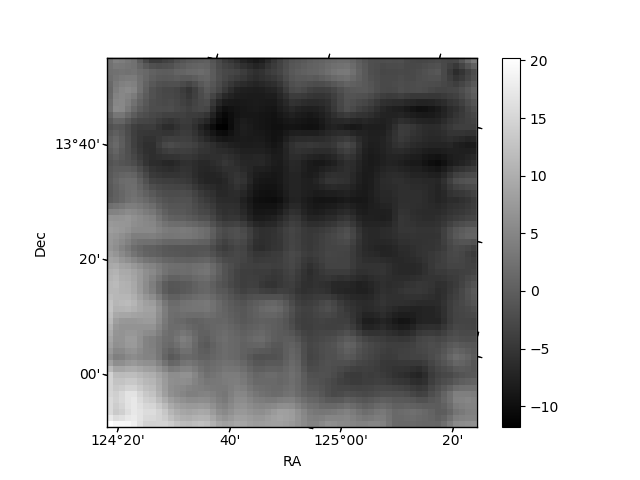
Quadrant B |
|---|---|---|---|
| Quadrant D | 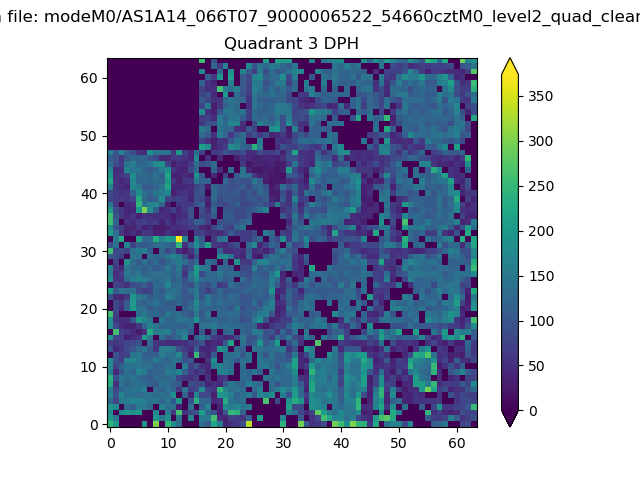 |
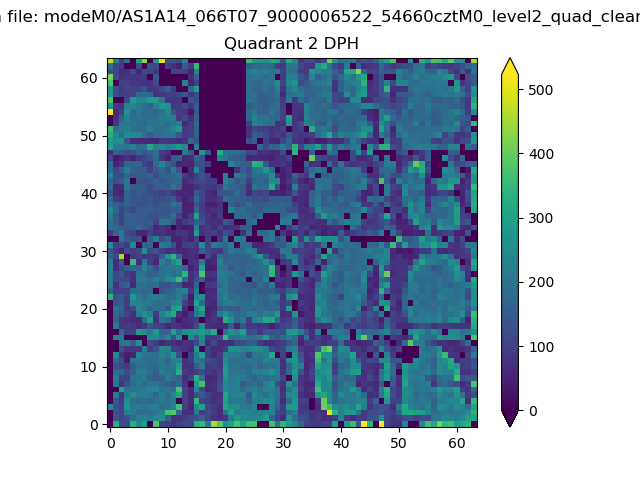 |
Quadrant C |
| Plot type | Count rate plots | Images |
|---|---|---|
| Comparison with Poisson distribution Blue bars denote a histogram of data divided into 1 sec bins. Red curve is a Poisson curve with rate = median count rate of data. |
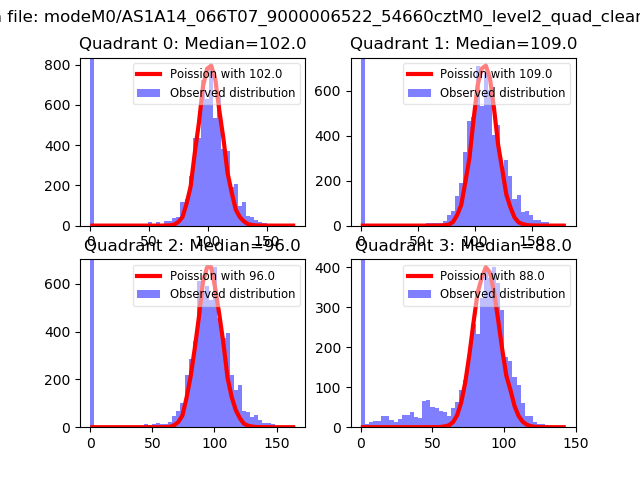 |
 |
| Quadrant-wise count rates Data is divided into 100 sec bins |
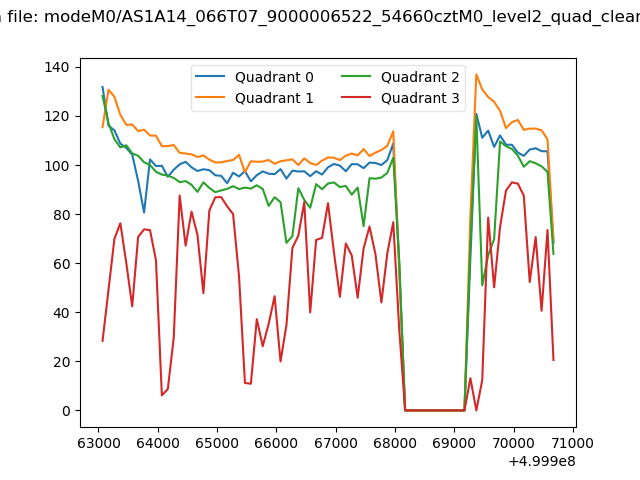 |
|
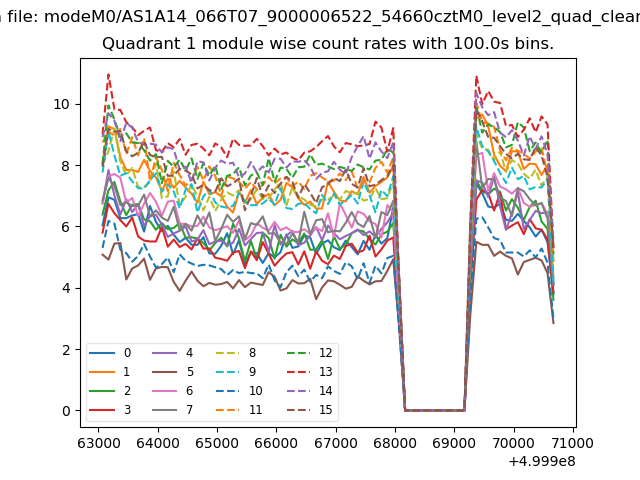
| Module-wise count rates for Quadrant A Data is divided into 100 sec bins |
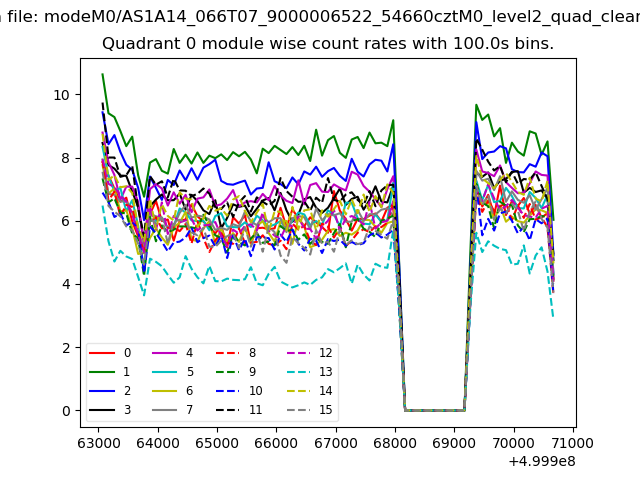 |
 |
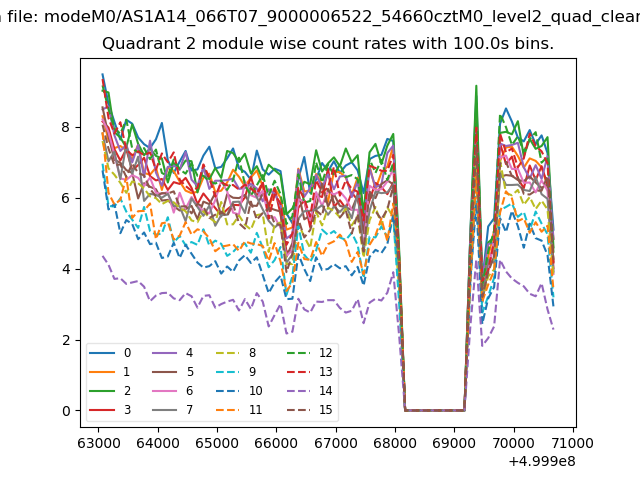
| Module-wise count rates for Quadrant B Data is divided into 100 sec bins |
 |
 |
| Module-wise count rates for Quadrant C Data is divided into 100 sec bins |
 |
 |
| Module-wise count rates for Quadrant D Data is divided into 100 sec bins |
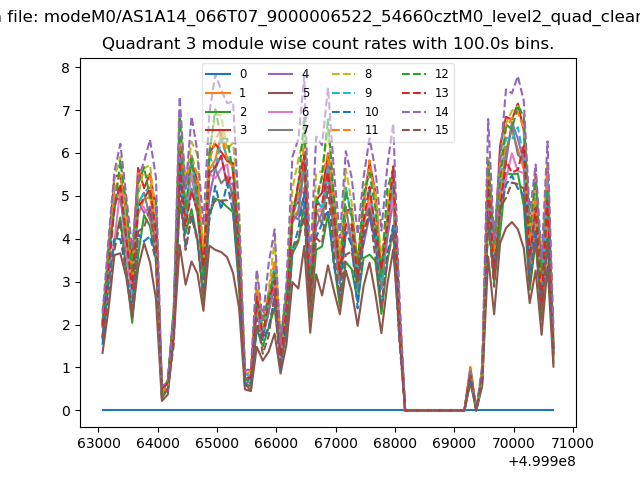 |
 |
| Parameter | Plot |
|---|---|
| CZT HV Monitor | 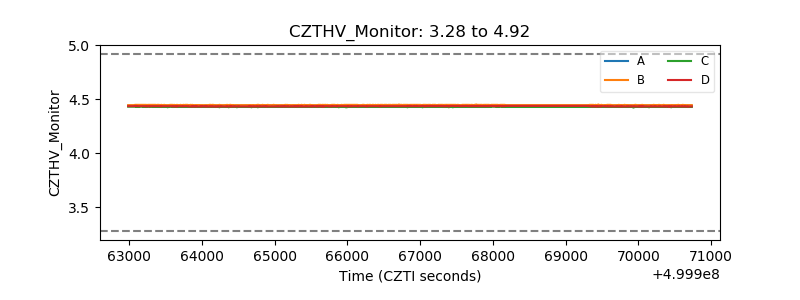 |
| D_VDD | 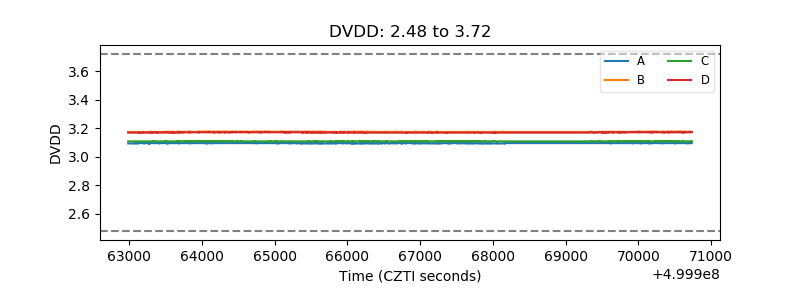 |
| Temperature 1 | 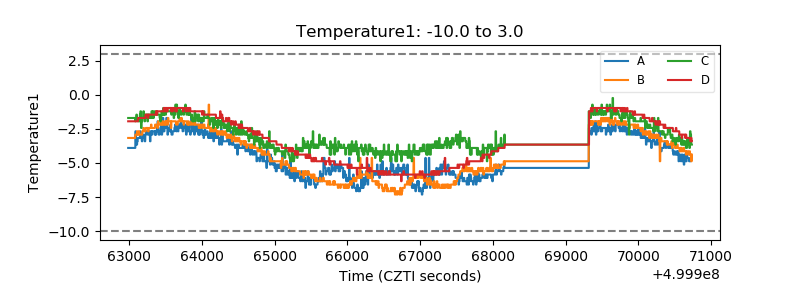 |
| Veto HV Monitor | 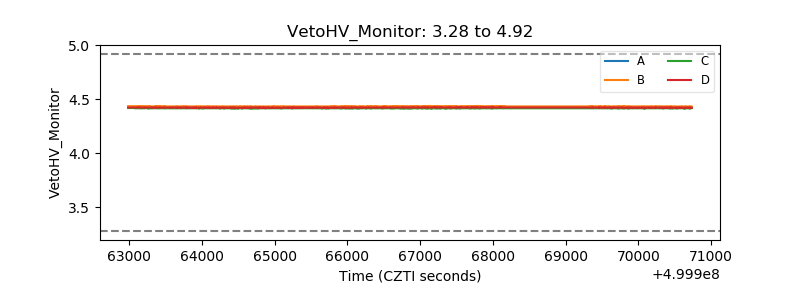 |
| Veto LLD | 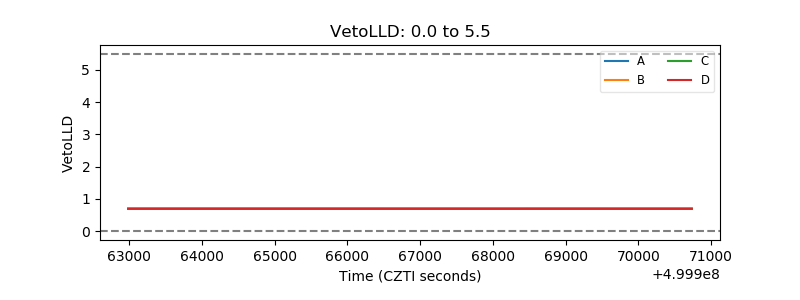 |
| Alpha Counter | 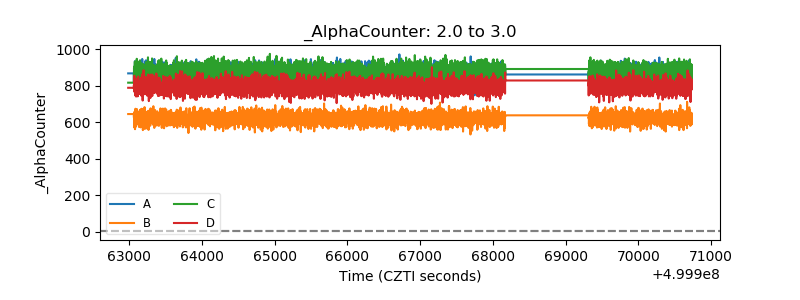 |
| _CPM_Rate | 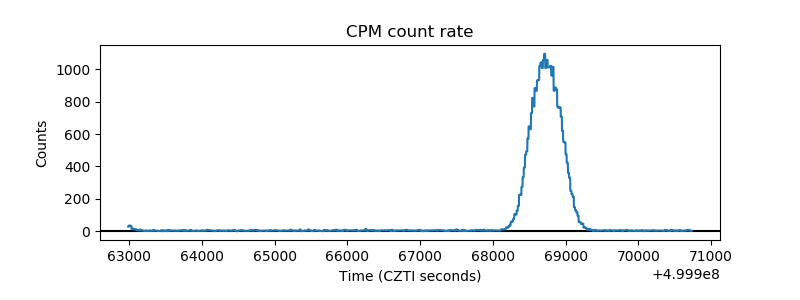 |
| CZT Counter | 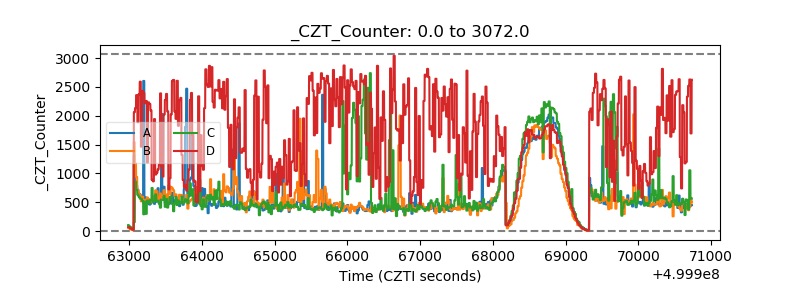 |
| +2.5 Volts monitor |  |
| +5 Volts monitor |  |
| _ROLL_ROT | 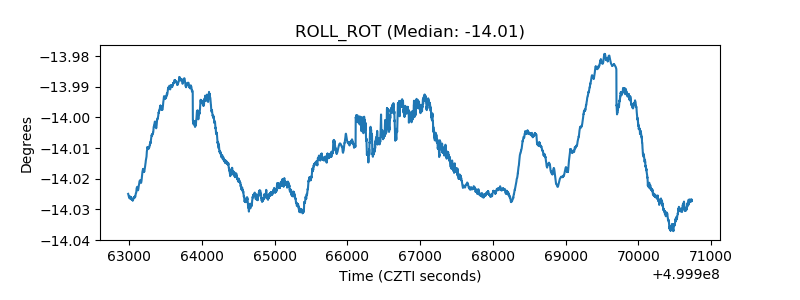 |
| _Roll_DEC | 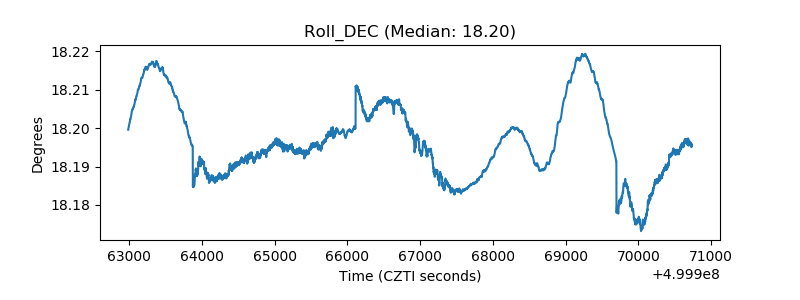 |
| _Roll_RA | 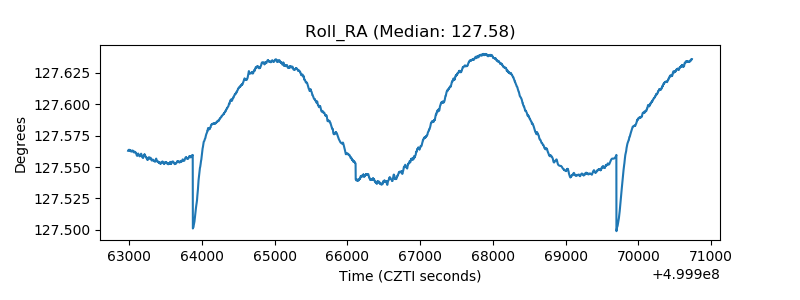 |
| Veto Counter | 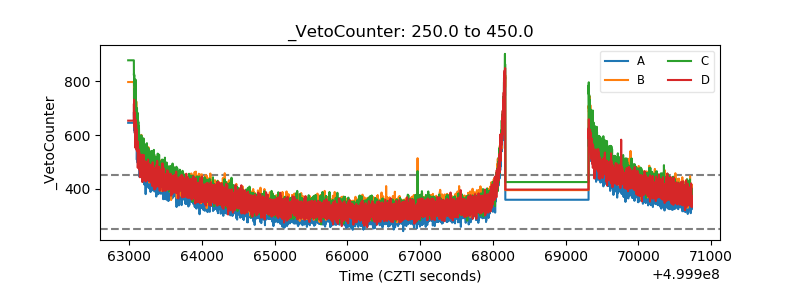 |