| Param | Original file | Final file |
|---|---|---|
| Filename | modeM0/AS1A14_066T07_9000006522_54661cztM0_level2.fits | modeM0/AS1A14_066T07_9000006522_54661cztM0_level2_quad_clean.evt |
| Size (bytes) | 610,493,760 | 90,659,520 |
| Size | 582.2 MB | 86.5 MB |
| Events in quadrant A | 3,898,655 | 653,767 |
| Events in quadrant B | 3,320,208 | 714,254 |
| Events in quadrant C | 3,594,028 | 622,640 |
| Events in quadrant D | 11,286,656 | 306,827 |
| Mode M9 | |||
|---|---|---|---|
| Quadrant | BADHDUFLAG | Total packets | Discarded packets |
| A | 0 | 18 | 0 |
| B | 0 | 18 | 0 |
| C | 0 | 19 | 0 |
| D | 0 | 19 | 0 |
| Mode M0 | |||
|---|---|---|---|
| Quadrant | BADHDUFLAG | Total packets | Discarded packets |
| A | 0 | 16021 | 2 |
| B | 0 | 14409 | 2 |
| C | 0 | 15156 | 2 |
| D | 0 | 37960 | 8 |
| Mode SS | |||
|---|---|---|---|
| Quadrant | BADHDUFLAG | Total packets | Discarded packets |
| A | 0 | 130 | 0 |
| B | 0 | 130 | 0 |
| C | 0 | 130 | 0 |
| D | 0 | 130 | 0 |
| Quadrant | Total seconds | Saturated seconds | Saturation percentage |
|---|---|---|---|
| A | 6419 | 311 | 4.844991% |
| B | 6419 | 100 | 1.557875% |
| C | 6419 | 212 | 3.302695% |
| D | 6418 | 3362 | 52.383920% |
Noise dominated data is calculated using 1-second bins in cleaned event files. If a bin has >2000 counts, and if more than 50% of those come from <1% of pixels, then it is considered to be noise-dominated and hence unusable.
| Quadrant | # 1 sec bins | Bins with >0 counts | Bins with >2000 counts | High rate bins dominated by noise | Noise dominated (total time) | Noise dominated (detector-on time) | Marked lightcurve |
|---|---|---|---|---|---|---|---|
| A | 7619 | 6420 | 212 | 212 | 2.78% | 3.30% | 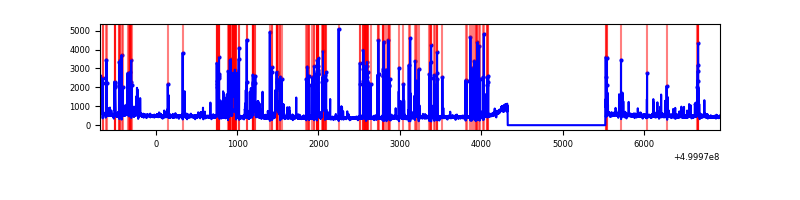 |
| B | 7619 | 6420 | 14 | 14 | 0.18% | 0.22% | 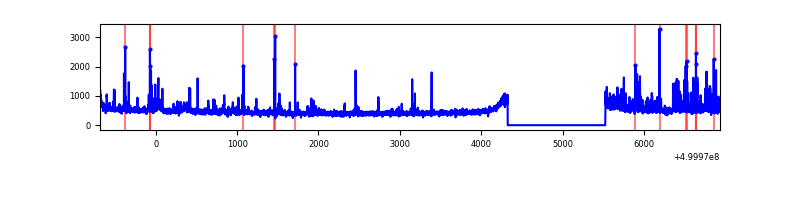 |
| C | 7619 | 6420 | 116 | 116 | 1.52% | 1.81% | 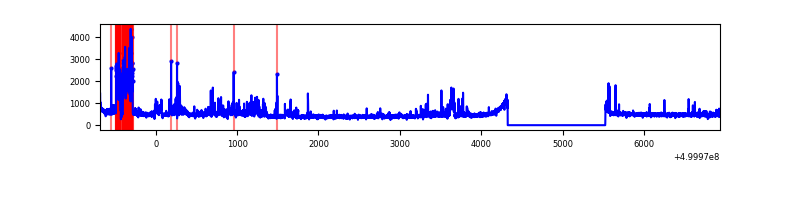 |
| D | 7617 | 6417 | 2806 | 2806 | 36.84% | 43.73% | 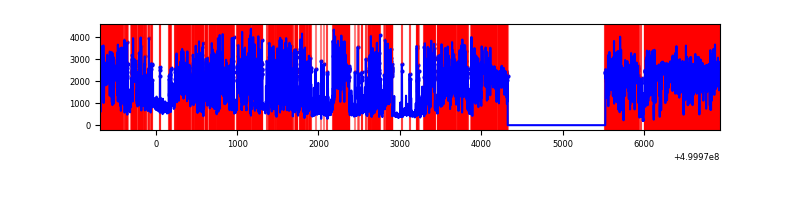 |
Top three noisy pixels from each quadrant. If the there are fewer than three noisy pixels in the level2.evt file, extra rows are filled as -1
| Pixel properties | Quadrant properties | ||||||
|---|---|---|---|---|---|---|---|
| Quadrant | DetID | PixID | Counts | Sigma | Mean | Median | Sigma |
| A | 11 | 3 | 478800 | 2659.6 | 735 | 717 | 179.8 |
| A | 13 | 248 | 258832 | 1435.91 | 735 | 717 | 179.8 |
| A | 7 | 14 | 198797 | 1101.93 | 735 | 717 | 179.8 |
| B | 5 | 172 | 209586 | 1308.58 | 736 | 709 | 159.6 |
| B | 5 | 185 | 66155 | 410.01 | 736 | 709 | 159.6 |
| B | 10 | 247 | 36491 | 224.17 | 736 | 709 | 159.6 |
| C | 9 | 38 | 332354 | 1662.21 | 724 | 715 | 199.5 |
| C | 13 | 3 | 225303 | 1125.66 | 724 | 715 | 199.5 |
| C | 4 | 5 | 143749 | 716.9 | 724 | 715 | 199.5 |
| D | 11 | 129 | 6905539 | 49013.94 | 495 | 474 | 140.9 |
| D | 2 | 172 | 823717 | 5843.59 | 495 | 474 | 140.9 |
| D | 0 | 19 | 508452 | 3605.76 | 495 | 474 | 140.9 |
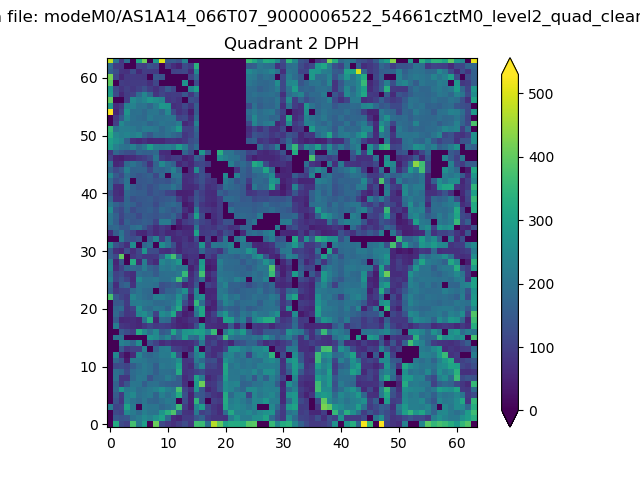
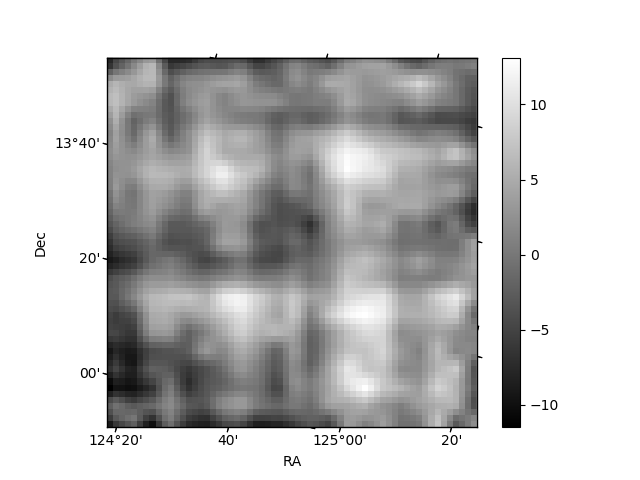
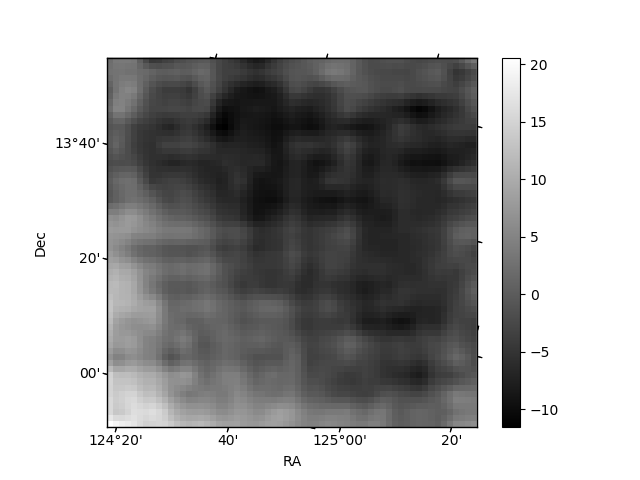
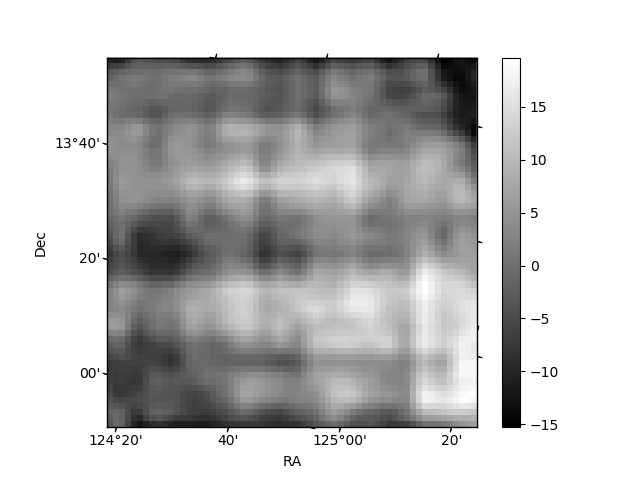
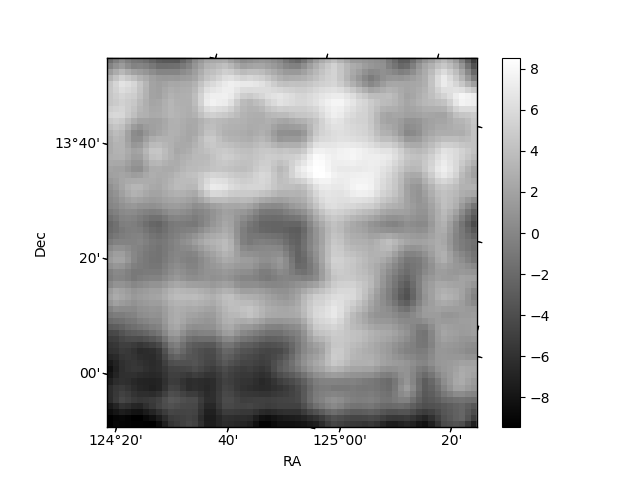
Histogram calculated using DETX and DETY for each event in the final _common_clean file
| Quadrant A | 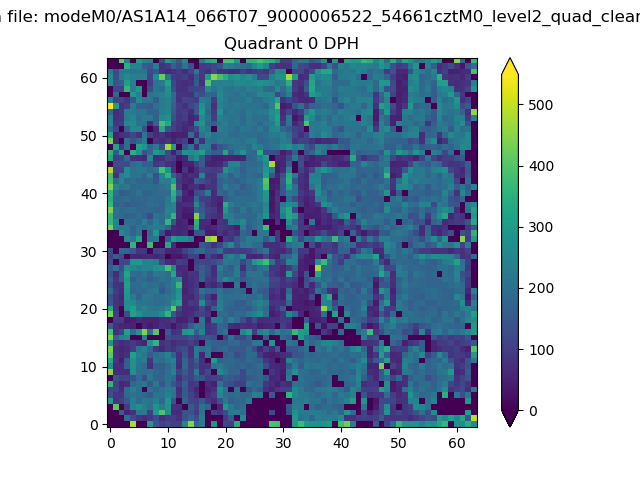 |
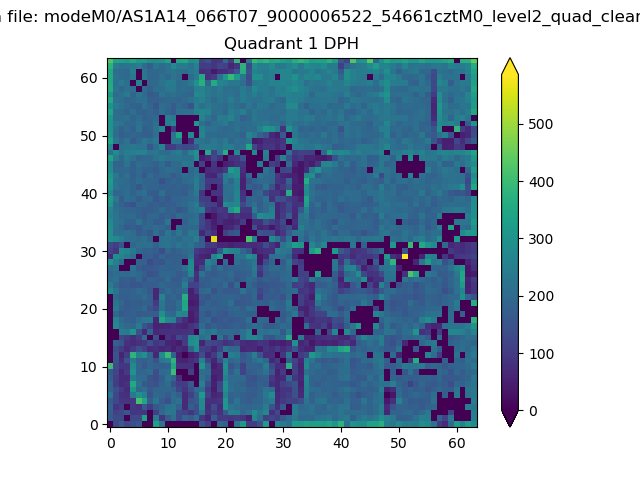 |
Quadrant B |
|---|---|---|---|
| Quadrant D | 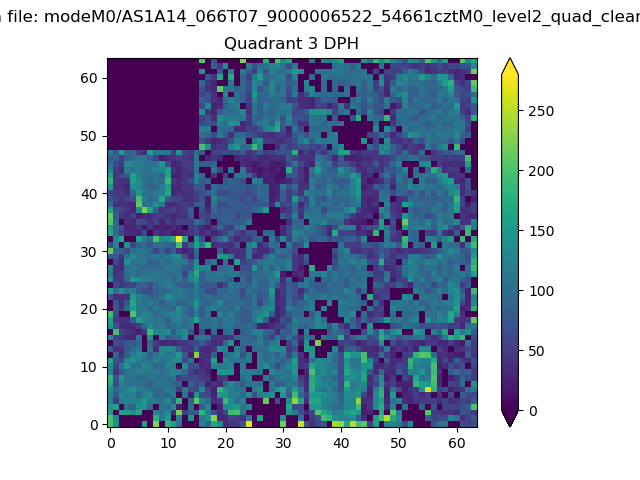 |
 |
Quadrant C |
| Plot type | Count rate plots | Images |
|---|---|---|
| Comparison with Poisson distribution Blue bars denote a histogram of data divided into 1 sec bins. Red curve is a Poisson curve with rate = median count rate of data. |
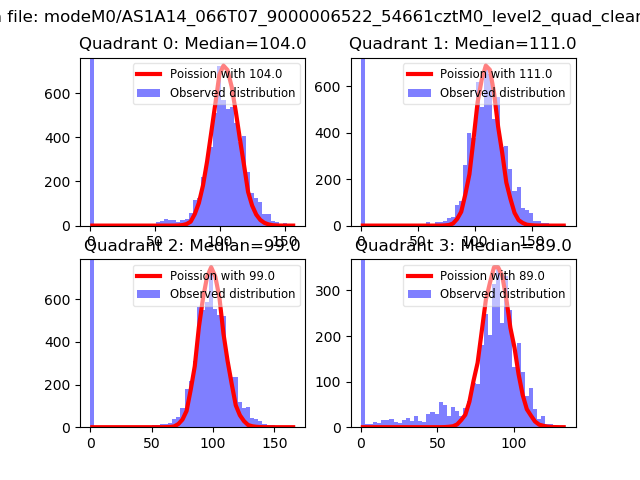 |
 |
| Quadrant-wise count rates Data is divided into 100 sec bins |
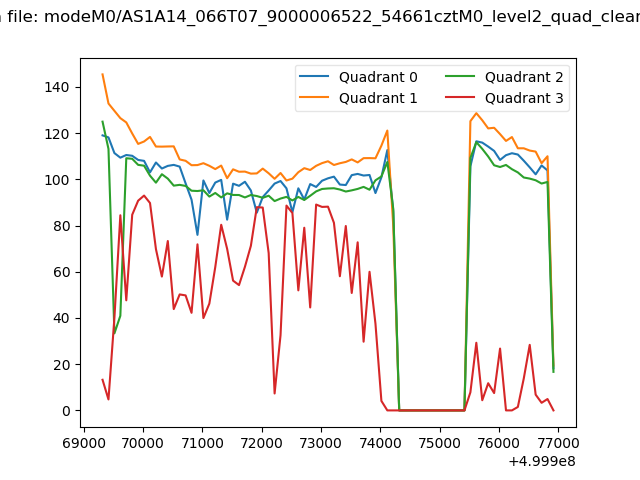 |
|
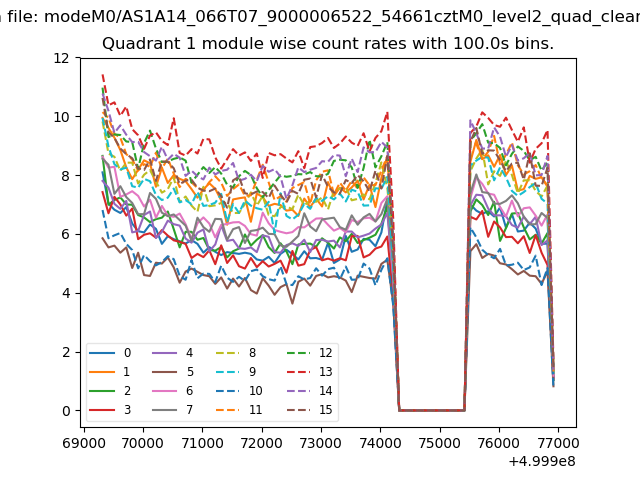
| Module-wise count rates for Quadrant A Data is divided into 100 sec bins |
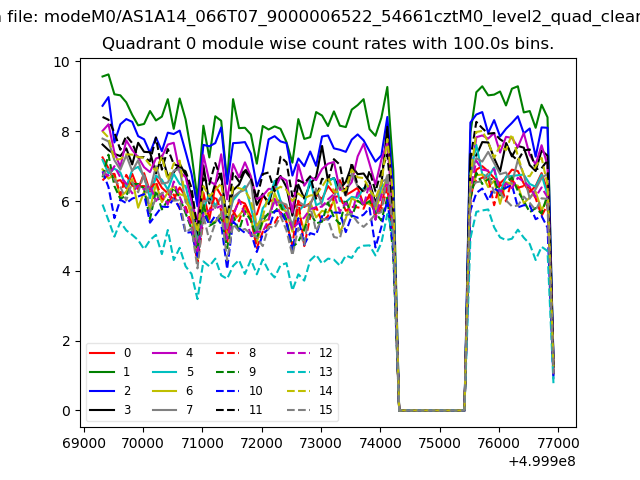 |
 |
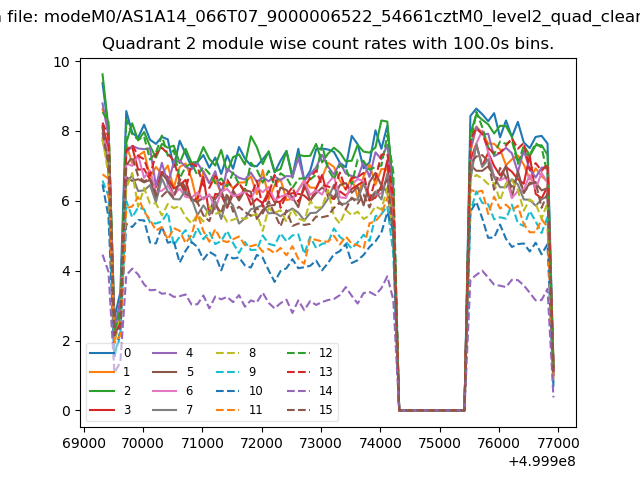
| Module-wise count rates for Quadrant B Data is divided into 100 sec bins |
 |
 |
| Module-wise count rates for Quadrant C Data is divided into 100 sec bins |
 |
 |
| Module-wise count rates for Quadrant D Data is divided into 100 sec bins |
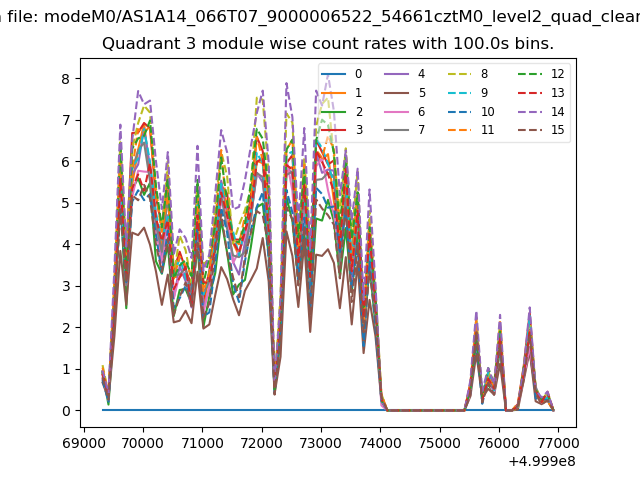 |
 |
| Parameter | Plot |
|---|---|
| CZT HV Monitor | 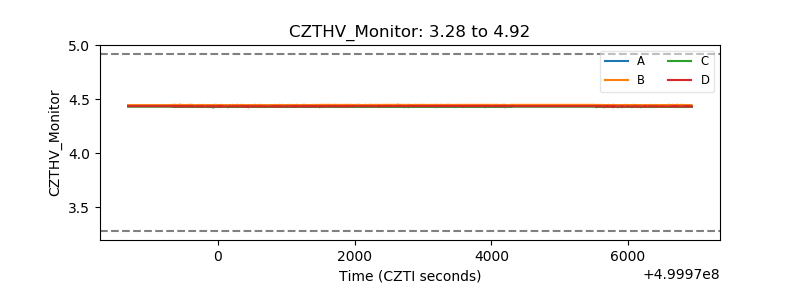 |
| D_VDD | 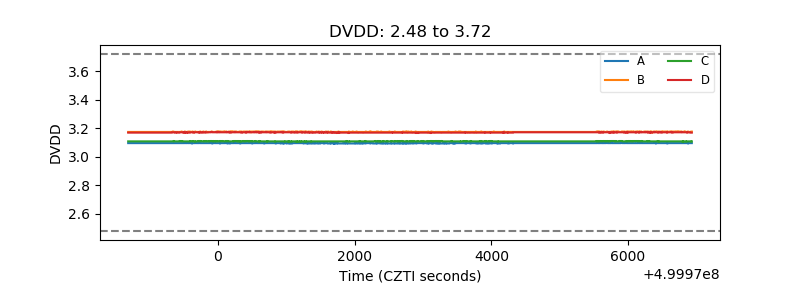 |
| Temperature 1 | 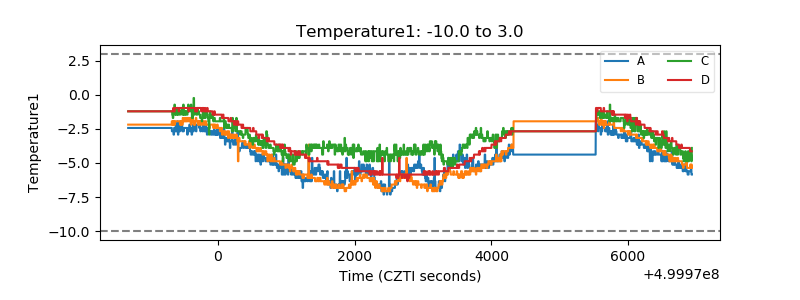 |
| Veto HV Monitor | 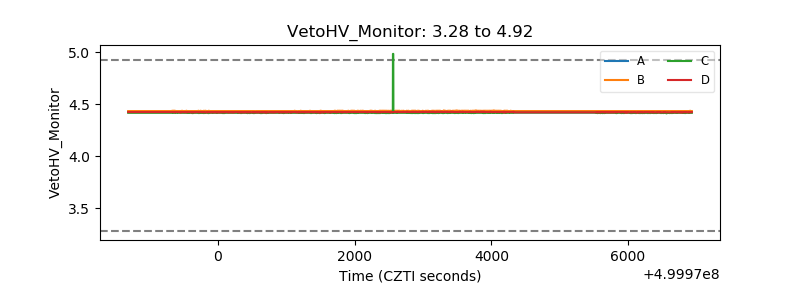 |
| Veto LLD | 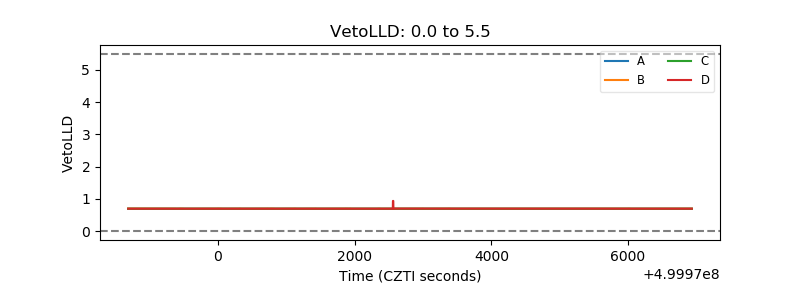 |
| Alpha Counter | 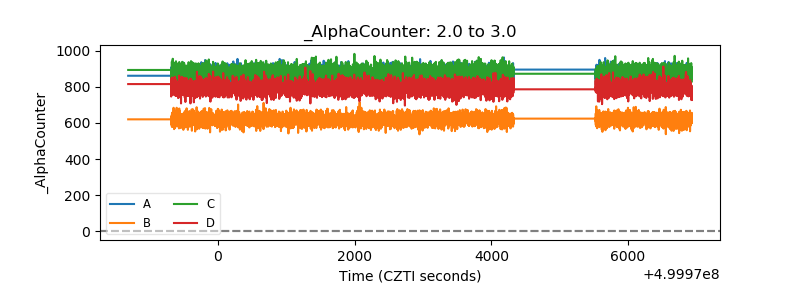 |
| _CPM_Rate | 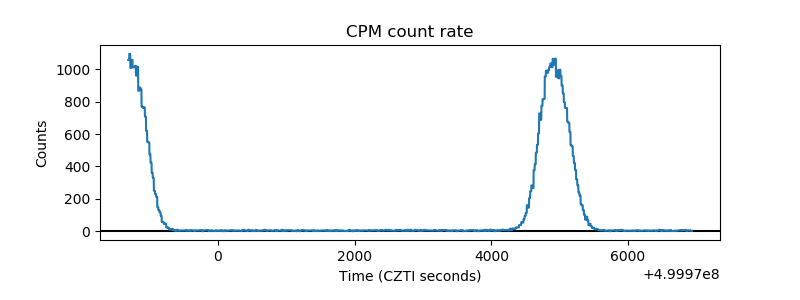 |
| CZT Counter | 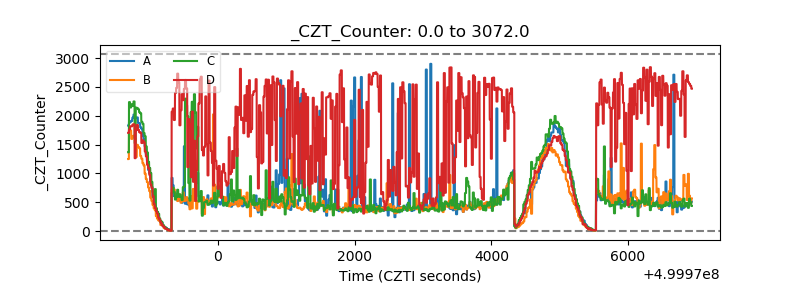 |
| +2.5 Volts monitor | 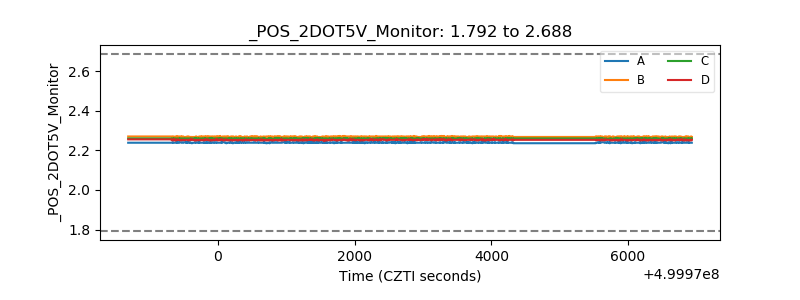 |
| +5 Volts monitor | 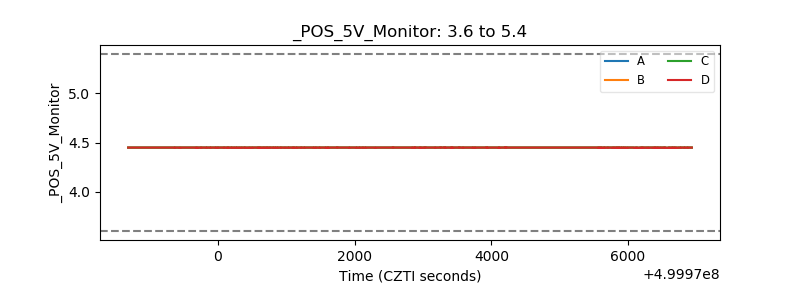 |
| _ROLL_ROT |  |
| _Roll_DEC | 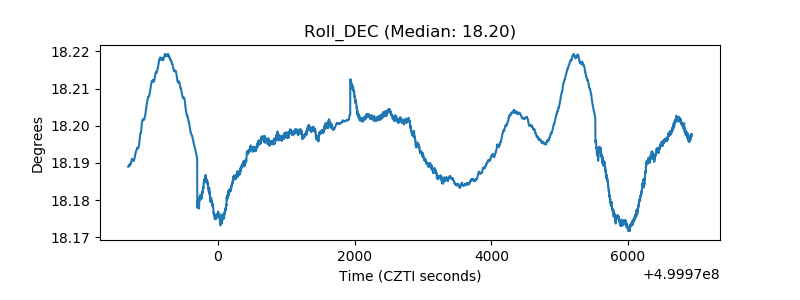 |
| _Roll_RA | 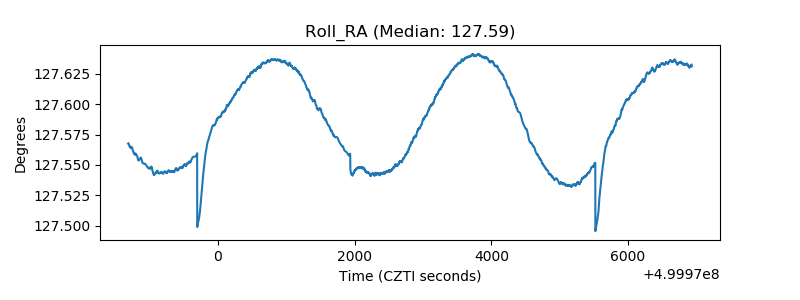 |
| Veto Counter | 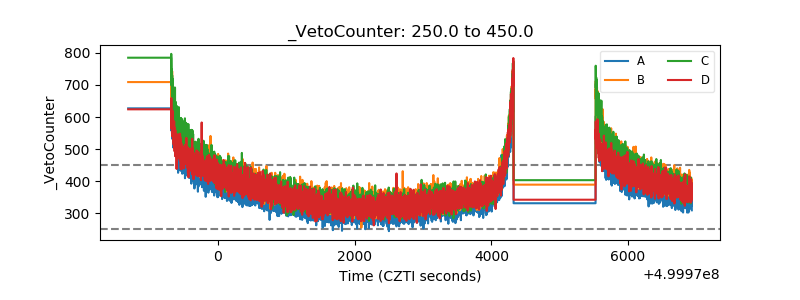 |