| Param | Original file | Final file |
|---|---|---|
| Filename | modeM0/AS1A14_066T07_9000006522_54662cztM0_level2.fits | modeM0/AS1A14_066T07_9000006522_54662cztM0_level2_quad_clean.evt |
| Size (bytes) | 514,627,200 | 85,363,200 |
| Size | 490.8 MB | 81.4 MB |
| Events in quadrant A | 2,899,722 | 616,040 |
| Events in quadrant B | 3,275,427 | 654,930 |
| Events in quadrant C | 2,909,684 | 582,598 |
| Events in quadrant D | 9,492,253 | 307,659 |
| Mode M9 | |||
|---|---|---|---|
| Quadrant | BADHDUFLAG | Total packets | Discarded packets |
| A | 0 | 12 | 0 |
| B | 0 | 12 | 0 |
| C | 0 | 12 | 0 |
| D | 0 | 12 | 0 |
| Mode M0 | |||
|---|---|---|---|
| Quadrant | BADHDUFLAG | Total packets | Discarded packets |
| A | 0 | 13001 | 1 |
| B | 0 | 14015 | 1 |
| C | 0 | 13021 | 1 |
| D | 0 | 32381 | 1 |
| Mode SS | |||
|---|---|---|---|
| Quadrant | BADHDUFLAG | Total packets | Discarded packets |
| A | 0 | 122 | 0 |
| B | 0 | 122 | 0 |
| C | 0 | 122 | 0 |
| D | 0 | 122 | 0 |
| Quadrant | Total seconds | Saturated seconds | Saturation percentage |
|---|---|---|---|
| A | 6070 | 104 | 1.713344% |
| B | 6070 | 145 | 2.388797% |
| C | 6070 | 83 | 1.367381% |
| D | 6070 | 2869 | 47.265239% |
Noise dominated data is calculated using 1-second bins in cleaned event files. If a bin has >2000 counts, and if more than 50% of those come from <1% of pixels, then it is considered to be noise-dominated and hence unusable.
| Quadrant | # 1 sec bins | Bins with >0 counts | Bins with >2000 counts | High rate bins dominated by noise | Noise dominated (total time) | Noise dominated (detector-on time) | Marked lightcurve |
|---|---|---|---|---|---|---|---|
| A | 7215 | 6071 | 28 | 28 | 0.39% | 0.46% | 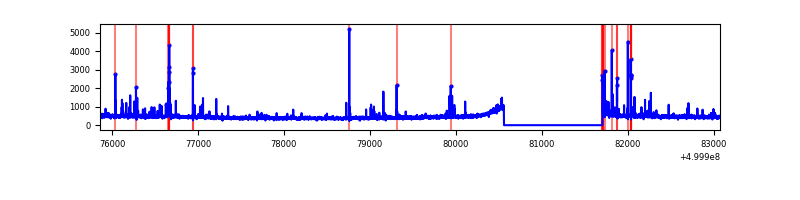 |
| B | 7215 | 6070 | 25 | 25 | 0.35% | 0.41% | 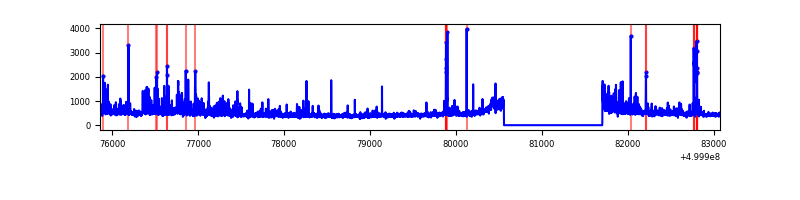 |
| C | 7215 | 6071 | 27 | 27 | 0.37% | 0.44% | 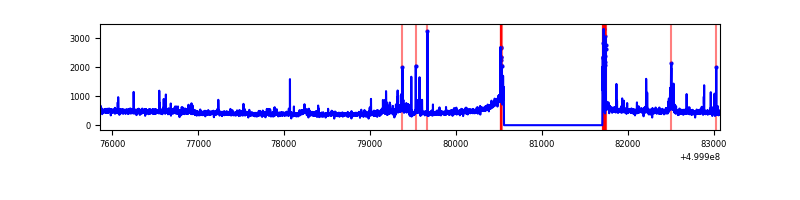 |
| D | 7215 | 6070 | 2313 | 2313 | 32.06% | 38.11% | 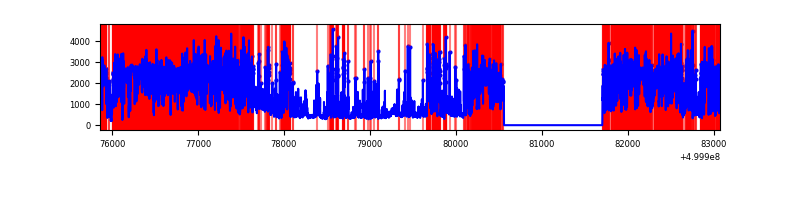 |
Top three noisy pixels from each quadrant. If the there are fewer than three noisy pixels in the level2.evt file, extra rows are filled as -1
| Pixel properties | Quadrant properties | ||||||
|---|---|---|---|---|---|---|---|
| Quadrant | DetID | PixID | Counts | Sigma | Mean | Median | Sigma |
| A | 11 | 3 | 144638 | 846.44 | 687 | 672 | 170.1 |
| A | 0 | 8 | 49760 | 288.61 | 687 | 672 | 170.1 |
| A | 8 | 9 | 15202 | 85.43 | 687 | 672 | 170.1 |
| B | 5 | 172 | 408194 | 2778.91 | 680 | 657 | 146.7 |
| B | 7 | 252 | 65527 | 442.34 | 680 | 657 | 146.7 |
| B | 1 | 207 | 40484 | 271.57 | 680 | 657 | 146.7 |
| C | 13 | 3 | 48485 | 257.73 | 672 | 666 | 185.5 |
| C | 4 | 5 | 45116 | 239.57 | 672 | 666 | 185.5 |
| C | 6 | 223 | 42548 | 225.73 | 672 | 666 | 185.5 |
| D | 11 | 129 | 5943274 | 43292.74 | 482 | 459 | 137.3 |
| D | 2 | 172 | 819984 | 5970.15 | 482 | 459 | 137.3 |
| D | 0 | 19 | 574767 | 4183.77 | 482 | 459 | 137.3 |
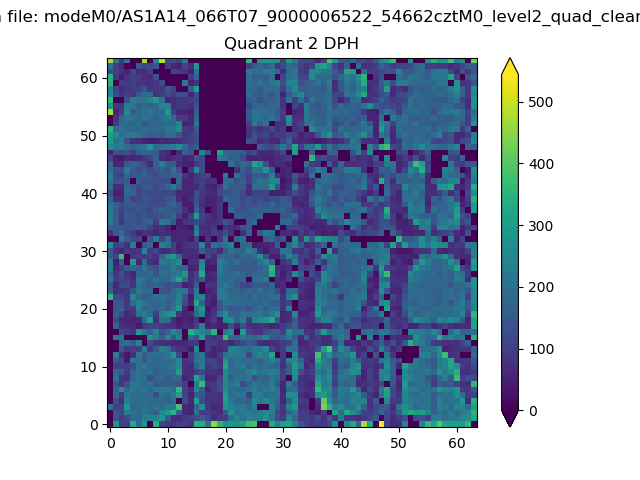
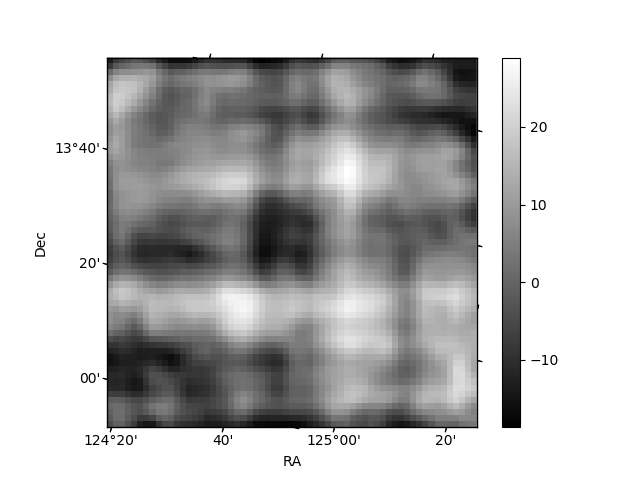
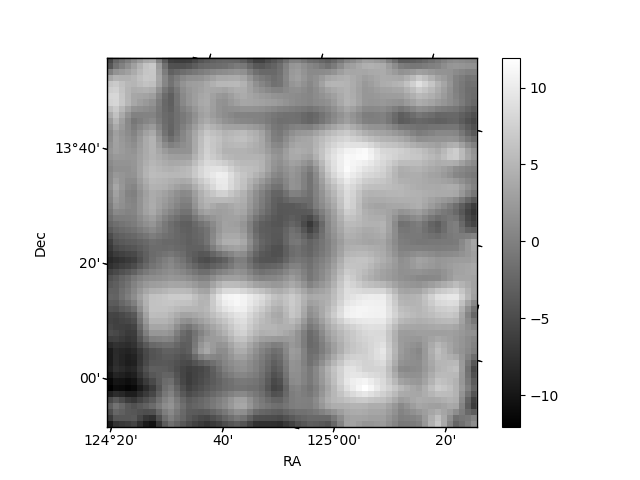
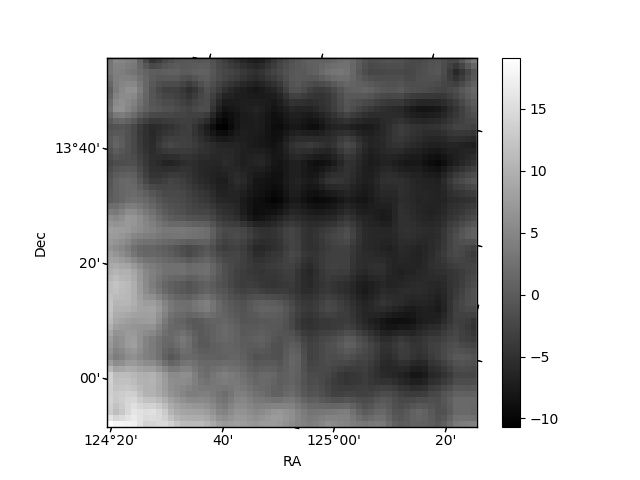
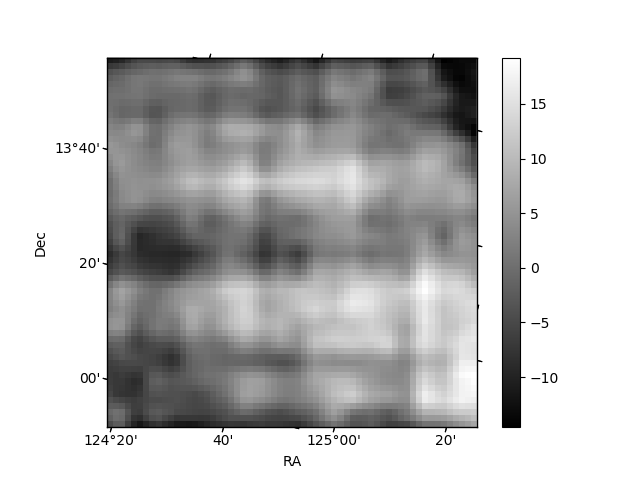
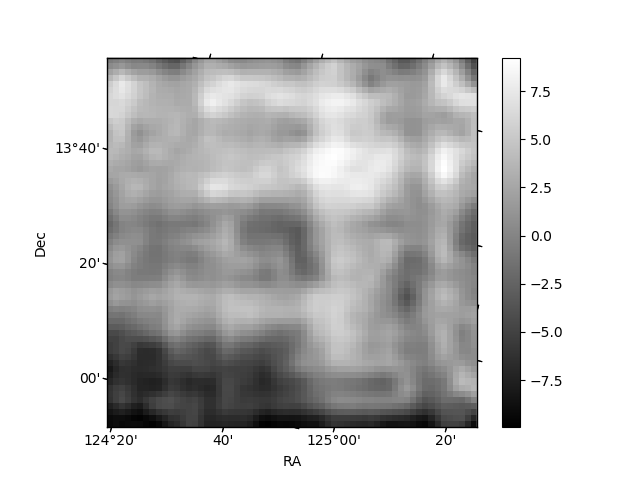
Histogram calculated using DETX and DETY for each event in the final _common_clean file
| Quadrant A | 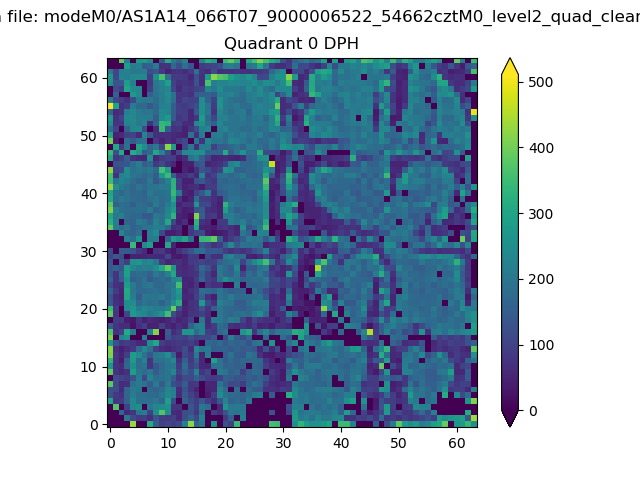 |
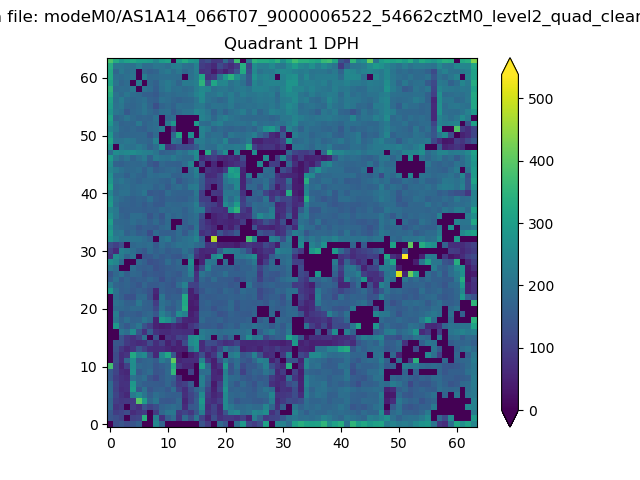 |
Quadrant B |
|---|---|---|---|
| Quadrant D | 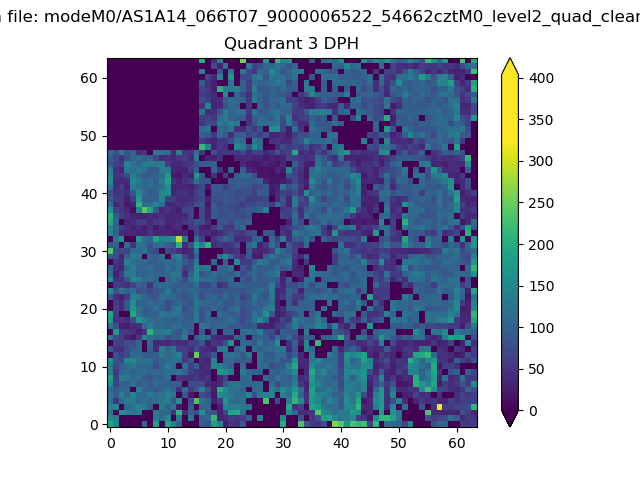 |
 |
Quadrant C |
| Plot type | Count rate plots | Images |
|---|---|---|
| Comparison with Poisson distribution Blue bars denote a histogram of data divided into 1 sec bins. Red curve is a Poisson curve with rate = median count rate of data. |
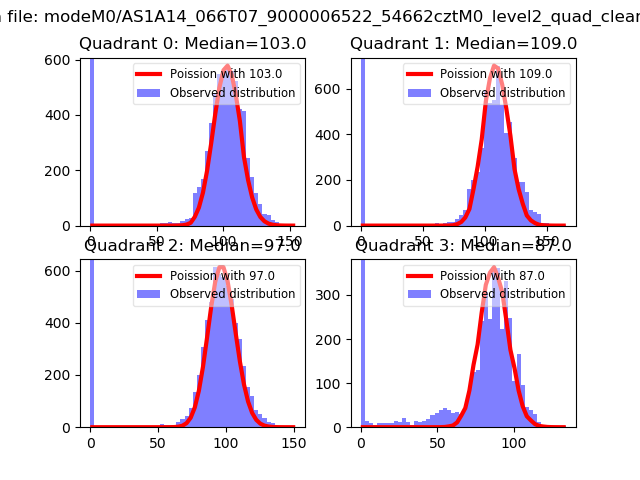 |
 |
| Quadrant-wise count rates Data is divided into 100 sec bins |
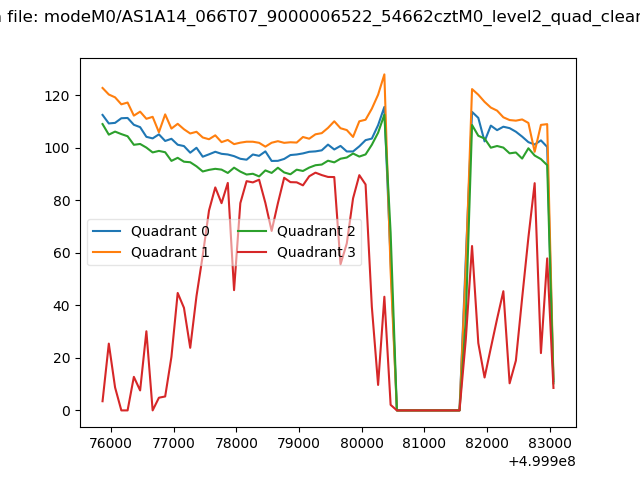 |
|
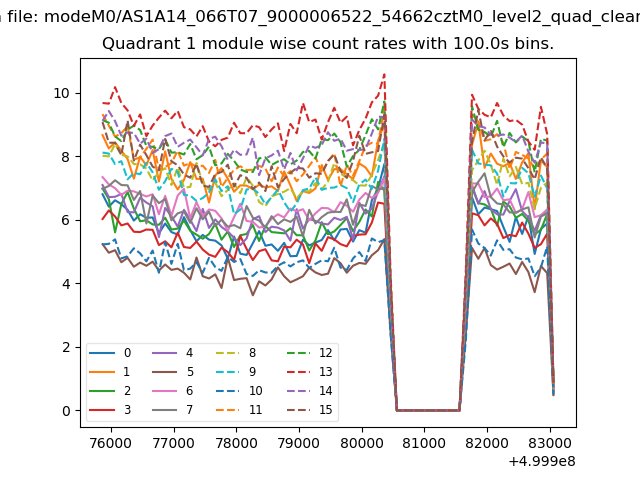
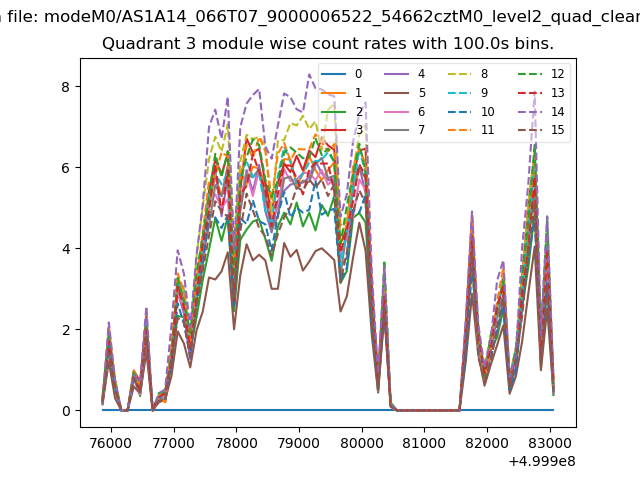
| Module-wise count rates for Quadrant A Data is divided into 100 sec bins |
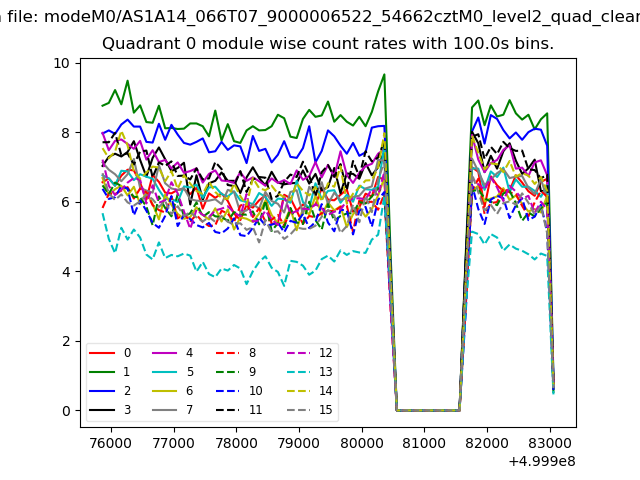 |
 |
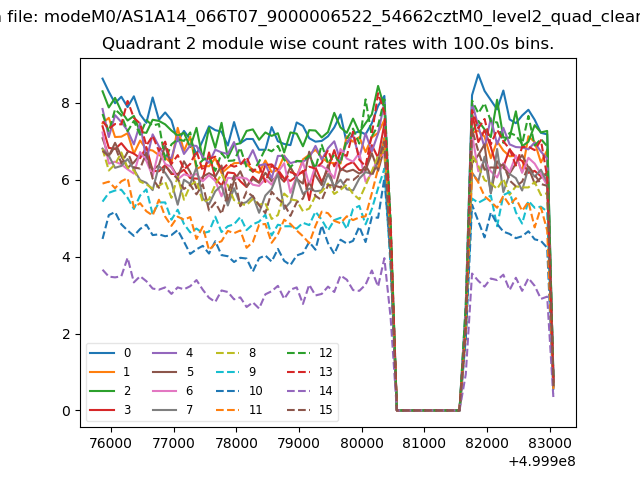
| Module-wise count rates for Quadrant B Data is divided into 100 sec bins |
 |
 |
| Module-wise count rates for Quadrant C Data is divided into 100 sec bins |
 |
 |
| Module-wise count rates for Quadrant D Data is divided into 100 sec bins |
 |
 |
| Parameter | Plot |
|---|---|
| CZT HV Monitor | 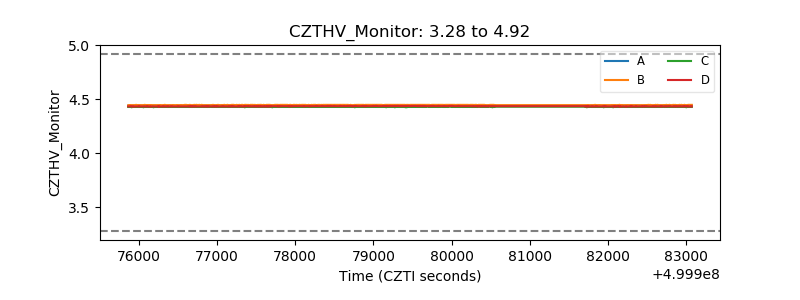 |
| D_VDD | 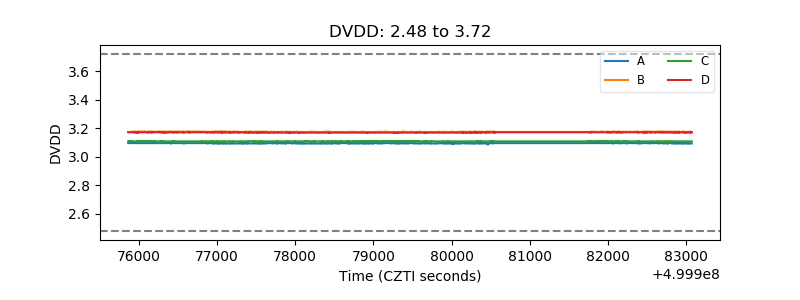 |
| Temperature 1 | 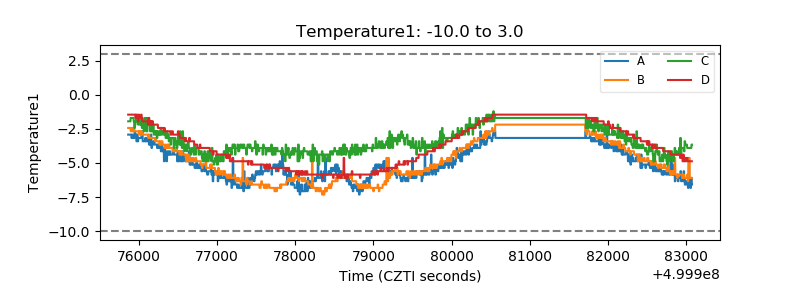 |
| Veto HV Monitor | 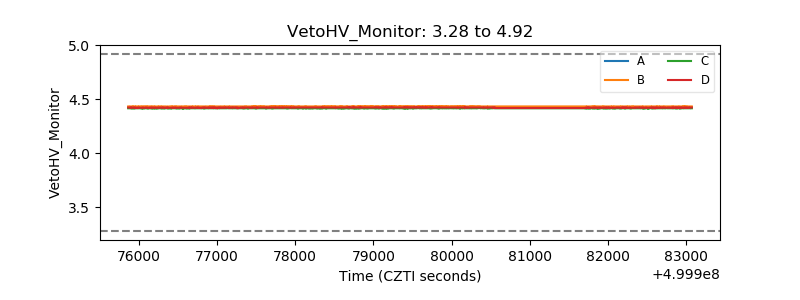 |
| Veto LLD | 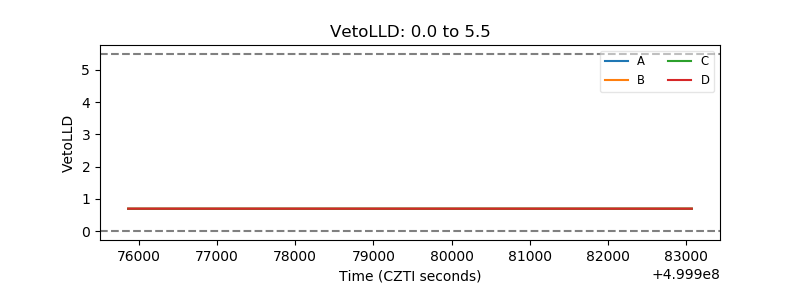 |
| Alpha Counter | 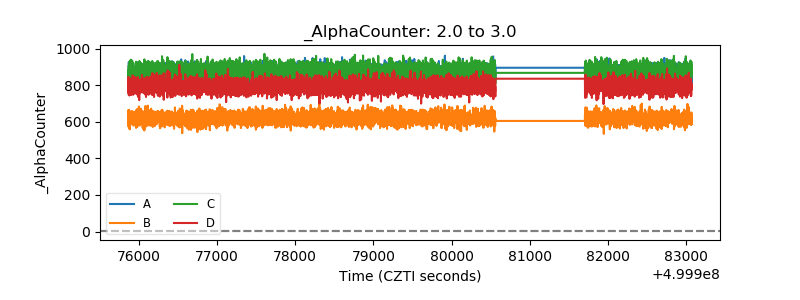 |
| _CPM_Rate | 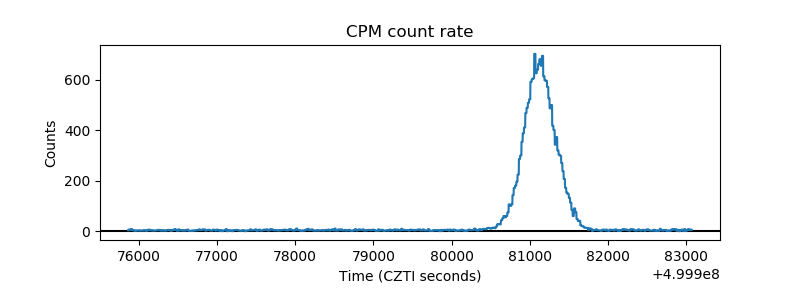 |
| CZT Counter | 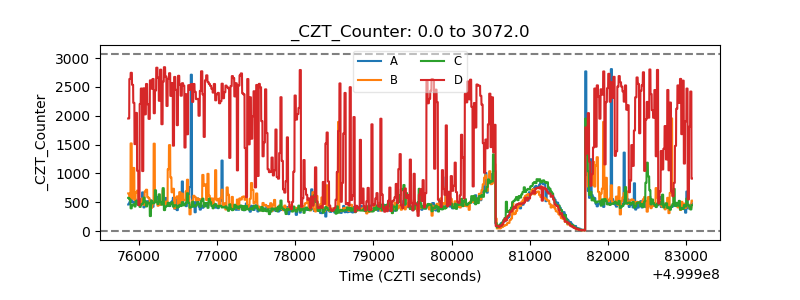 |
| +2.5 Volts monitor |  |
| +5 Volts monitor | 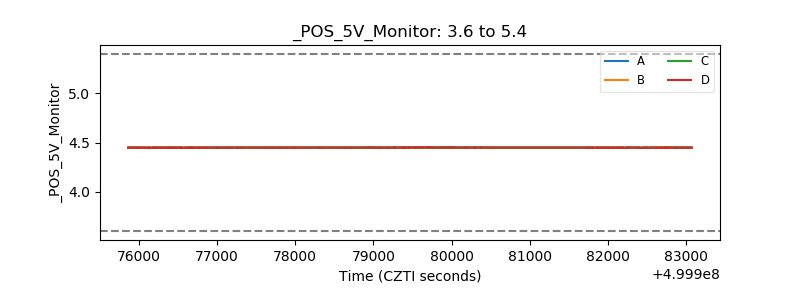 |
| _ROLL_ROT | 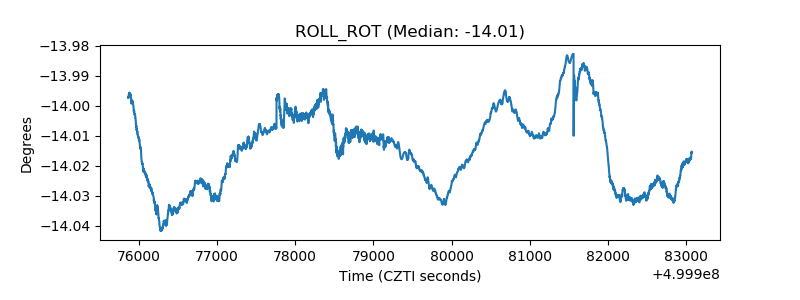 |
| _Roll_DEC | 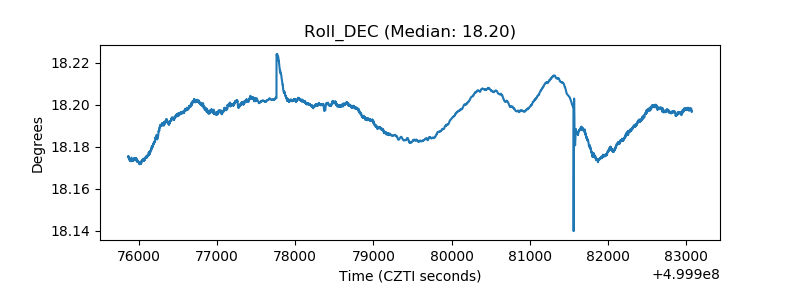 |
| _Roll_RA | 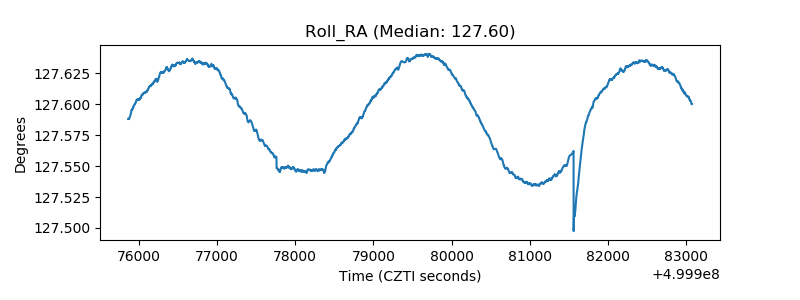 |
| Veto Counter | 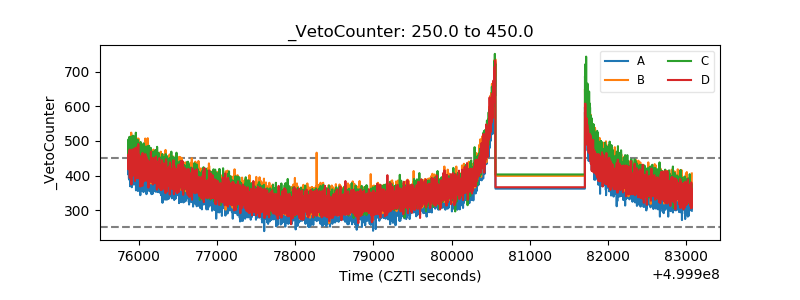 |