| Param | Original file | Final file |
|---|---|---|
| Filename | modeM0/AS1A14_066T07_9000006522_54664cztM0_level2.fits | modeM0/AS1A14_066T07_9000006522_54664cztM0_level2_quad_clean.evt |
| Size (bytes) | 605,142,720 | 94,095,360 |
| Size | 577.1 MB | 89.7 MB |
| Events in quadrant A | 3,194,777 | 667,418 |
| Events in quadrant B | 4,167,031 | 689,091 |
| Events in quadrant C | 4,910,174 | 601,763 |
| Events in quadrant D | 9,592,059 | 409,486 |
| Mode M9 | |||
|---|---|---|---|
| Quadrant | BADHDUFLAG | Total packets | Discarded packets |
| A | 0 | 10 | 0 |
| B | 0 | 11 | 0 |
| C | 0 | 11 | 0 |
| D | 0 | 11 | 0 |
| Mode M0 | |||
|---|---|---|---|
| Quadrant | BADHDUFLAG | Total packets | Discarded packets |
| A | 0 | 14745 | 2 |
| B | 0 | 17480 | 2 |
| C | 0 | 19691 | 2 |
| D | 0 | 33419 | 5 |
| Mode SS | |||
|---|---|---|---|
| Quadrant | BADHDUFLAG | Total packets | Discarded packets |
| A | 0 | 140 | 0 |
| B | 0 | 140 | 0 |
| C | 0 | 140 | 0 |
| D | 0 | 140 | 0 |
| Quadrant | Total seconds | Saturated seconds | Saturation percentage |
|---|---|---|---|
| A | 6907 | 78 | 1.129289% |
| B | 6907 | 399 | 5.776748% |
| C | 6907 | 402 | 5.820182% |
| D | 6906 | 2418 | 35.013032% |
Noise dominated data is calculated using 1-second bins in cleaned event files. If a bin has >2000 counts, and if more than 50% of those come from <1% of pixels, then it is considered to be noise-dominated and hence unusable.
| Quadrant | # 1 sec bins | Bins with >0 counts | Bins with >2000 counts | High rate bins dominated by noise | Noise dominated (total time) | Noise dominated (detector-on time) | Marked lightcurve |
|---|---|---|---|---|---|---|---|
| A | 7632 | 6910 | 30 | 30 | 0.39% | 0.43% | 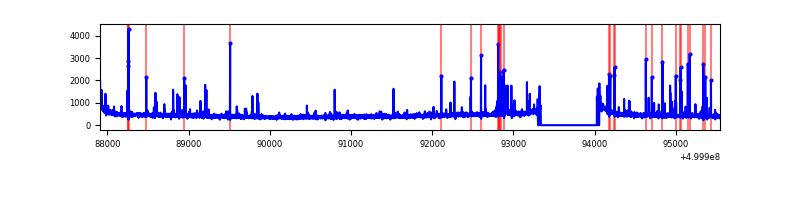 |
| B | 7632 | 6910 | 218 | 218 | 2.86% | 3.15% | 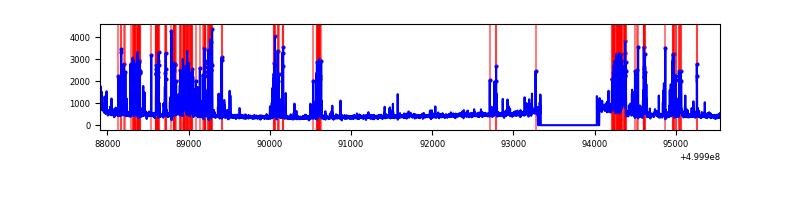 |
| C | 7632 | 6909 | 351 | 351 | 4.60% | 5.08% | 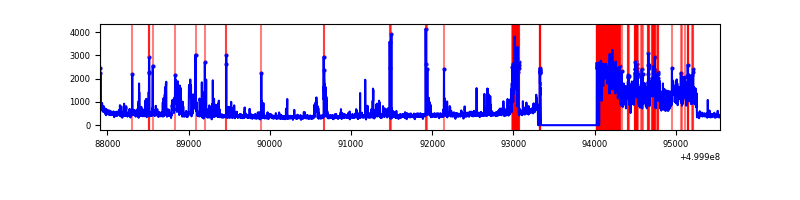 |
| D | 7630 | 6907 | 2086 | 2086 | 27.34% | 30.20% | 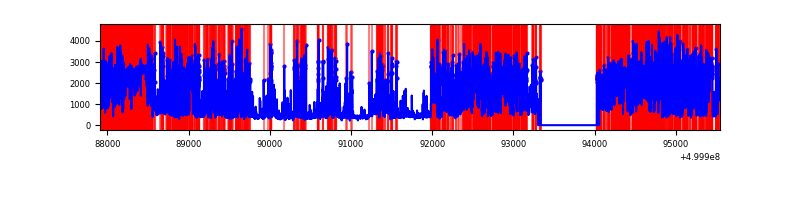 |
Top three noisy pixels from each quadrant. If the there are fewer than three noisy pixels in the level2.evt file, extra rows are filled as -1
| Pixel properties | Quadrant properties | ||||||
|---|---|---|---|---|---|---|---|
| Quadrant | DetID | PixID | Counts | Sigma | Mean | Median | Sigma |
| A | 11 | 3 | 171965 | 920.65 | 753 | 734 | 186.0 |
| A | 5 | 240 | 44733 | 236.57 | 753 | 734 | 186.0 |
| A | 13 | 254 | 14871 | 76.01 | 753 | 734 | 186.0 |
| B | 2 | 249 | 773368 | 4940.26 | 733 | 708 | 156.4 |
| B | 1 | 207 | 279341 | 1781.53 | 733 | 708 | 156.4 |
| B | 10 | 247 | 48785 | 307.4 | 733 | 708 | 156.4 |
| C | 3 | 242 | 1743859 | 8885.38 | 712 | 707 | 196.2 |
| C | 6 | 223 | 73367 | 370.37 | 712 | 707 | 196.2 |
| C | 14 | 254 | 58039 | 292.24 | 712 | 707 | 196.2 |
| D | 11 | 129 | 5729978 | 33605.86 | 597 | 570 | 170.5 |
| D | 11 | 176 | 1255821 | 7362.68 | 597 | 570 | 170.5 |
| D | 14 | 52 | 115516 | 674.22 | 597 | 570 | 170.5 |
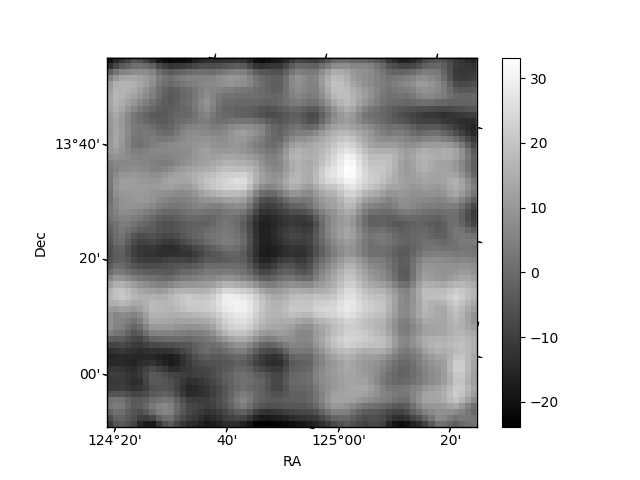
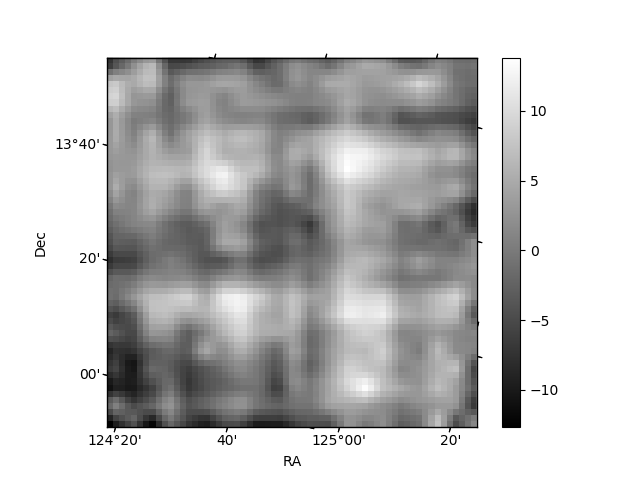
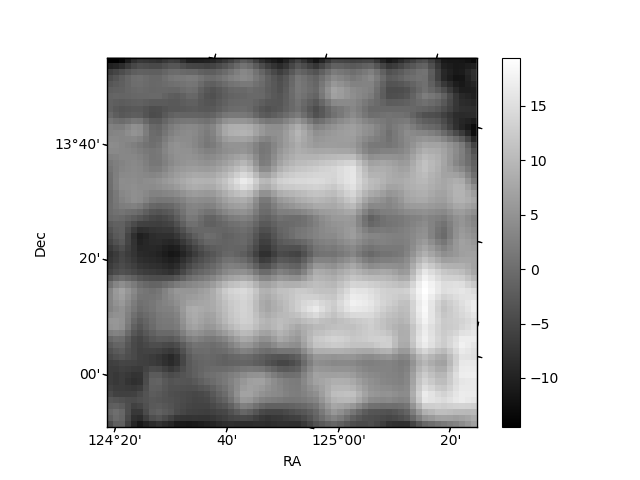
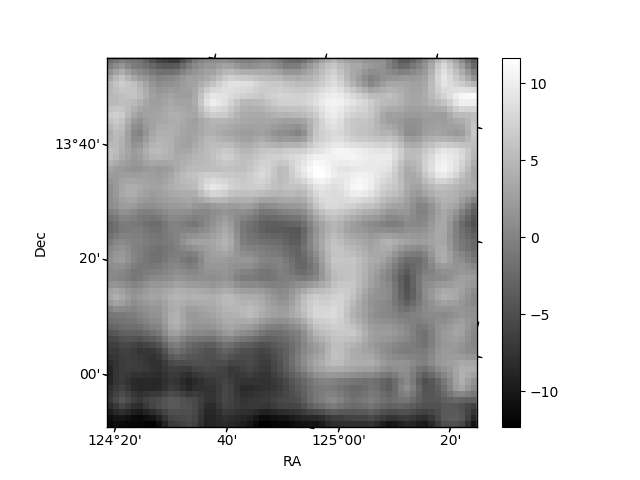
Histogram calculated using DETX and DETY for each event in the final _common_clean file
| Quadrant A | 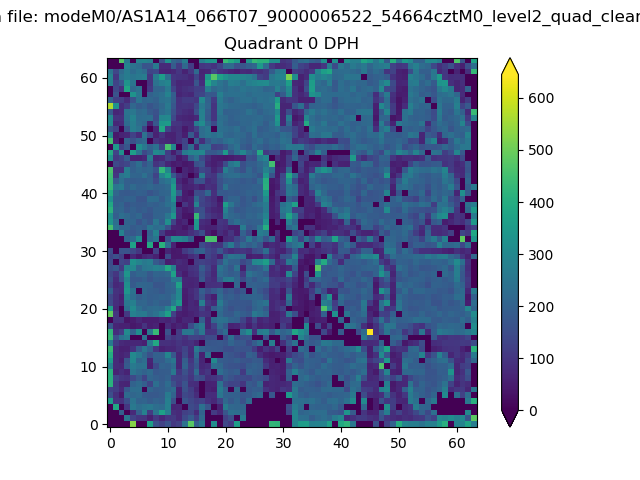 |
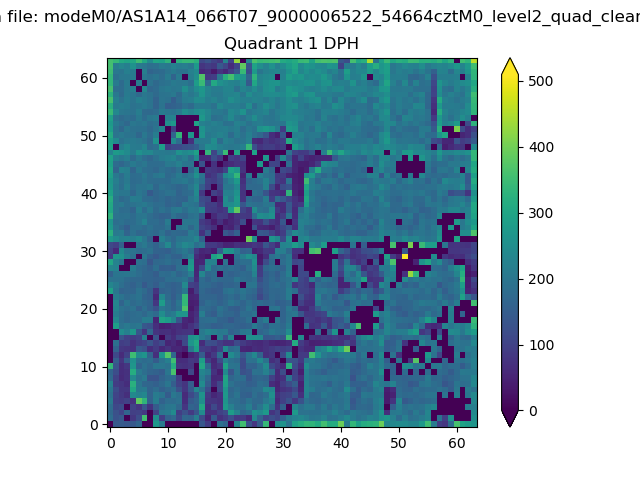 |
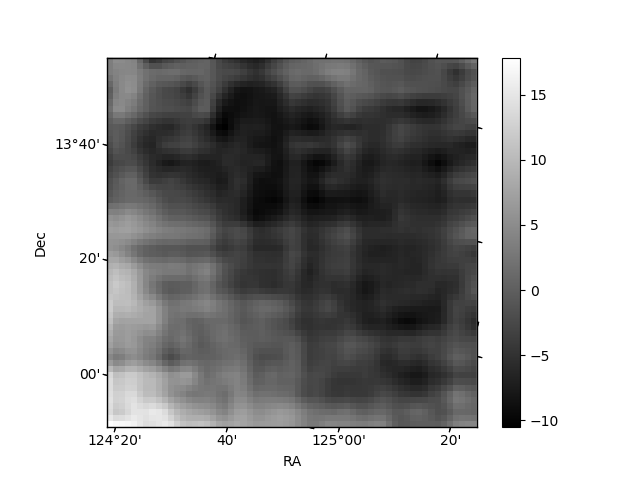
Quadrant B |
|---|---|---|---|
| Quadrant D | 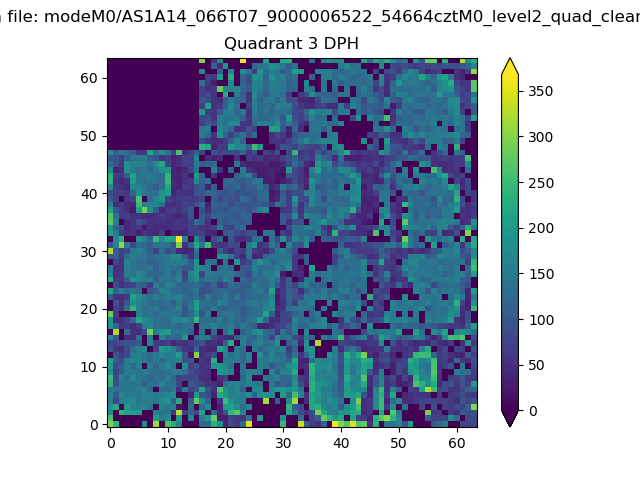 |
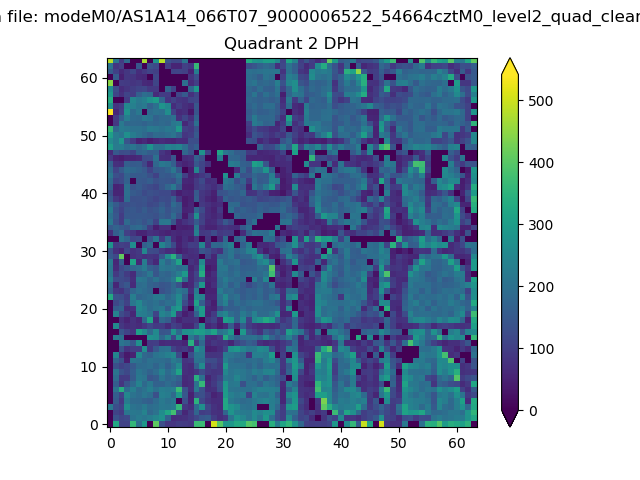 |
Quadrant C |
| Plot type | Count rate plots | Images |
|---|---|---|
| Comparison with Poisson distribution Blue bars denote a histogram of data divided into 1 sec bins. Red curve is a Poisson curve with rate = median count rate of data. |
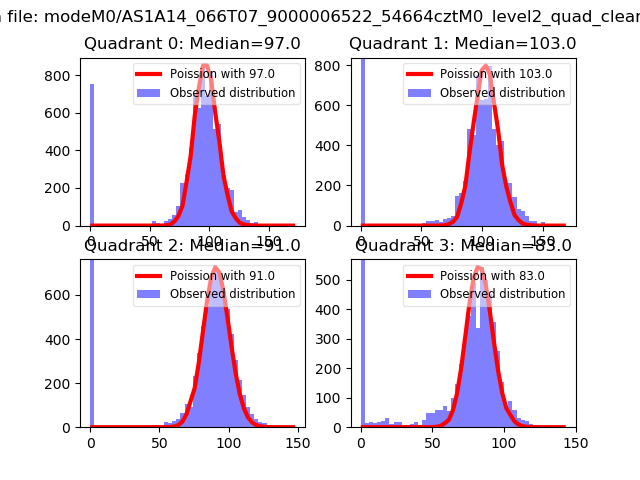 |
 |
| Quadrant-wise count rates Data is divided into 100 sec bins |
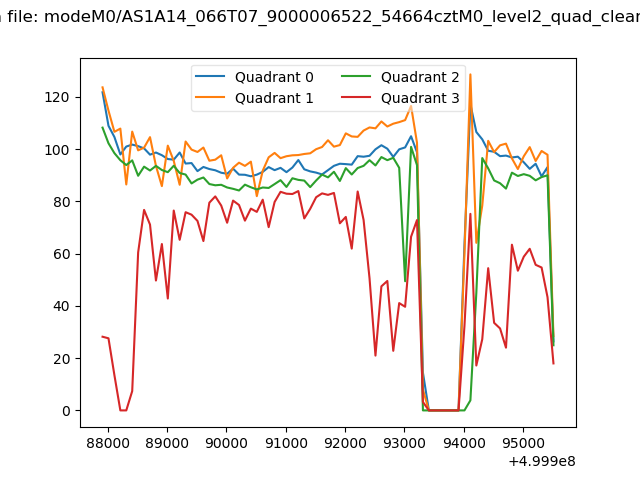 |
|
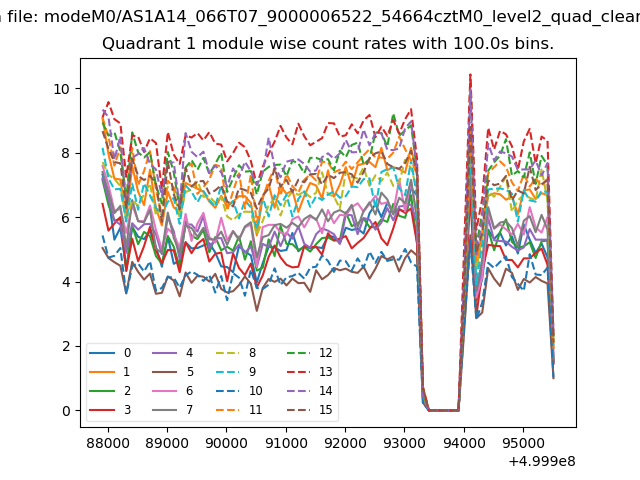
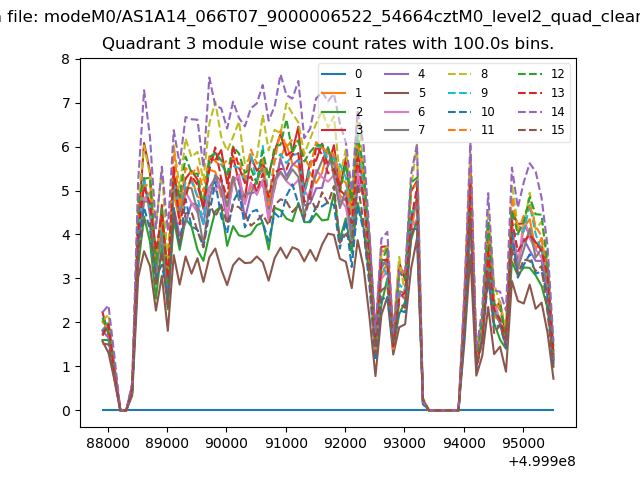
| Module-wise count rates for Quadrant A Data is divided into 100 sec bins |
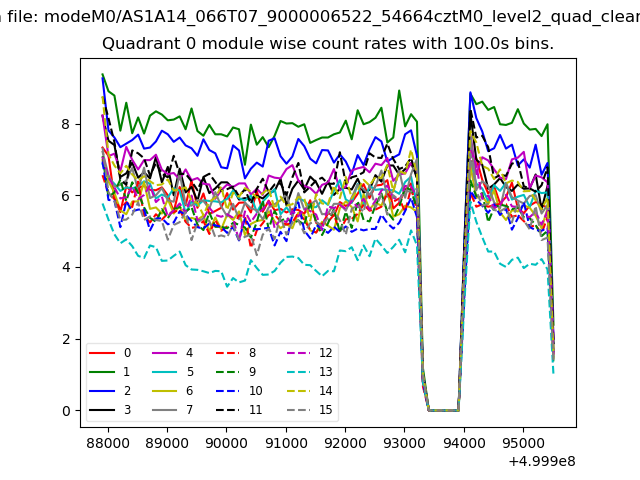 |
 |
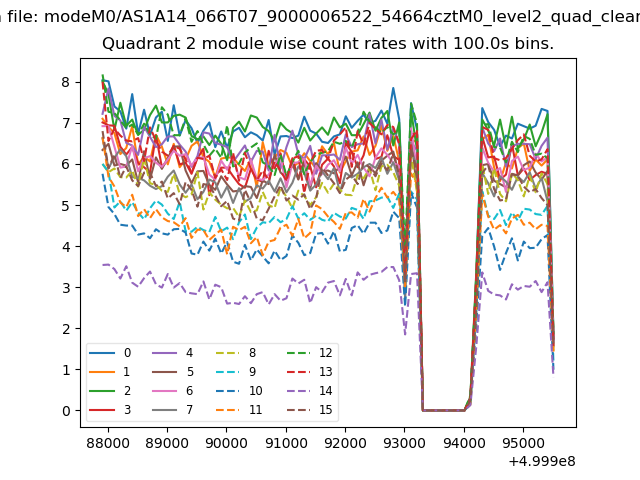
| Module-wise count rates for Quadrant B Data is divided into 100 sec bins |
 |
 |
| Module-wise count rates for Quadrant C Data is divided into 100 sec bins |
 |
 |
| Module-wise count rates for Quadrant D Data is divided into 100 sec bins |
 |
 |
| Parameter | Plot |
|---|---|
| CZT HV Monitor | 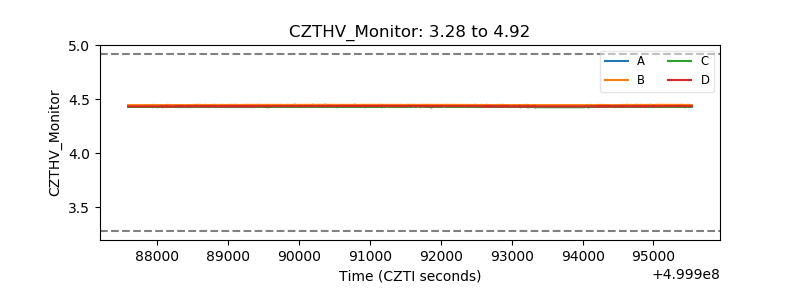 |
| D_VDD | 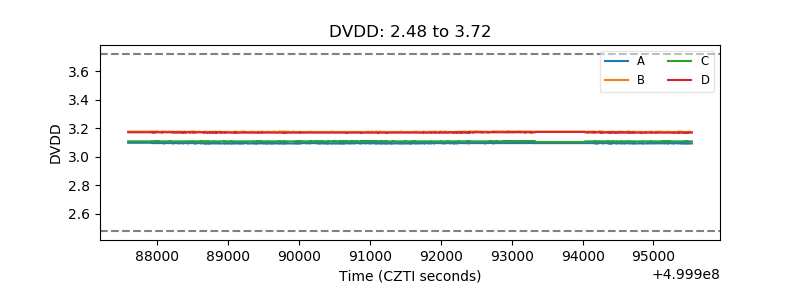 |
| Temperature 1 |  |
| Veto HV Monitor | 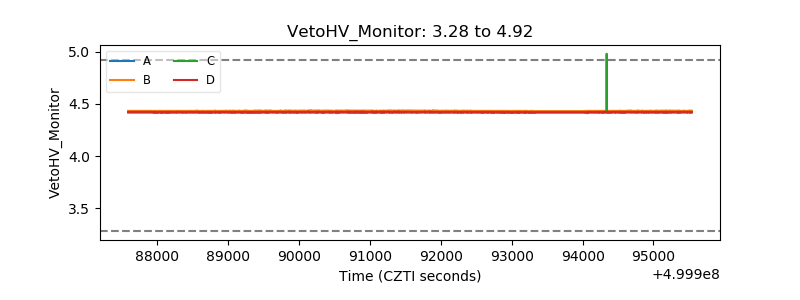 |
| Veto LLD | 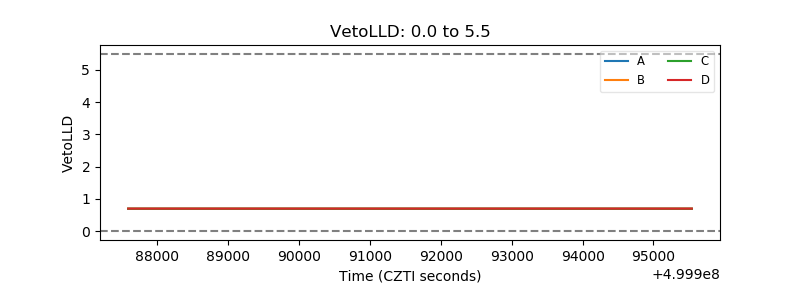 |
| Alpha Counter | 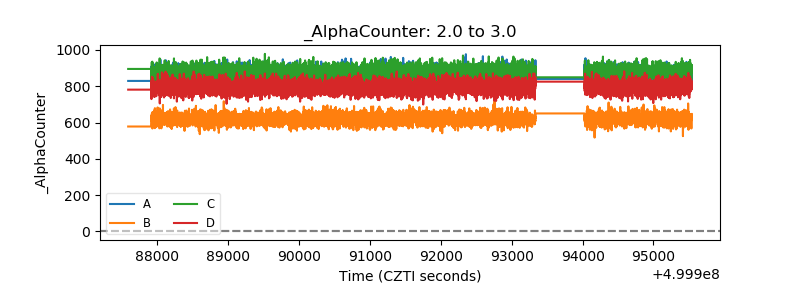 |
| _CPM_Rate | 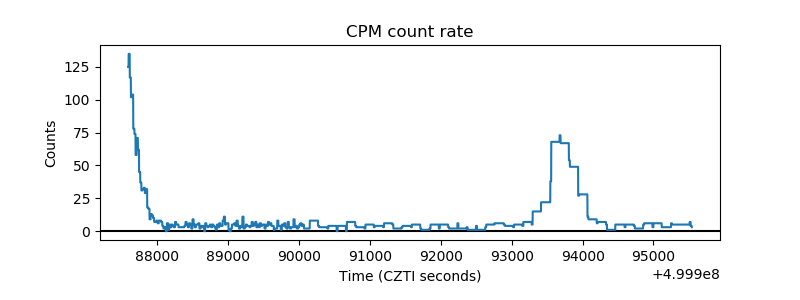 |
| CZT Counter | 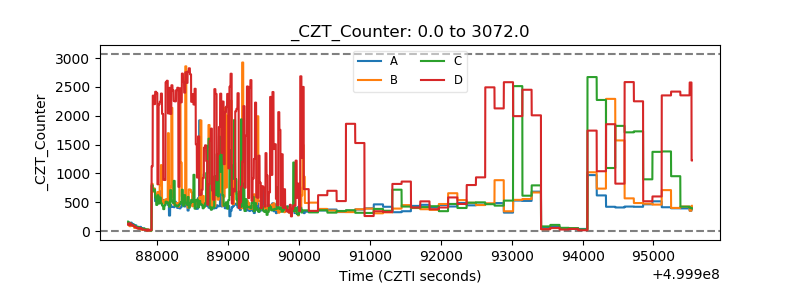 |
| +2.5 Volts monitor | 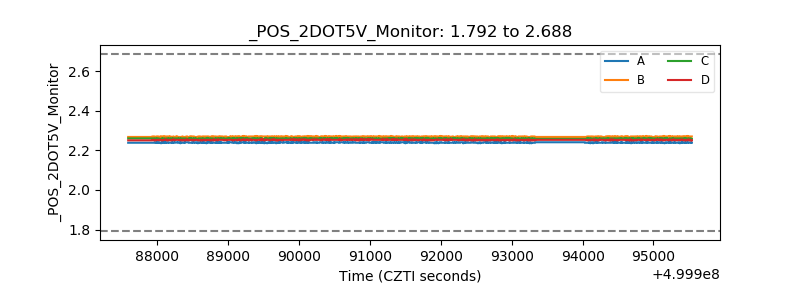 |
| +5 Volts monitor |  |
| _ROLL_ROT | 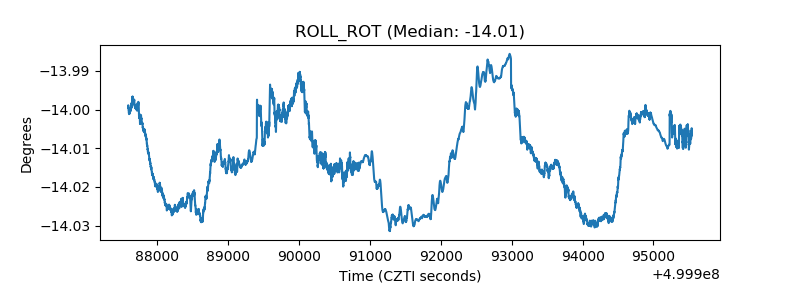 |
| _Roll_DEC | 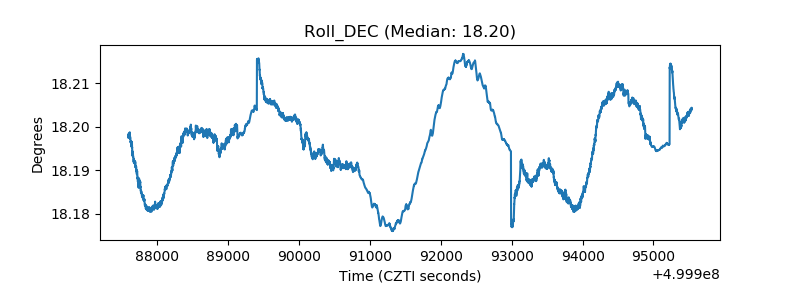 |
| _Roll_RA | 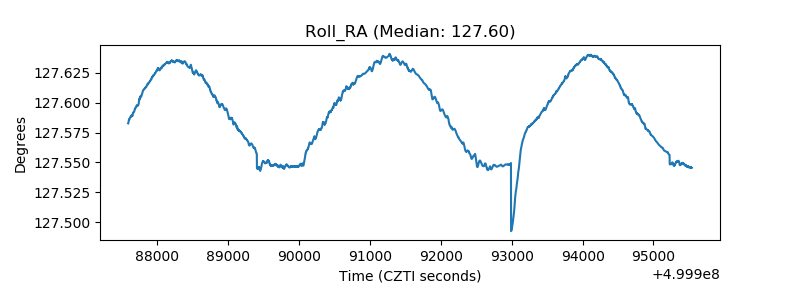 |
| Veto Counter | 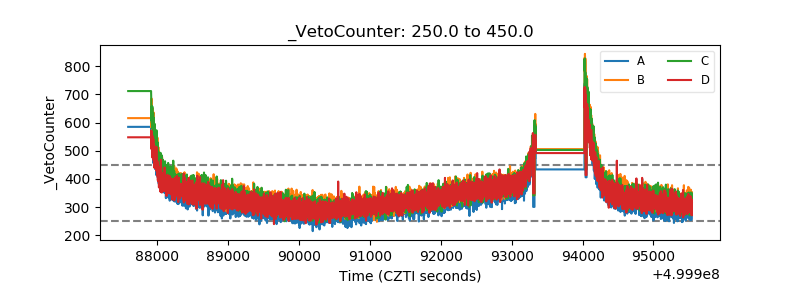 |