| Param | Original file | Final file |
|---|---|---|
| Filename | modeM0/AS1A14_066T07_9000006522_54665cztM0_level2.fits | modeM0/AS1A14_066T07_9000006522_54665cztM0_level2_quad_clean.evt |
| Size (bytes) | 704,306,880 | 100,840,320 |
| Size | 671.7 MB | 96.2 MB |
| Events in quadrant A | 3,656,105 | 728,375 |
| Events in quadrant B | 5,046,525 | 708,979 |
| Events in quadrant C | 6,227,735 | 612,626 |
| Events in quadrant D | 10,551,391 | 474,743 |
| Mode M0 | |||
|---|---|---|---|
| Quadrant | BADHDUFLAG | Total packets | Discarded packets |
| A | 0 | 16648 | 0 |
| B | 0 | 20422 | 0 |
| C | 0 | 23931 | 0 |
| D | 0 | 36631 | 0 |
| Mode SS | |||
|---|---|---|---|
| Quadrant | BADHDUFLAG | Total packets | Discarded packets |
| A | 0 | 152 | 0 |
| B | 0 | 152 | 0 |
| C | 0 | 152 | 0 |
| D | 0 | 152 | 0 |
| Quadrant | Total seconds | Saturated seconds | Saturation percentage |
|---|---|---|---|
| A | 7597 | 113 | 1.487429% |
| B | 7597 | 731 | 9.622219% |
| C | 7597 | 881 | 11.596683% |
| D | 7597 | 2415 | 31.788864% |
Noise dominated data is calculated using 1-second bins in cleaned event files. If a bin has >2000 counts, and if more than 50% of those come from <1% of pixels, then it is considered to be noise-dominated and hence unusable.
| Quadrant | # 1 sec bins | Bins with >0 counts | Bins with >2000 counts | High rate bins dominated by noise | Noise dominated (total time) | Noise dominated (detector-on time) | Marked lightcurve |
|---|---|---|---|---|---|---|---|
| A | 7597 | 7597 | 61 | 61 | 0.80% | 0.80% | 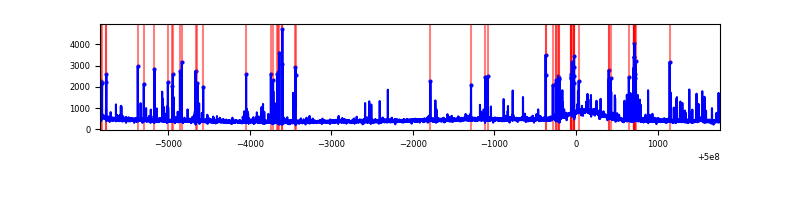 |
| B | 7597 | 7597 | 295 | 295 | 3.88% | 3.88% | 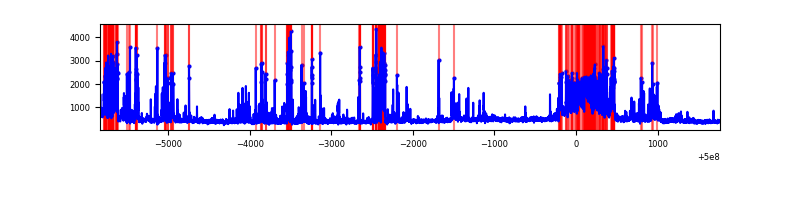 |
| C | 7597 | 7597 | 625 | 625 | 8.23% | 8.23% | 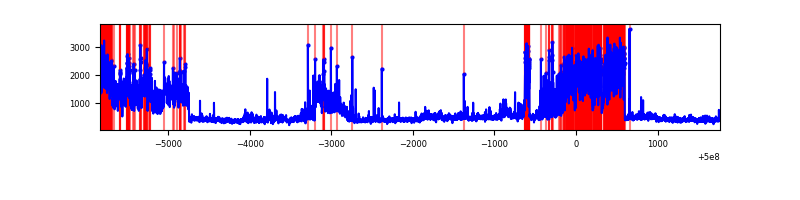 |
| D | 7597 | 7597 | 2133 | 2133 | 28.08% | 28.08% | 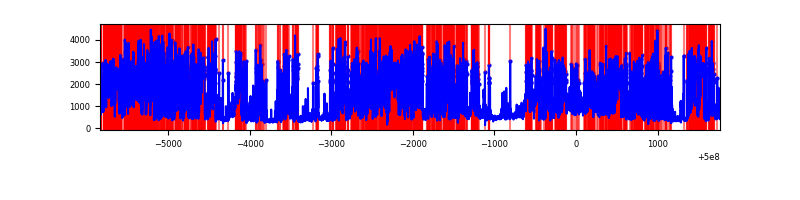 |
Top three noisy pixels from each quadrant. If the there are fewer than three noisy pixels in the level2.evt file, extra rows are filled as -1
| Pixel properties | Quadrant properties | ||||||
|---|---|---|---|---|---|---|---|
| Quadrant | DetID | PixID | Counts | Sigma | Mean | Median | Sigma |
| A | 11 | 3 | 283416 | 1360.29 | 843 | 824 | 207.7 |
| A | 0 | 8 | 68442 | 325.49 | 843 | 824 | 207.7 |
| A | 13 | 254 | 18318 | 84.21 | 843 | 824 | 207.7 |
| B | 2 | 249 | 1199206 | 6871.6 | 803 | 773 | 174.4 |
| B | 1 | 207 | 243556 | 1392.07 | 803 | 773 | 174.4 |
| B | 10 | 14 | 157398 | 898.06 | 803 | 773 | 174.4 |
| C | 3 | 242 | 2772371 | 12753.14 | 786 | 779 | 217.3 |
| C | 14 | 254 | 126526 | 578.61 | 786 | 779 | 217.3 |
| C | 6 | 223 | 88340 | 402.9 | 786 | 779 | 217.3 |
| D | 11 | 129 | 5497841 | 27692.97 | 697 | 665 | 198.5 |
| D | 11 | 176 | 1942457 | 9782.11 | 697 | 665 | 198.5 |
| D | 2 | 252 | 139343 | 698.61 | 697 | 665 | 198.5 |
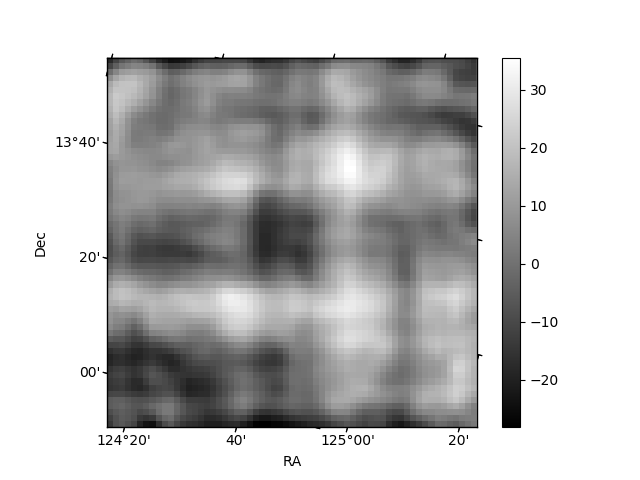
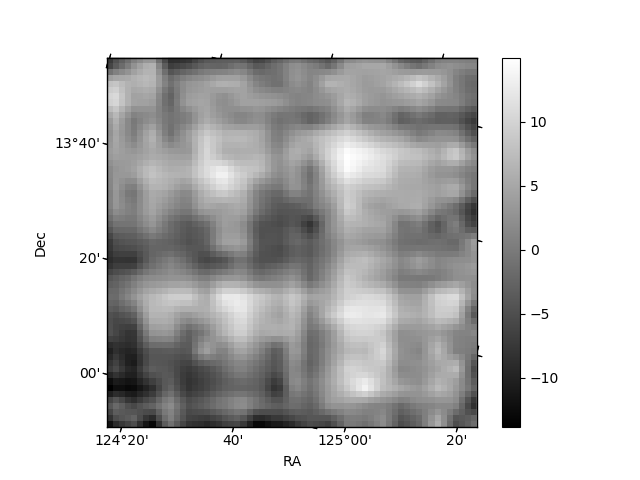
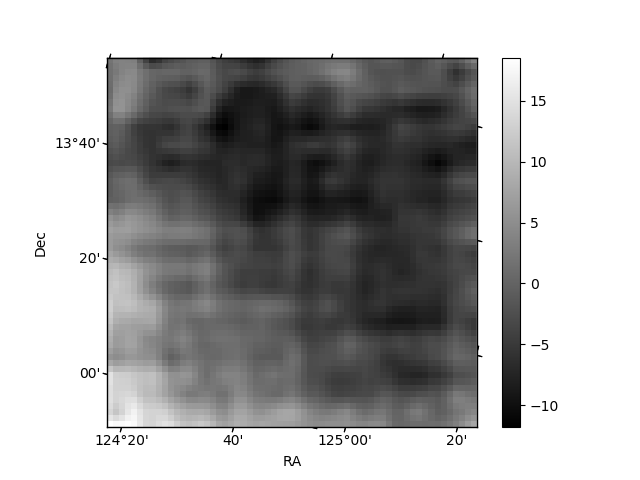
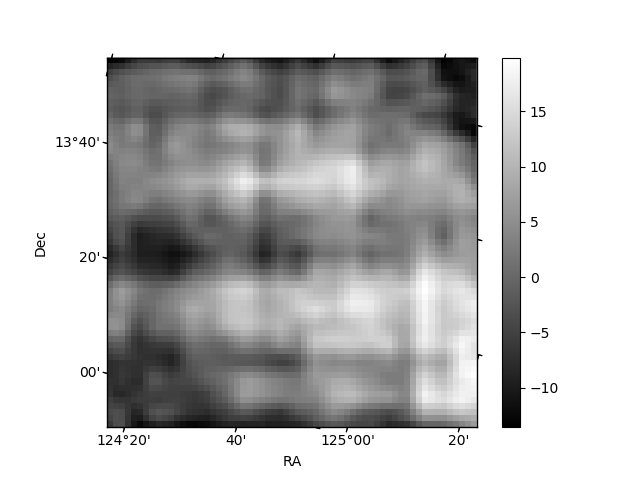
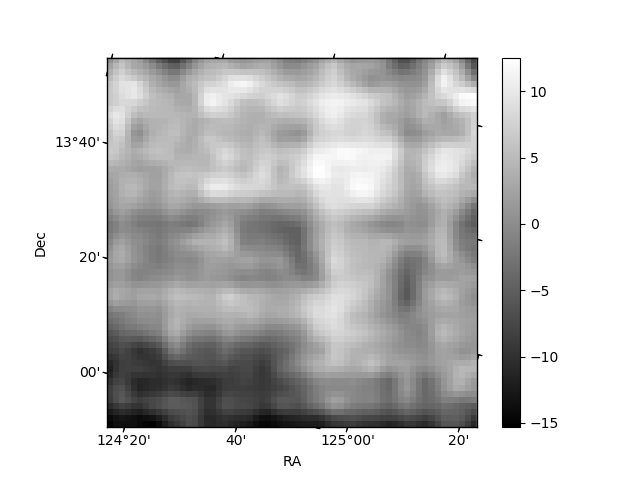
Histogram calculated using DETX and DETY for each event in the final _common_clean file
| Quadrant A | 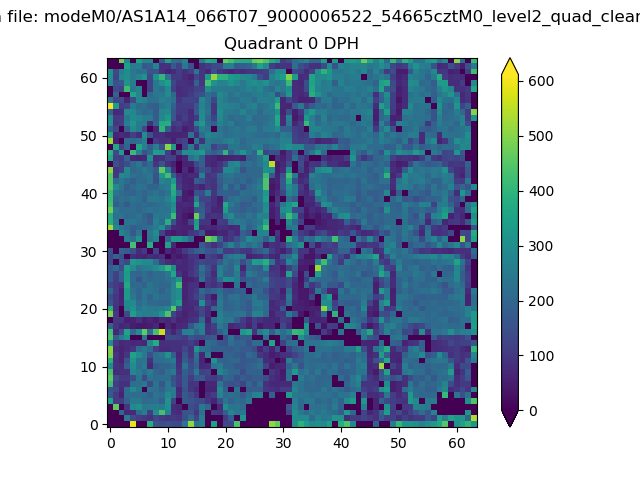 |
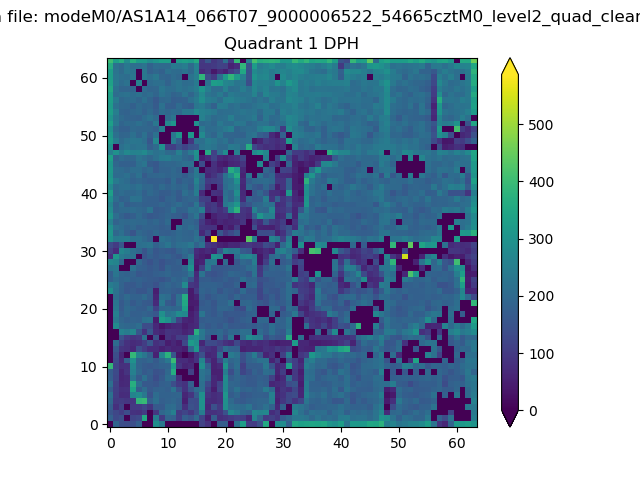 |
Quadrant B |
|---|---|---|---|
| Quadrant D | 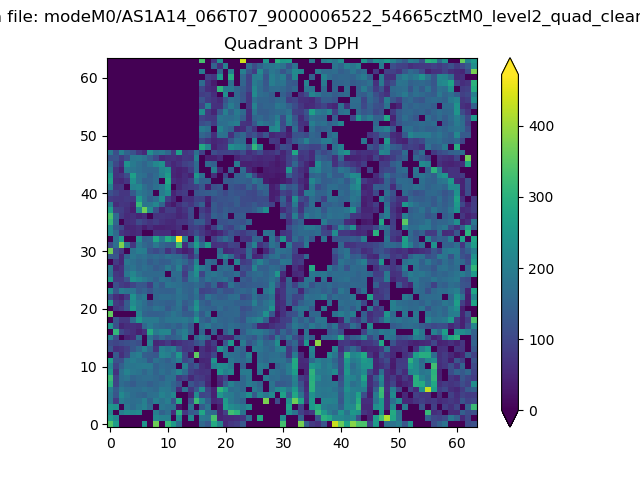 |
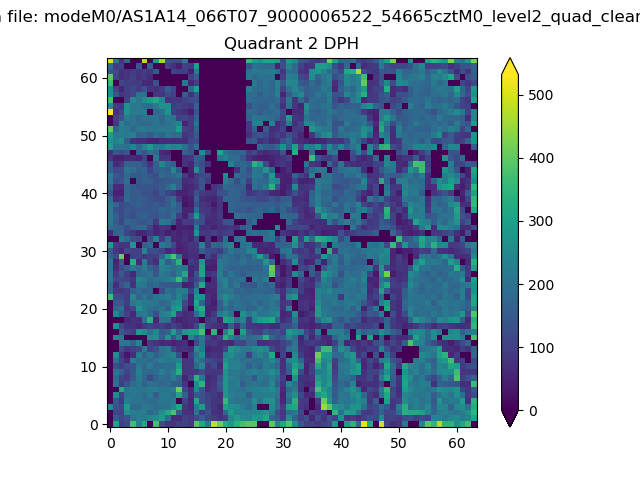 |
Quadrant C |
| Plot type | Count rate plots | Images |
|---|---|---|
| Comparison with Poisson distribution Blue bars denote a histogram of data divided into 1 sec bins. Red curve is a Poisson curve with rate = median count rate of data. |
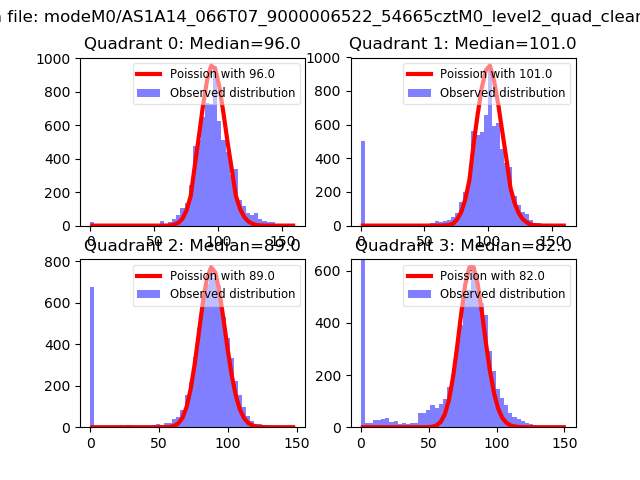 |
 |
| Quadrant-wise count rates Data is divided into 100 sec bins |
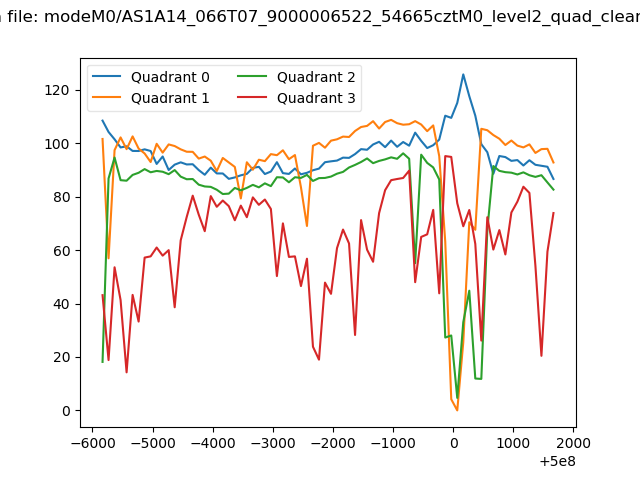 |
|
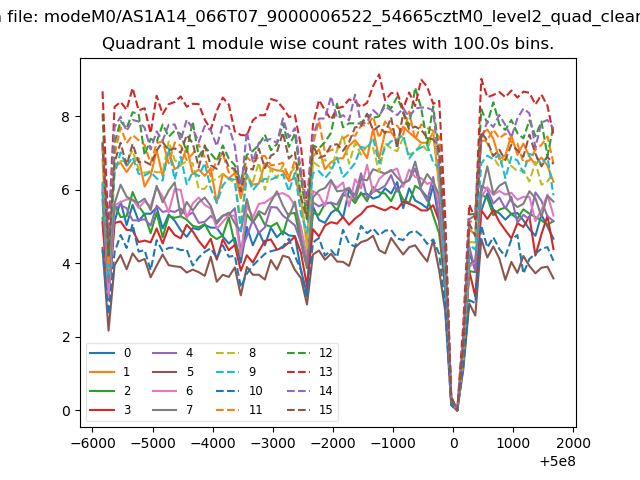
| Module-wise count rates for Quadrant A Data is divided into 100 sec bins |
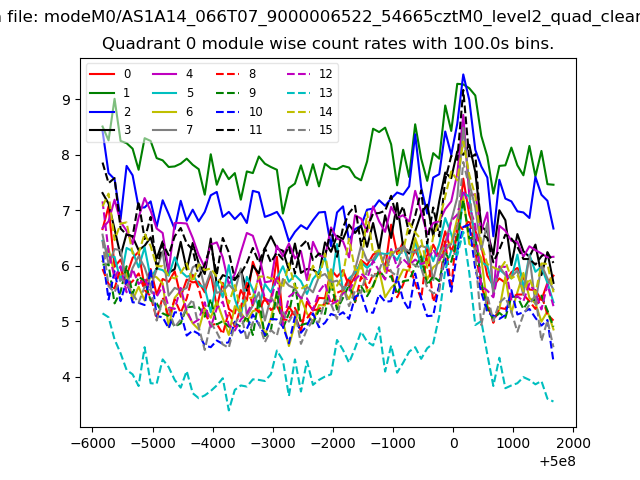 |
 |
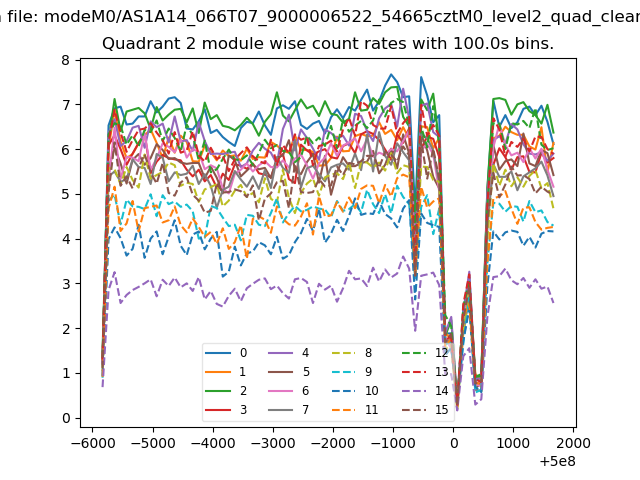
| Module-wise count rates for Quadrant B Data is divided into 100 sec bins |
 |
 |
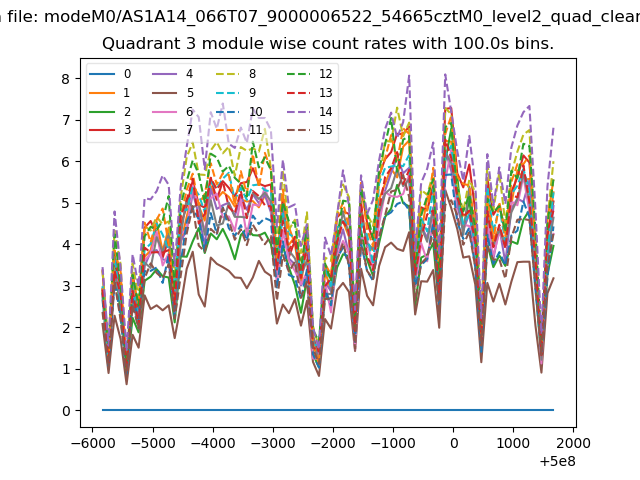
| Module-wise count rates for Quadrant C Data is divided into 100 sec bins |
 |
 |
| Module-wise count rates for Quadrant D Data is divided into 100 sec bins |
 |
 |
| Parameter | Plot |
|---|---|
| CZT HV Monitor | 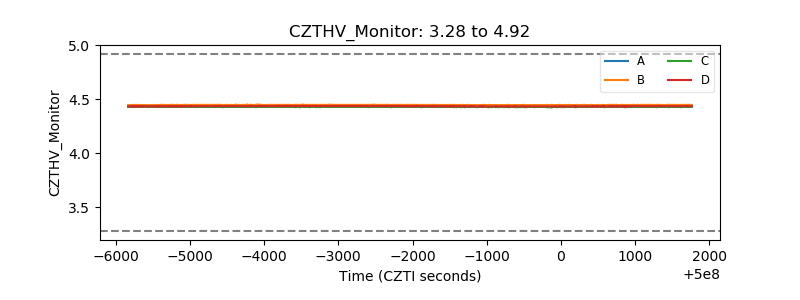 |
| D_VDD | 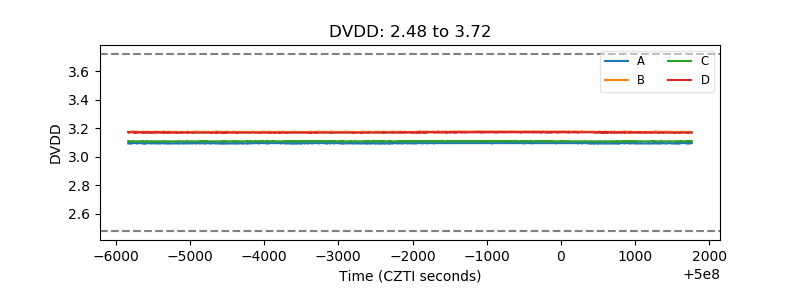 |
| Temperature 1 | 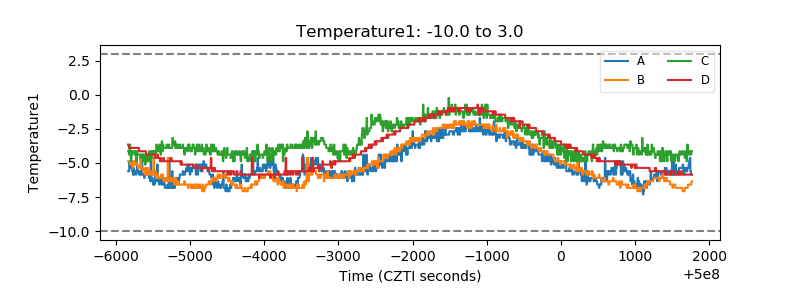 |
| Veto HV Monitor | 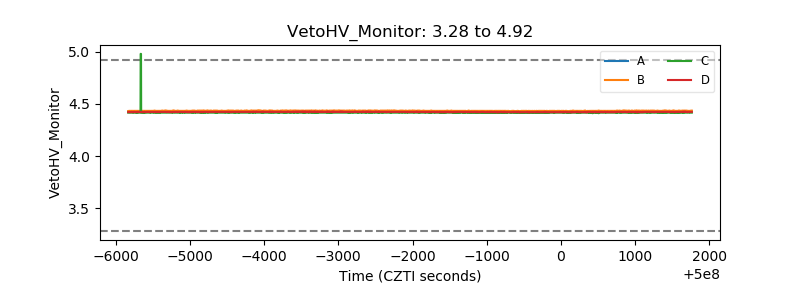 |
| Veto LLD | 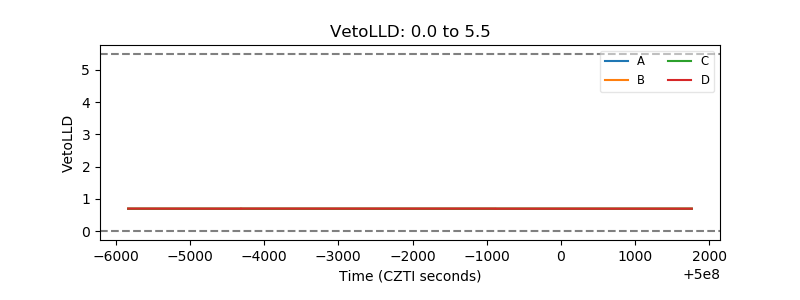 |
| Alpha Counter | 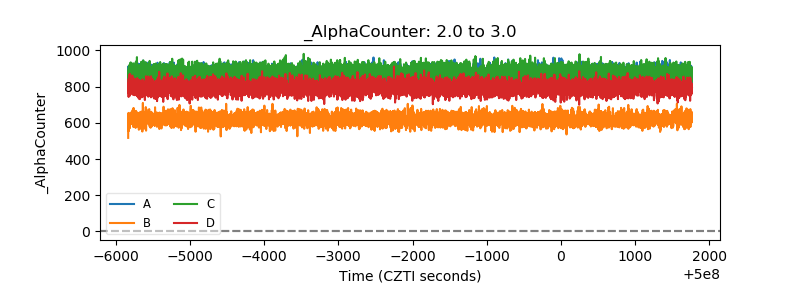 |
| _CPM_Rate | 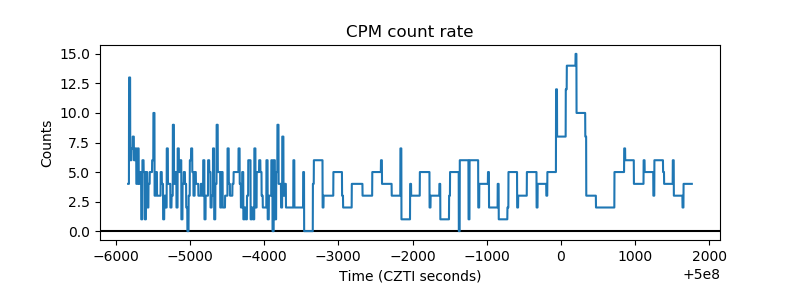 |
| CZT Counter | 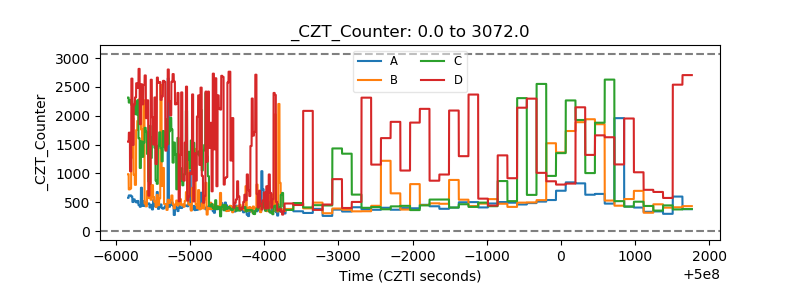 |
| +2.5 Volts monitor | 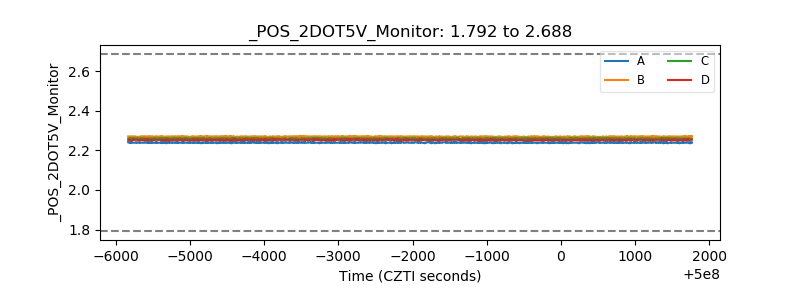 |
| +5 Volts monitor | 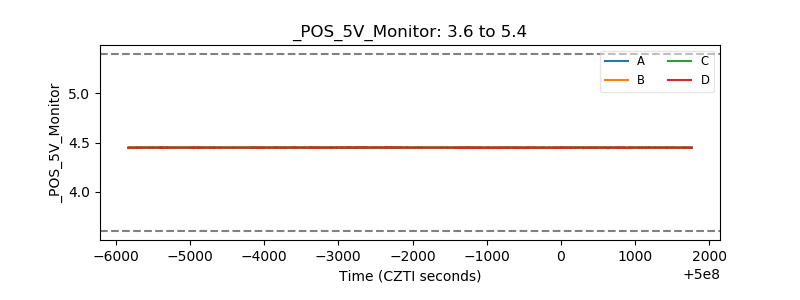 |
| _ROLL_ROT | 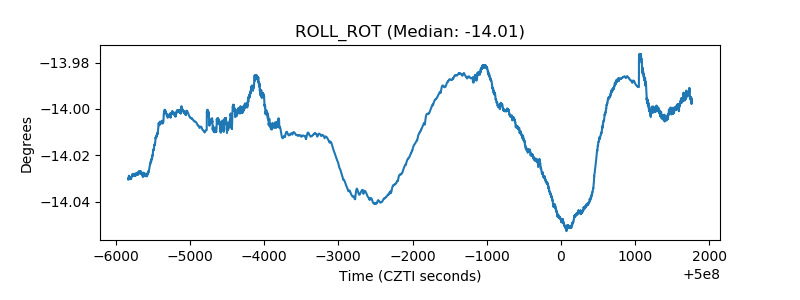 |
| _Roll_DEC | 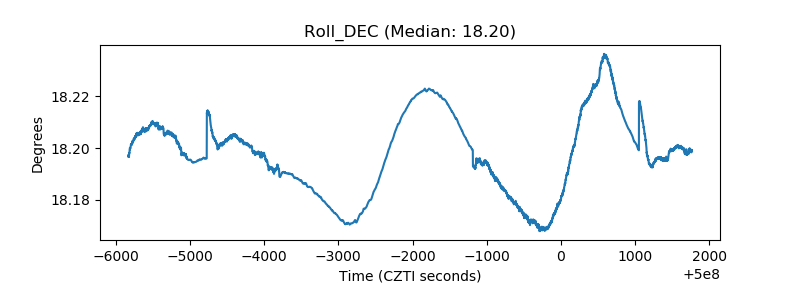 |
| _Roll_RA | 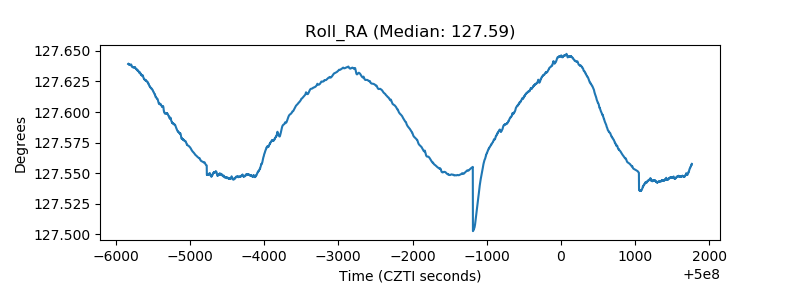 |
| Veto Counter | 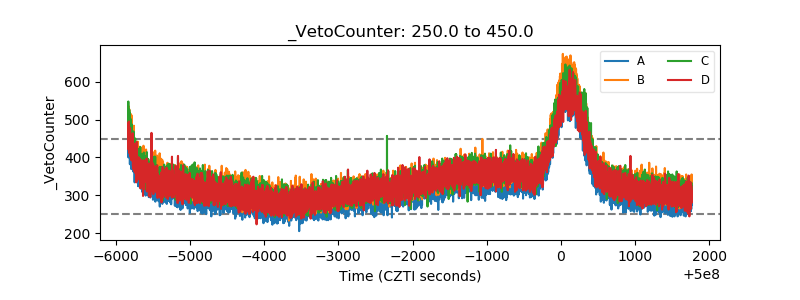 |