| Param | Original file | Final file |
|---|---|---|
| Filename | modeM0/AS1A14_066T07_9000006522_54666cztM0_level2.fits | modeM0/AS1A14_066T07_9000006522_54666cztM0_level2_quad_clean.evt |
| Size (bytes) | 831,862,080 | 114,471,360 |
| Size | 793.3 MB | 109.2 MB |
| Events in quadrant A | 4,937,950 | 831,789 |
| Events in quadrant B | 5,578,672 | 839,910 |
| Events in quadrant C | 6,584,560 | 685,552 |
| Events in quadrant D | 13,004,704 | 493,739 |
| Mode M0 | |||
|---|---|---|---|
| Quadrant | BADHDUFLAG | Total packets | Discarded packets |
| A | 0 | 21350 | 0 |
| B | 0 | 23336 | 0 |
| C | 0 | 25971 | 0 |
| D | 0 | 44815 | 0 |
| Mode SS | |||
|---|---|---|---|
| Quadrant | BADHDUFLAG | Total packets | Discarded packets |
| A | 0 | 178 | 0 |
| B | 0 | 178 | 0 |
| C | 0 | 178 | 0 |
| D | 0 | 178 | 0 |
| Quadrant | Total seconds | Saturated seconds | Saturation percentage |
|---|---|---|---|
| A | 8855 | 269 | 3.037832% |
| B | 8855 | 630 | 7.114625% |
| C | 8856 | 1213 | 13.696929% |
| D | 8856 | 3347 | 37.793586% |
Noise dominated data is calculated using 1-second bins in cleaned event files. If a bin has >2000 counts, and if more than 50% of those come from <1% of pixels, then it is considered to be noise-dominated and hence unusable.
| Quadrant | # 1 sec bins | Bins with >0 counts | Bins with >2000 counts | High rate bins dominated by noise | Noise dominated (total time) | Noise dominated (detector-on time) | Marked lightcurve |
|---|---|---|---|---|---|---|---|
| A | 8855 | 8855 | 183 | 183 | 2.07% | 2.07% | 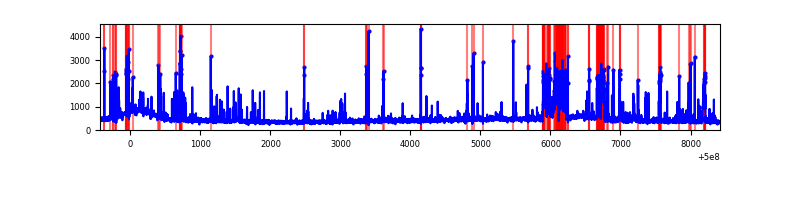 |
| B | 8855 | 8855 | 206 | 206 | 2.33% | 2.33% | 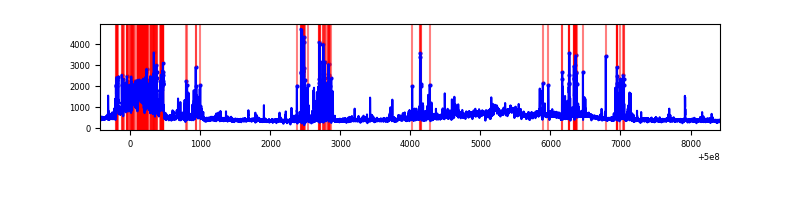 |
| C | 8856 | 8856 | 832 | 832 | 9.39% | 9.39% | 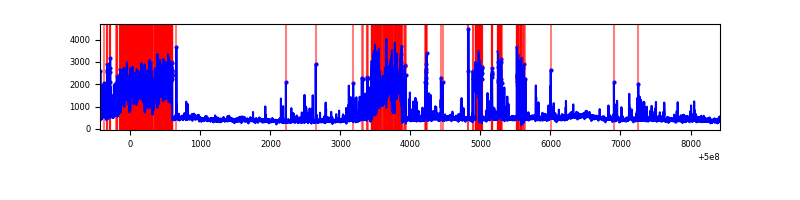 |
| D | 8856 | 8856 | 2934 | 2934 | 33.13% | 33.13% | 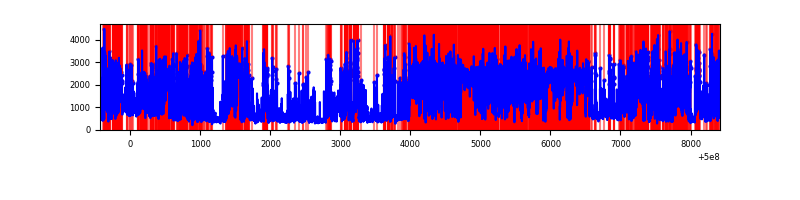 |
Top three noisy pixels from each quadrant. If the there are fewer than three noisy pixels in the level2.evt file, extra rows are filled as -1
| Pixel properties | Quadrant properties | ||||||
|---|---|---|---|---|---|---|---|
| Quadrant | DetID | PixID | Counts | Sigma | Mean | Median | Sigma |
| A | 7 | 14 | 577153 | 2378.58 | 976 | 953 | 242.2 |
| A | 11 | 3 | 328978 | 1354.1 | 976 | 953 | 242.2 |
| A | 0 | 8 | 176084 | 722.95 | 976 | 953 | 242.2 |
| B | 2 | 249 | 1099930 | 5414.54 | 943 | 910 | 203.0 |
| B | 5 | 172 | 323847 | 1591.01 | 943 | 910 | 203.0 |
| B | 0 | 213 | 222069 | 1089.58 | 943 | 910 | 203.0 |
| C | 3 | 242 | 1167393 | 4766.97 | 890 | 882 | 244.7 |
| C | 4 | 5 | 1122897 | 4585.14 | 890 | 882 | 244.7 |
| C | 6 | 223 | 238570 | 971.32 | 890 | 882 | 244.7 |
| D | 11 | 129 | 8649026 | 41200.51 | 737 | 704 | 209.9 |
| D | 11 | 176 | 1221366 | 5815.22 | 737 | 704 | 209.9 |
| D | 5 | 173 | 61823 | 291.17 | 737 | 704 | 209.9 |
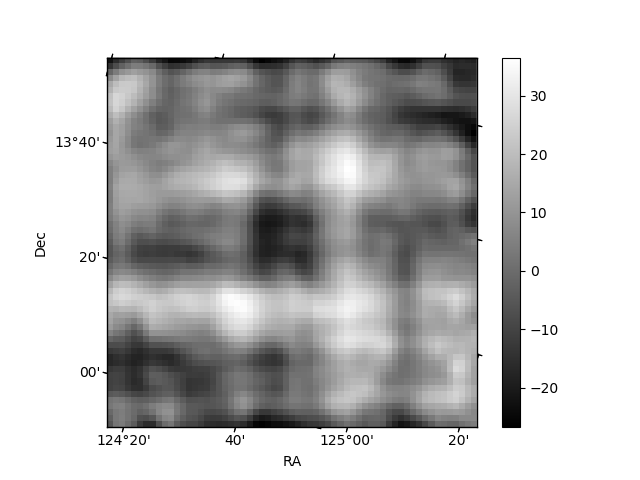
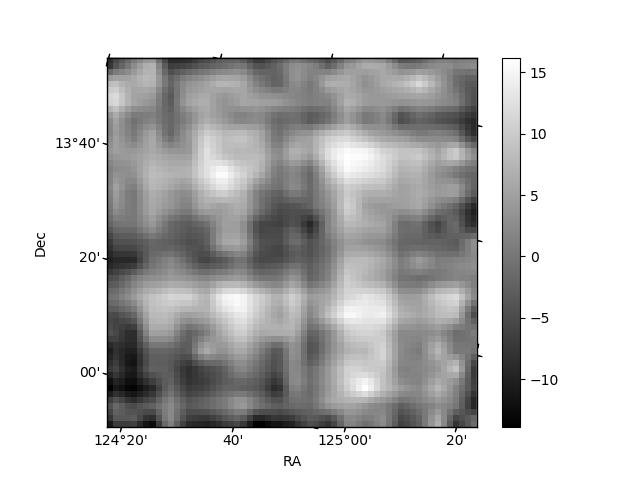
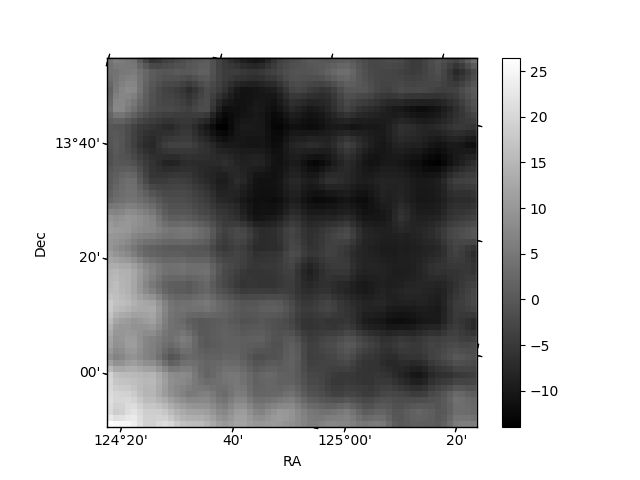
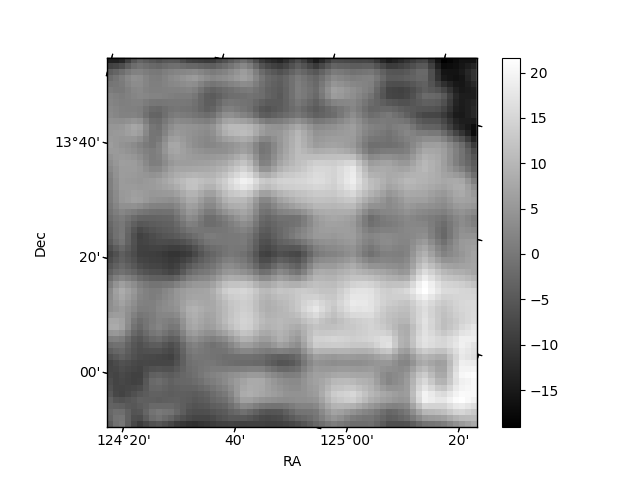
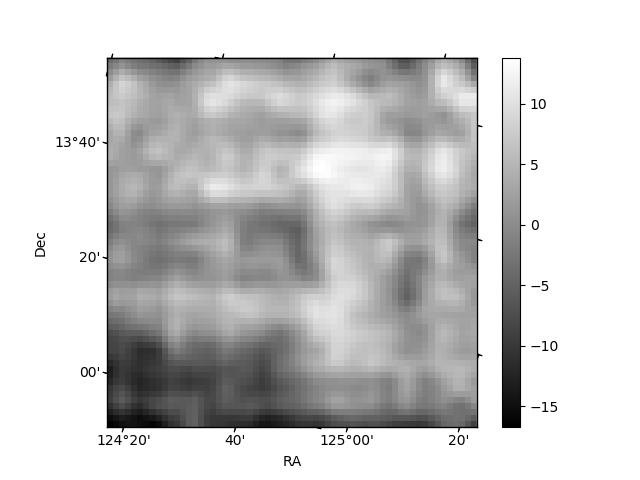
Histogram calculated using DETX and DETY for each event in the final _common_clean file
| Quadrant A | 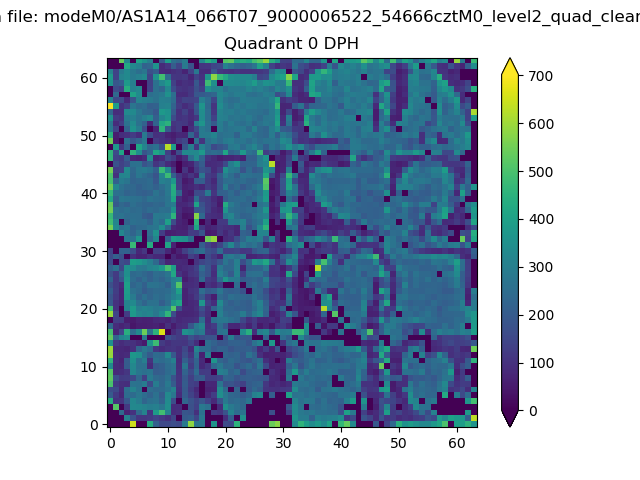 |
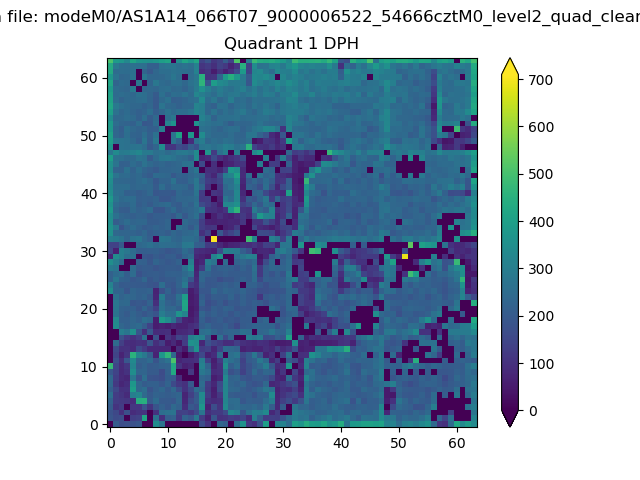 |
Quadrant B |
|---|---|---|---|
| Quadrant D | 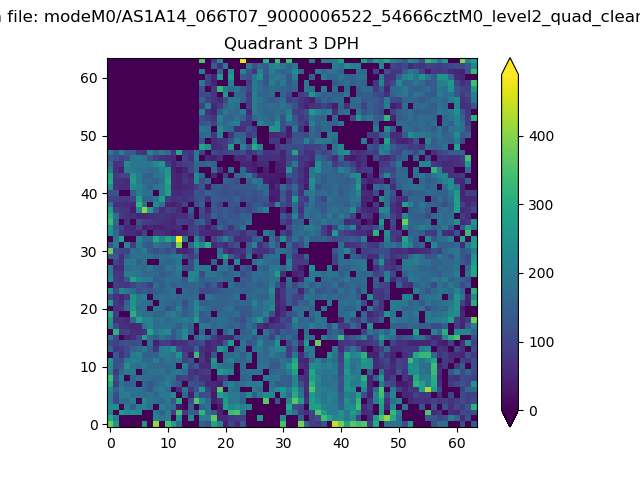 |
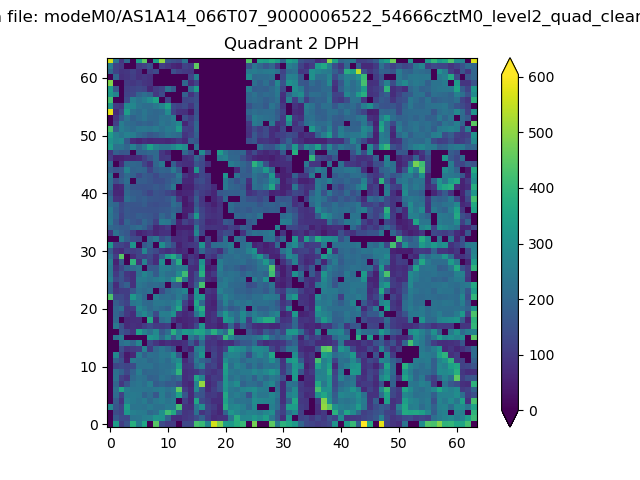 |
Quadrant C |
| Plot type | Count rate plots | Images |
|---|---|---|
| Comparison with Poisson distribution Blue bars denote a histogram of data divided into 1 sec bins. Red curve is a Poisson curve with rate = median count rate of data. |
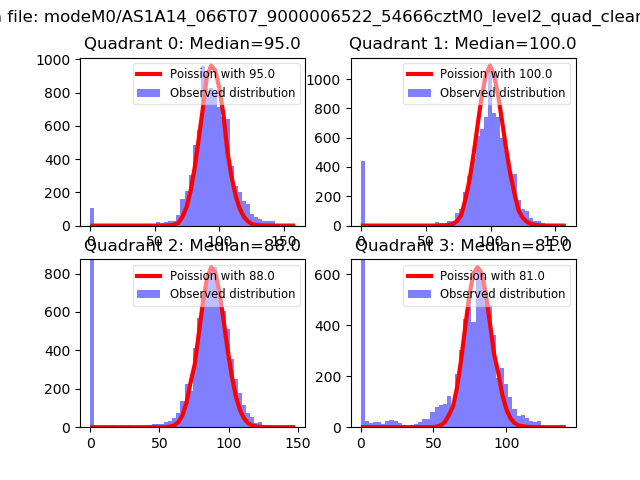 |
 |
| Quadrant-wise count rates Data is divided into 100 sec bins |
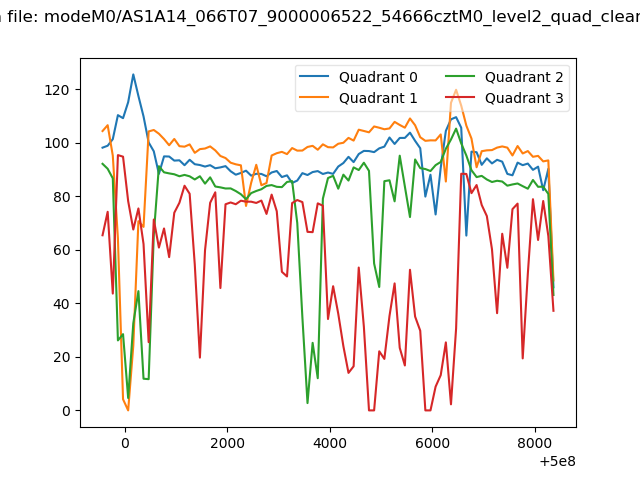 |
|
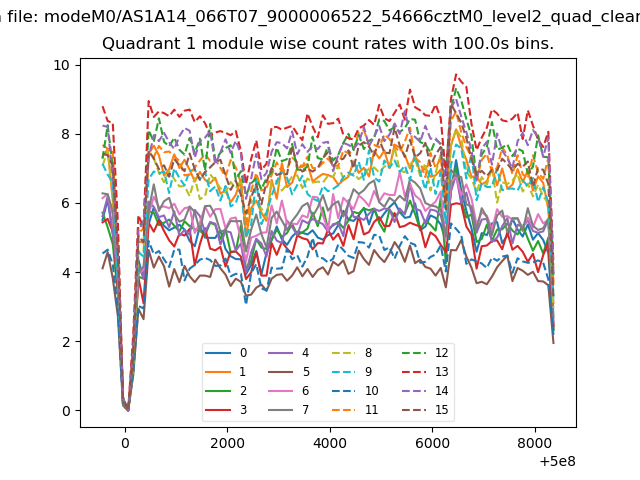
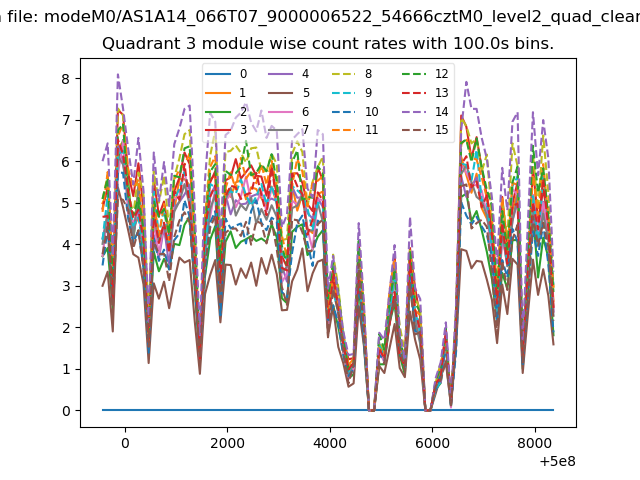
| Module-wise count rates for Quadrant A Data is divided into 100 sec bins |
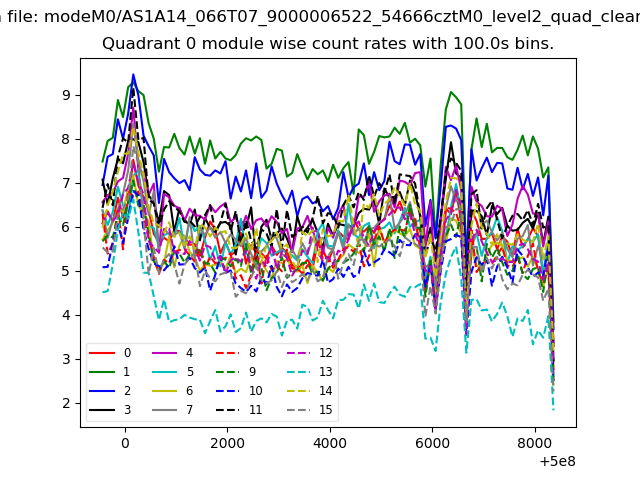 |
 |
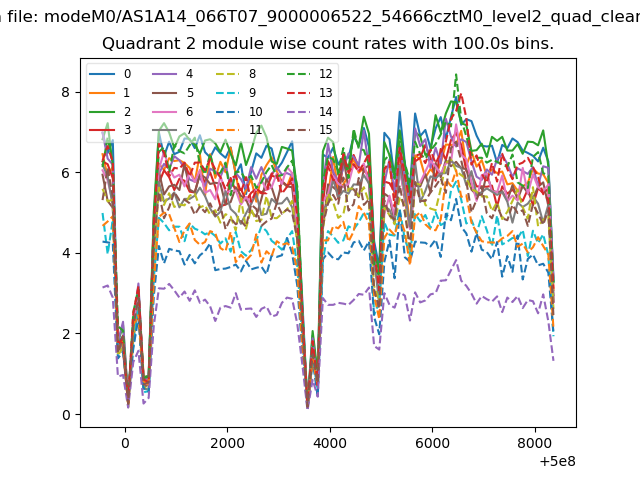
| Module-wise count rates for Quadrant B Data is divided into 100 sec bins |
 |
 |
| Module-wise count rates for Quadrant C Data is divided into 100 sec bins |
 |
 |
| Module-wise count rates for Quadrant D Data is divided into 100 sec bins |
 |
 |
| Parameter | Plot |
|---|---|
| CZT HV Monitor | 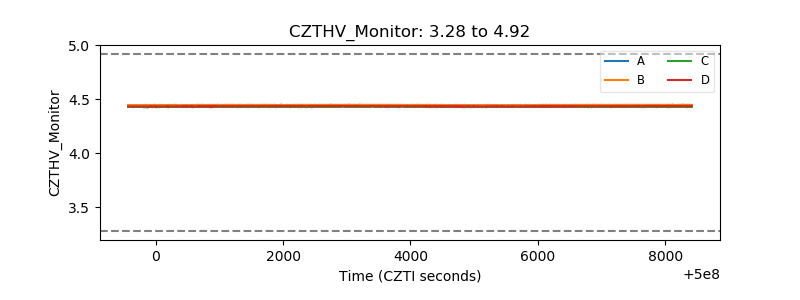 |
| D_VDD | 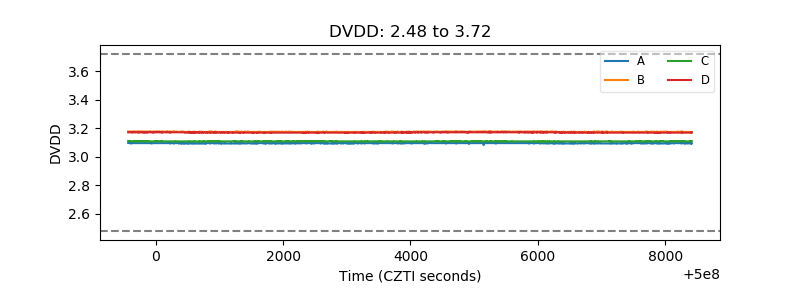 |
| Temperature 1 | 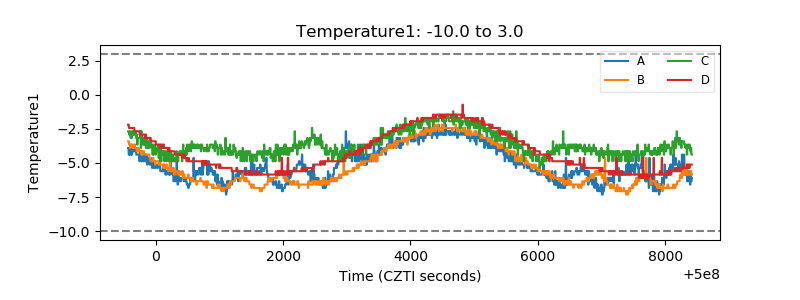 |
| Veto HV Monitor | 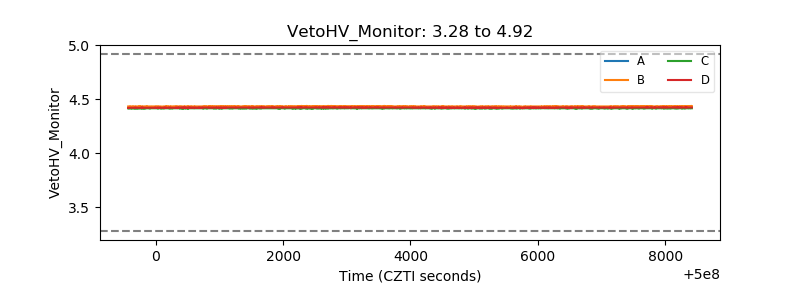 |
| Veto LLD | 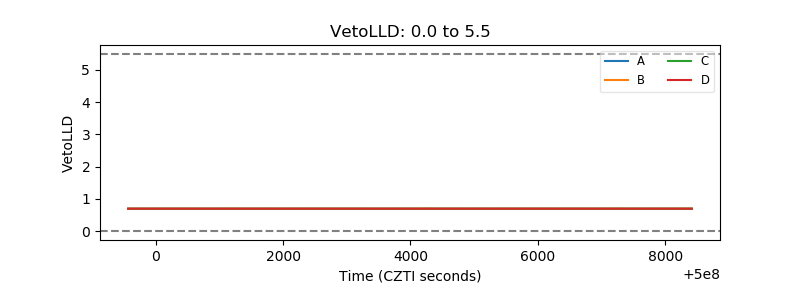 |
| Alpha Counter | 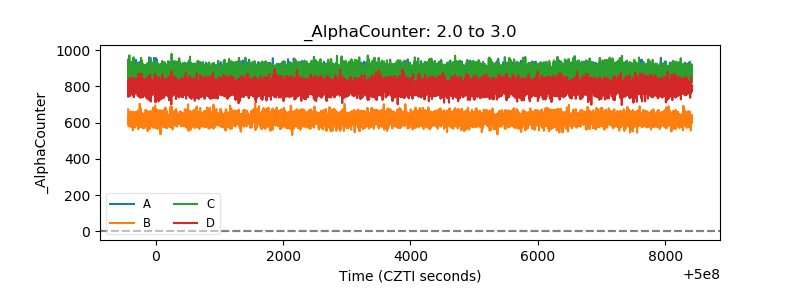 |
| _CPM_Rate | 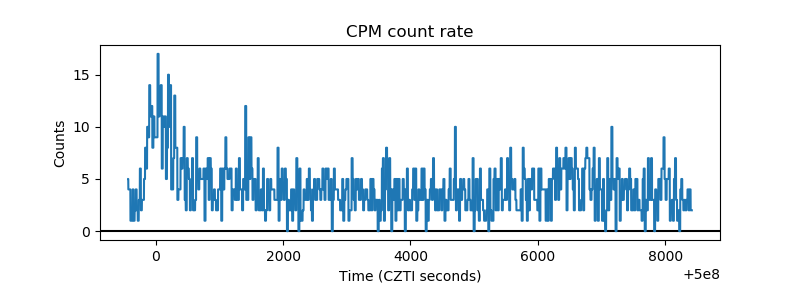 |
| CZT Counter | 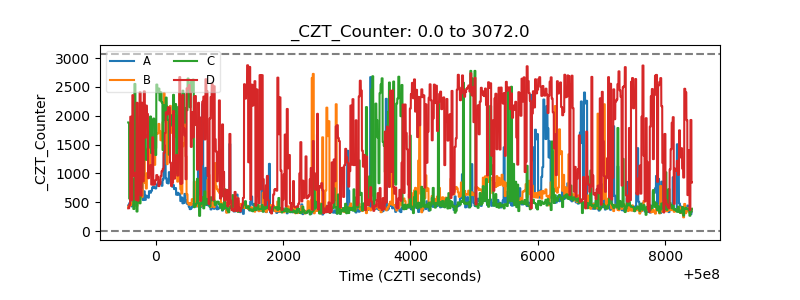 |
| +2.5 Volts monitor | 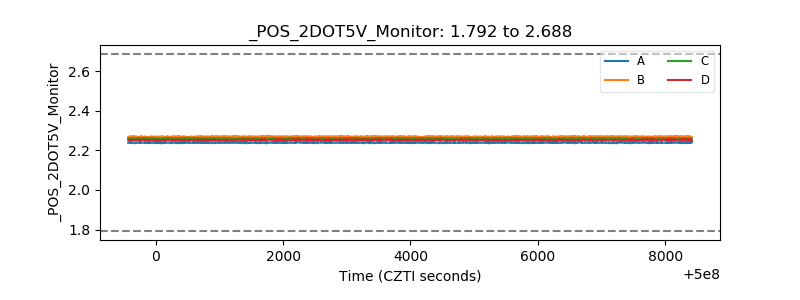 |
| +5 Volts monitor | 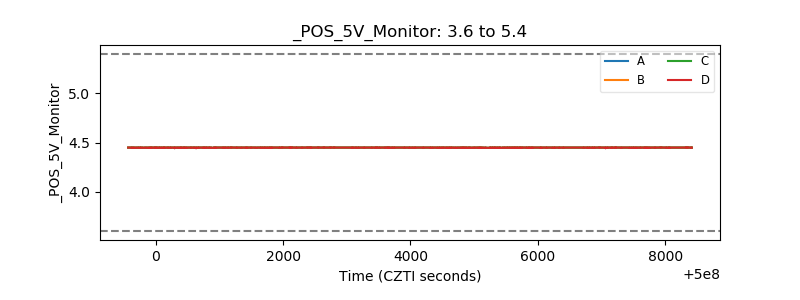 |
| _ROLL_ROT | 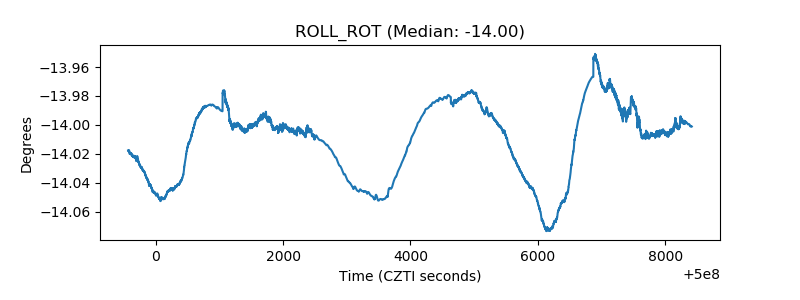 |
| _Roll_DEC | 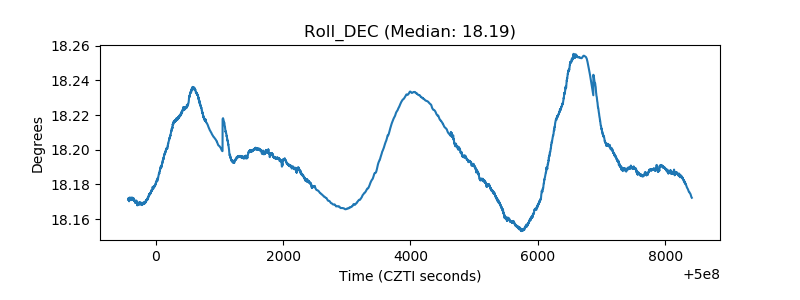 |
| _Roll_RA | 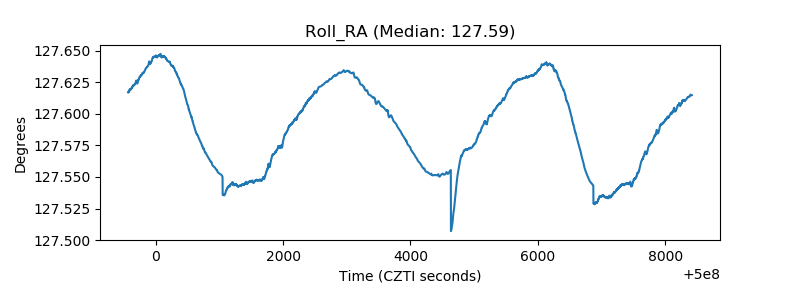 |
| Veto Counter | 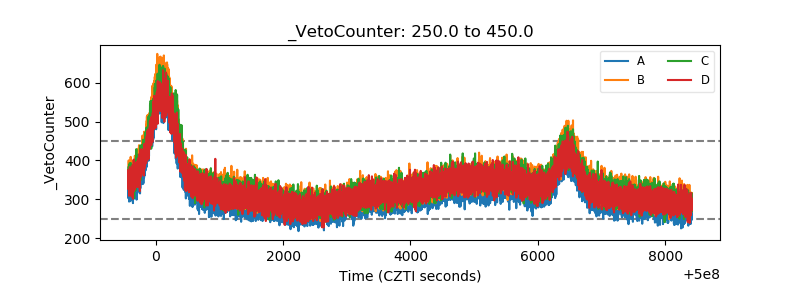 |