| Param | Original file | Final file |
|---|---|---|
| Filename | modeM0/AS1A14_066T07_9000006522_54670cztM0_level2.fits | modeM0/AS1A14_066T07_9000006522_54670cztM0_level2_quad_clean.evt |
| Size (bytes) | 2,158,280,640 | 342,377,280 |
| Size | 2.0 GB | 326.5 MB |
| Events in quadrant A | 14,501,010 | 2,316,365 |
| Events in quadrant B | 12,816,114 | 2,511,923 |
| Events in quadrant C | 20,200,785 | 2,038,731 |
| Events in quadrant D | 30,399,583 | 1,740,149 |
| Mode M9 | |||
|---|---|---|---|
| Quadrant | BADHDUFLAG | Total packets | Discarded packets |
| A | 0 | 9 | 0 |
| B | 0 | 9 | 0 |
| C | 0 | 9 | 0 |
| D | 0 | 9 | 0 |
| Mode M0 | |||
|---|---|---|---|
| Quadrant | BADHDUFLAG | Total packets | Discarded packets |
| A | 0 | 62080 | 10 |
| B | 0 | 56768 | 2 |
| C | 0 | 77850 | 8 |
| D | 0 | 108028 | 2 |
| Mode SS | |||
|---|---|---|---|
| Quadrant | BADHDUFLAG | Total packets | Discarded packets |
| A | 0 | 516 | 0 |
| B | 0 | 516 | 0 |
| C | 0 | 516 | 0 |
| D | 0 | 516 | 0 |
| Quadrant | Total seconds | Saturated seconds | Saturation percentage |
|---|---|---|---|
| A | 25557 | 1042 | 4.077161% |
| B | 25559 | 639 | 2.500098% |
| C | 25556 | 2834 | 11.089372% |
| D | 25559 | 5914 | 23.138620% |
Noise dominated data is calculated using 1-second bins in cleaned event files. If a bin has >2000 counts, and if more than 50% of those come from <1% of pixels, then it is considered to be noise-dominated and hence unusable.
| Quadrant | # 1 sec bins | Bins with >0 counts | Bins with >2000 counts | High rate bins dominated by noise | Noise dominated (total time) | Noise dominated (detector-on time) | Marked lightcurve |
|---|---|---|---|---|---|---|---|
| A | 26439 | 25558 | 595 | 595 | 2.25% | 2.33% | 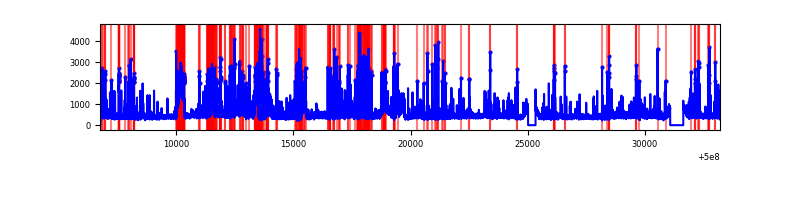 |
| B | 26439 | 25560 | 283 | 283 | 1.07% | 1.11% | 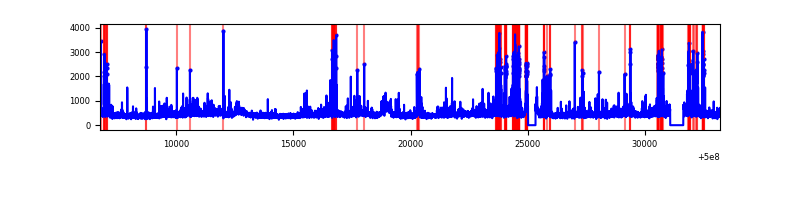 |
| C | 26439 | 25557 | 2400 | 2400 | 9.08% | 9.39% | 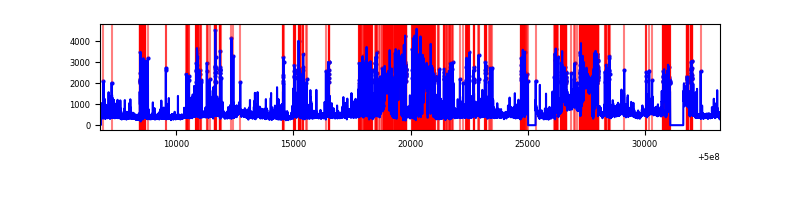 |
| D | 26439 | 25560 | 5172 | 5172 | 19.56% | 20.23% | 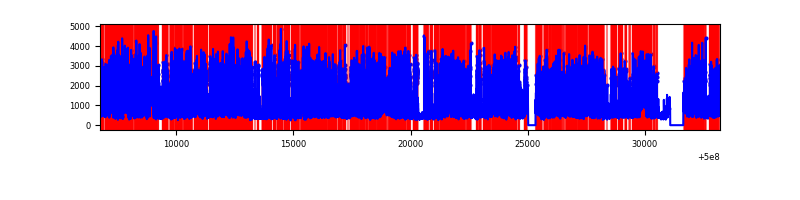 |
Top three noisy pixels from each quadrant. If the there are fewer than three noisy pixels in the level2.evt file, extra rows are filled as -1
| Pixel properties | Quadrant properties | ||||||
|---|---|---|---|---|---|---|---|
| Quadrant | DetID | PixID | Counts | Sigma | Mean | Median | Sigma |
| A | 7 | 14 | 2075756 | 3103.27 | 2710 | 2636 | 668.0 |
| A | 11 | 3 | 1110077 | 1657.74 | 2710 | 2636 | 668.0 |
| A | 0 | 8 | 503800 | 750.2 | 2710 | 2636 | 668.0 |
| B | 2 | 249 | 1027683 | 1780.75 | 2691 | 2591 | 575.7 |
| B | 0 | 213 | 509194 | 880.05 | 2691 | 2591 | 575.7 |
| B | 10 | 247 | 432489 | 746.8 | 2691 | 2591 | 575.7 |
| C | 4 | 5 | 3882641 | 5625.18 | 2522 | 2504 | 689.8 |
| C | 9 | 38 | 2799238 | 4054.53 | 2522 | 2504 | 689.8 |
| C | 15 | 157 | 1474407 | 2133.87 | 2522 | 2504 | 689.8 |
| D | 11 | 129 | 19429813 | 28645.61 | 2392 | 2291 | 678.2 |
| D | 11 | 176 | 415614 | 609.44 | 2392 | 2291 | 678.2 |
| D | 2 | 62 | 369233 | 541.05 | 2392 | 2291 | 678.2 |
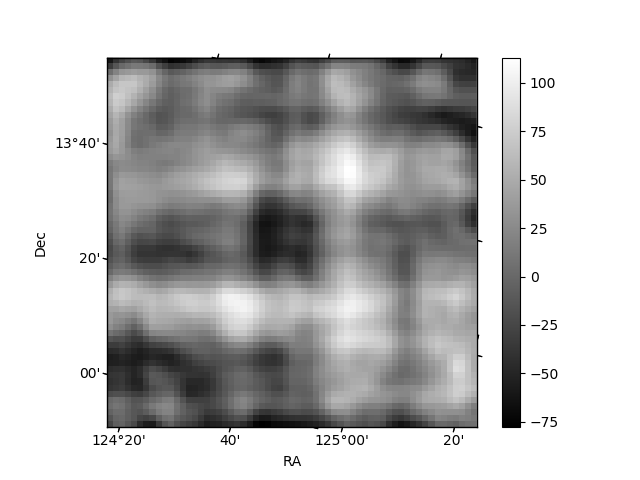
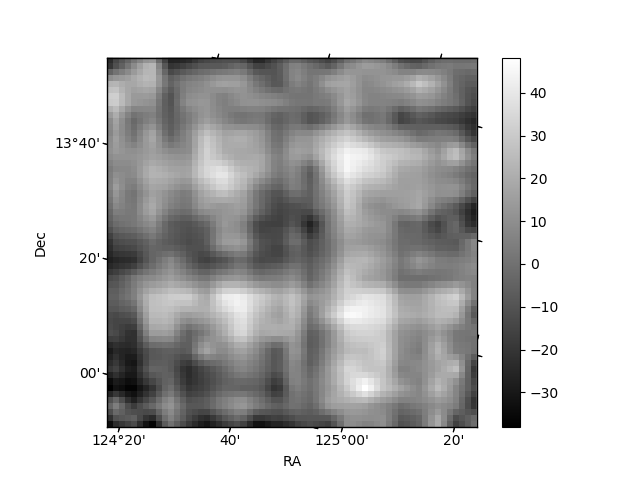
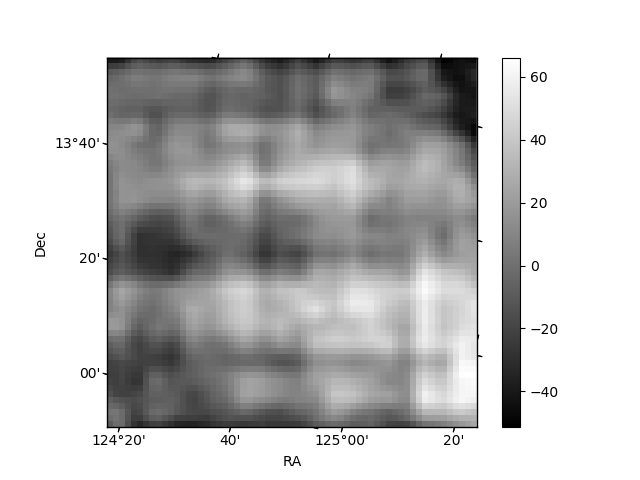
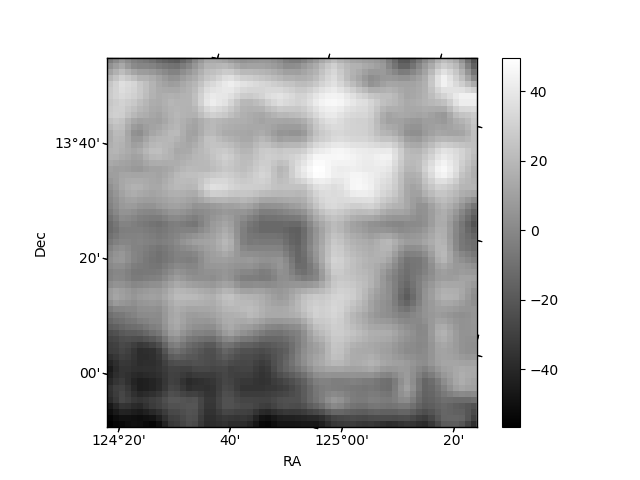
Histogram calculated using DETX and DETY for each event in the final _common_clean file
| Quadrant A | 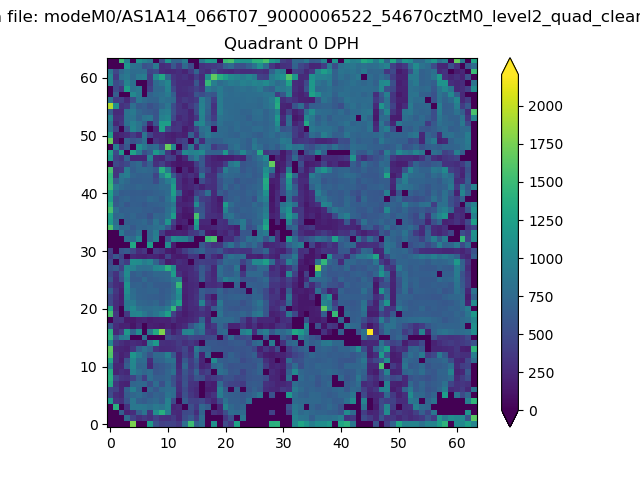 |
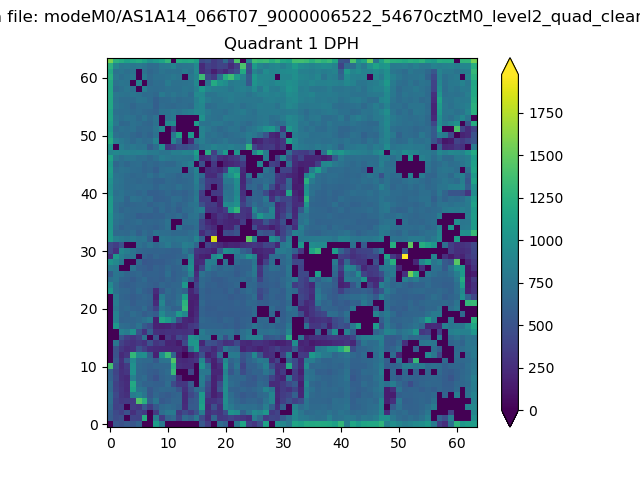 |
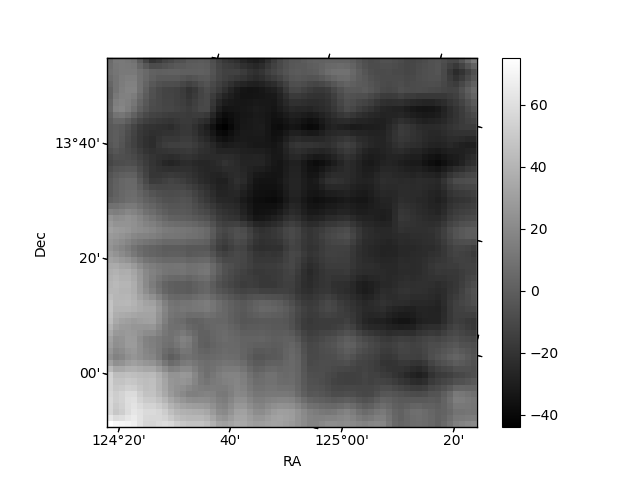
Quadrant B |
|---|---|---|---|
| Quadrant D | 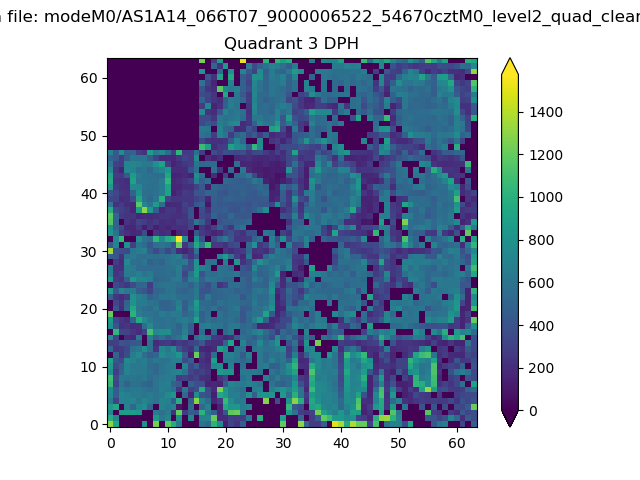 |
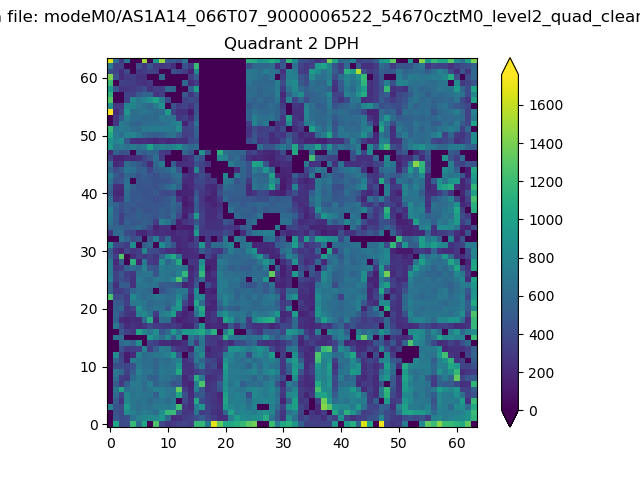 |
Quadrant C |
| Plot type | Count rate plots | Images |
|---|---|---|
| Comparison with Poisson distribution Blue bars denote a histogram of data divided into 1 sec bins. Red curve is a Poisson curve with rate = median count rate of data. |
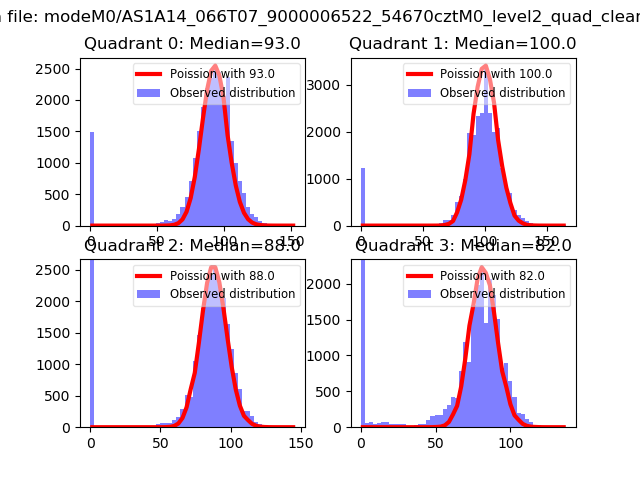 |
 |
| Quadrant-wise count rates Data is divided into 100 sec bins |
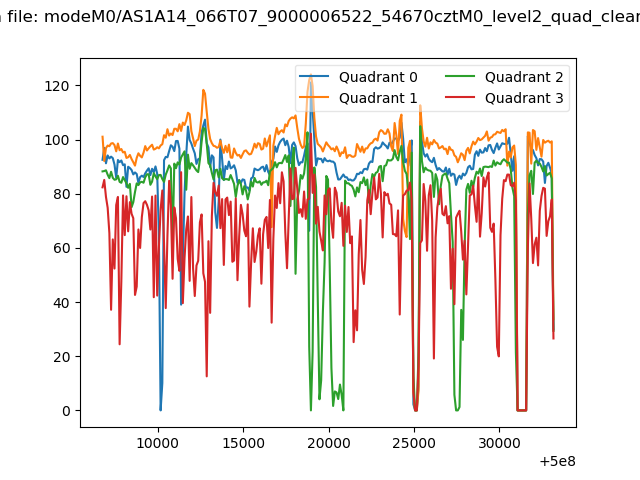 |
|
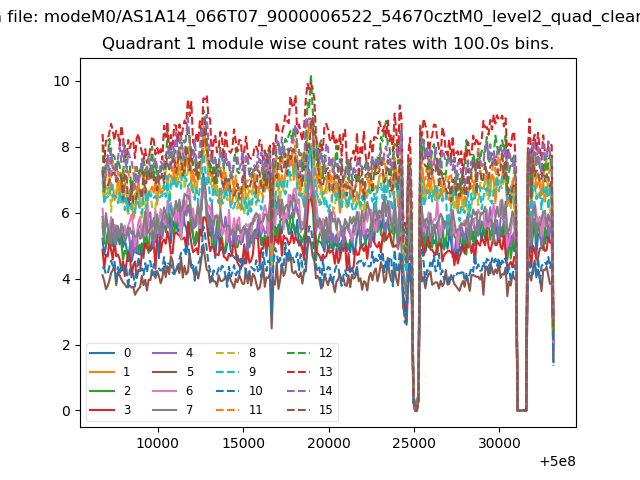
| Module-wise count rates for Quadrant A Data is divided into 100 sec bins |
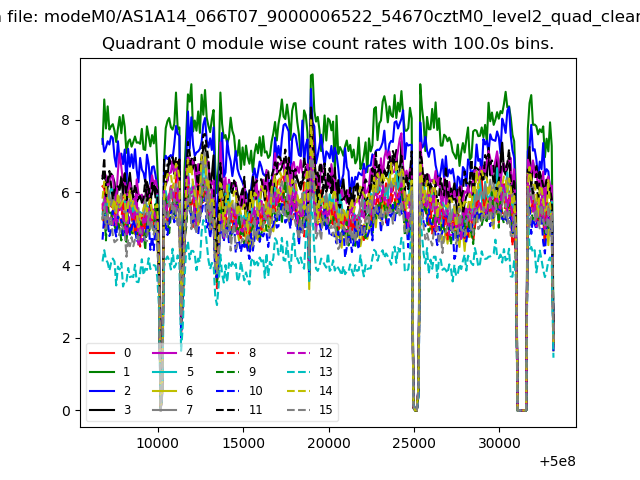 |
 |
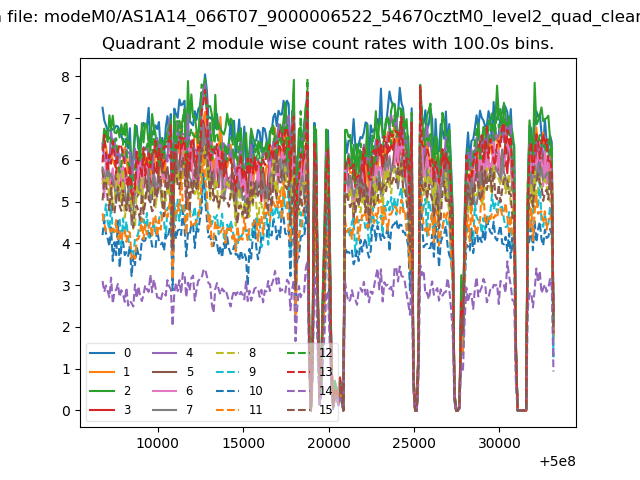
| Module-wise count rates for Quadrant B Data is divided into 100 sec bins |
 |
 |
| Module-wise count rates for Quadrant C Data is divided into 100 sec bins |
 |
 |
| Module-wise count rates for Quadrant D Data is divided into 100 sec bins |
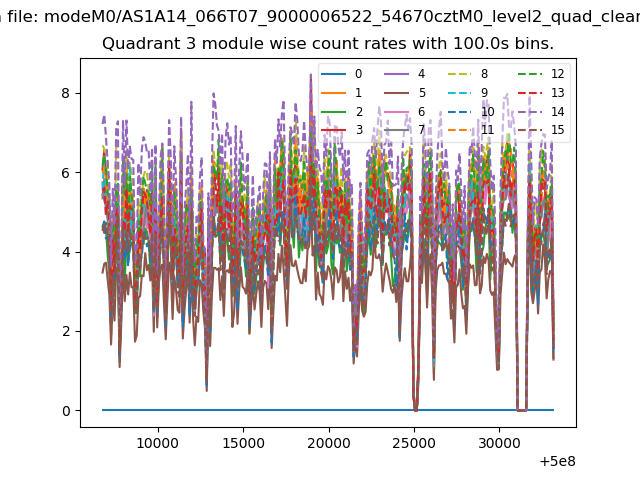 |
 |
| Parameter | Plot |
|---|---|
| CZT HV Monitor |  |
| D_VDD | 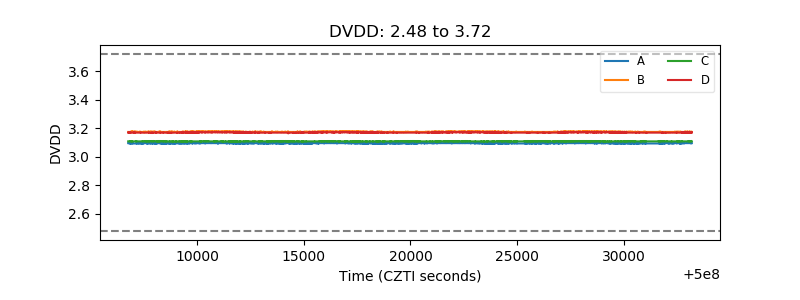 |
| Temperature 1 | 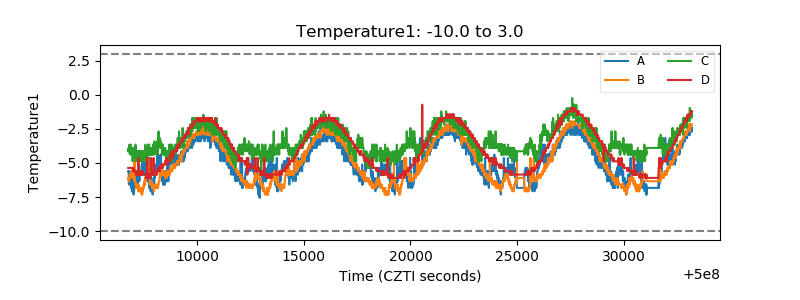 |
| Veto HV Monitor | 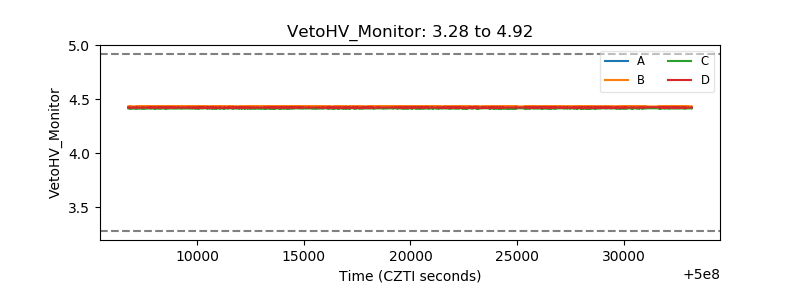 |
| Veto LLD | 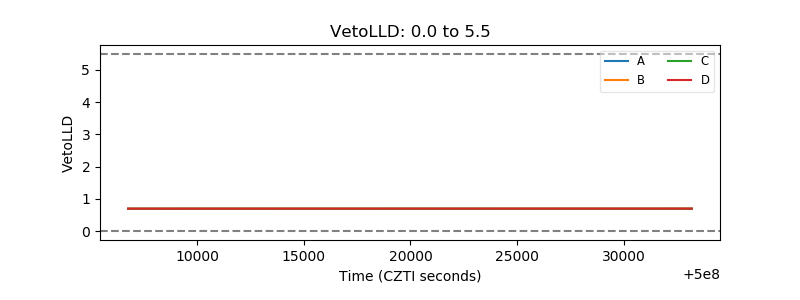 |
| Alpha Counter | 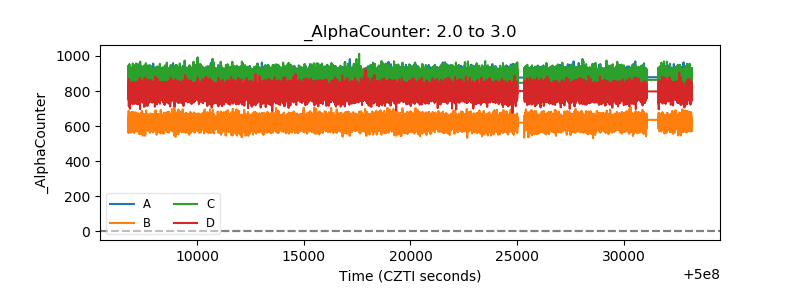 |
| _CPM_Rate | 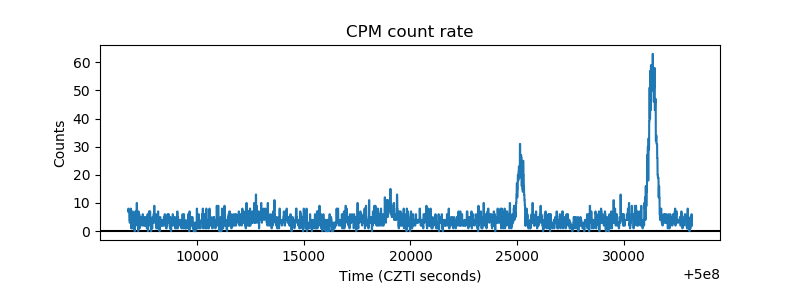 |
| CZT Counter | 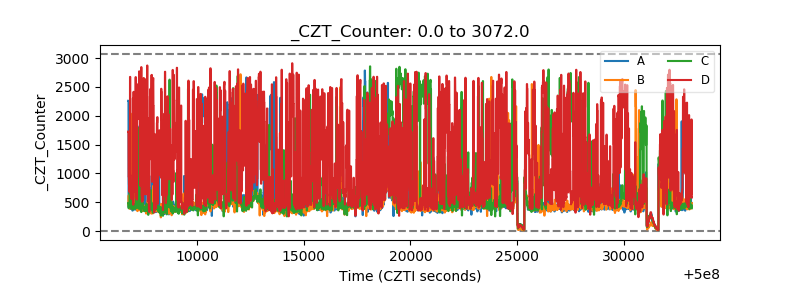 |
| +2.5 Volts monitor |  |
| +5 Volts monitor |  |
| _ROLL_ROT | 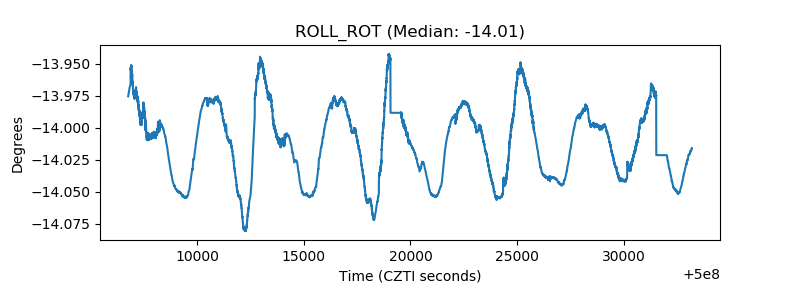 |
| _Roll_DEC | 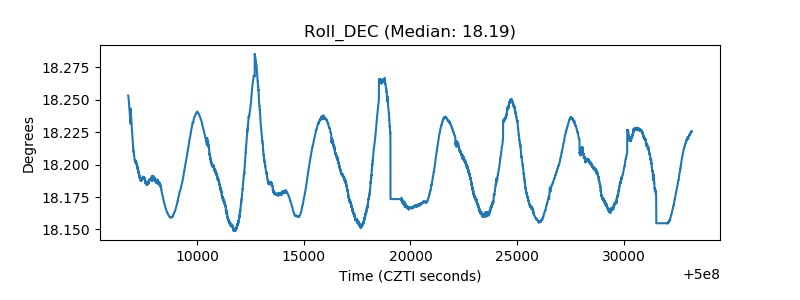 |
| _Roll_RA | 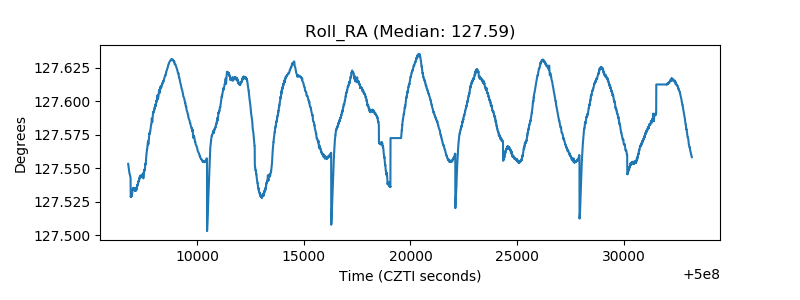 |
| Veto Counter | 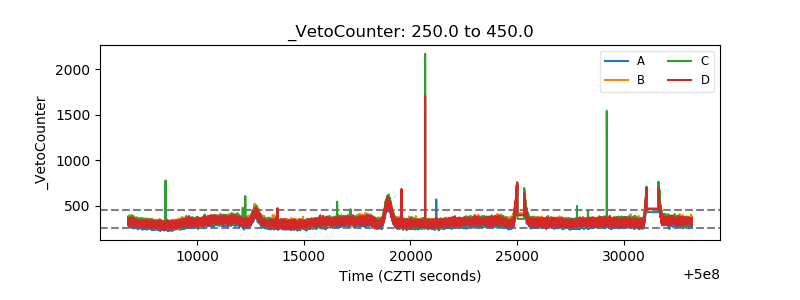 |