| Param | Original file | Final file |
|---|---|---|
| Filename | modeM0/AS1A14_066T07_9000006522_54671cztM0_level2.fits | modeM0/AS1A14_066T07_9000006522_54671cztM0_level2_quad_clean.evt |
| Size (bytes) | 534,752,640 | 88,174,080 |
| Size | 510.0 MB | 84.1 MB |
| Events in quadrant A | 3,491,211 | 597,882 |
| Events in quadrant B | 3,267,158 | 648,499 |
| Events in quadrant C | 3,750,262 | 570,342 |
| Events in quadrant D | 8,780,277 | 399,363 |
| Mode M9 | |||
|---|---|---|---|
| Quadrant | BADHDUFLAG | Total packets | Discarded packets |
| A | 0 | 9 | 0 |
| B | 0 | 9 | 0 |
| C | 0 | 9 | 0 |
| D | 0 | 9 | 0 |
| Mode M0 | |||
|---|---|---|---|
| Quadrant | BADHDUFLAG | Total packets | Discarded packets |
| A | 0 | 15072 | 0 |
| B | 0 | 14271 | 0 |
| C | 0 | 15540 | 0 |
| D | 0 | 30569 | 0 |
| Mode SS | |||
|---|---|---|---|
| Quadrant | BADHDUFLAG | Total packets | Discarded packets |
| A | 0 | 130 | 0 |
| B | 0 | 130 | 0 |
| C | 0 | 130 | 0 |
| D | 0 | 130 | 0 |
| Quadrant | Total seconds | Saturated seconds | Saturation percentage |
|---|---|---|---|
| A | 6508 | 183 | 2.811924% |
| B | 6508 | 101 | 1.551936% |
| C | 6509 | 149 | 2.289138% |
| D | 6509 | 2049 | 31.479490% |
Noise dominated data is calculated using 1-second bins in cleaned event files. If a bin has >2000 counts, and if more than 50% of those come from <1% of pixels, then it is considered to be noise-dominated and hence unusable.
| Quadrant | # 1 sec bins | Bins with >0 counts | Bins with >2000 counts | High rate bins dominated by noise | Noise dominated (total time) | Noise dominated (detector-on time) | Marked lightcurve |
|---|---|---|---|---|---|---|---|
| A | 7338 | 6508 | 109 | 109 | 1.49% | 1.67% | 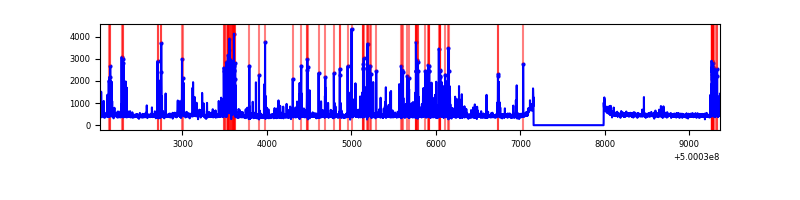 |
| B | 7338 | 6508 | 54 | 54 | 0.74% | 0.83% | 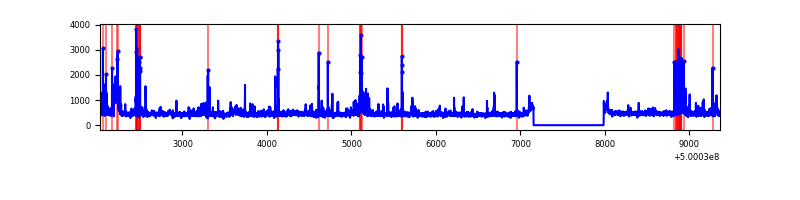 |
| C | 7339 | 6510 | 111 | 111 | 1.51% | 1.71% | 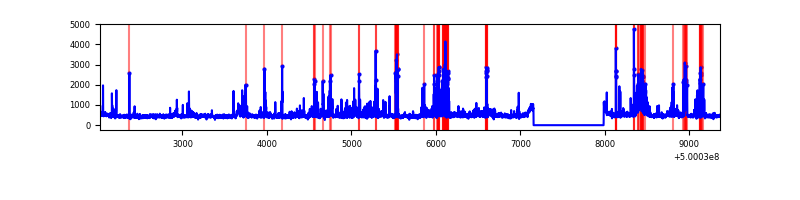 |
| D | 7338 | 6508 | 1828 | 1828 | 24.91% | 28.09% | 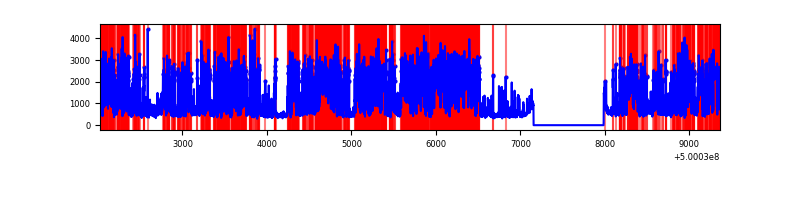 |
Top three noisy pixels from each quadrant. If the there are fewer than three noisy pixels in the level2.evt file, extra rows are filled as -1
| Pixel properties | Quadrant properties | ||||||
|---|---|---|---|---|---|---|---|
| Quadrant | DetID | PixID | Counts | Sigma | Mean | Median | Sigma |
| A | 11 | 3 | 382228 | 2235.04 | 695 | 678 | 170.7 |
| A | 5 | 240 | 182889 | 1067.35 | 695 | 678 | 170.7 |
| A | 0 | 8 | 108127 | 629.41 | 695 | 678 | 170.7 |
| B | 2 | 249 | 245624 | 1646.78 | 689 | 664 | 148.8 |
| B | 0 | 213 | 135063 | 903.51 | 689 | 664 | 148.8 |
| B | 10 | 247 | 83758 | 558.61 | 689 | 664 | 148.8 |
| C | 14 | 254 | 226808 | 1222.56 | 675 | 668 | 185.0 |
| C | 4 | 5 | 206051 | 1110.34 | 675 | 668 | 185.0 |
| C | 1 | 241 | 163247 | 878.93 | 675 | 668 | 185.0 |
| D | 11 | 129 | 6055278 | 36932.47 | 581 | 555 | 163.9 |
| D | 2 | 62 | 166808 | 1014.11 | 581 | 555 | 163.9 |
| D | 2 | 249 | 49481 | 298.44 | 581 | 555 | 163.9 |
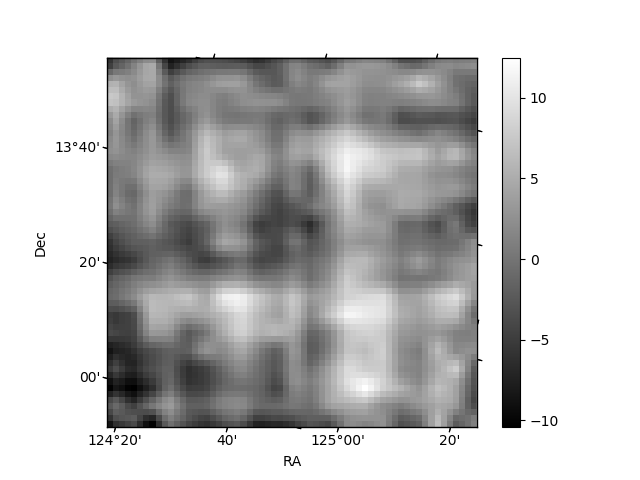
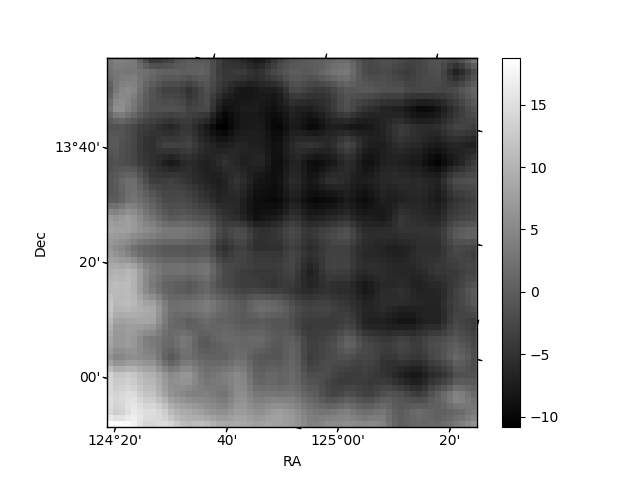
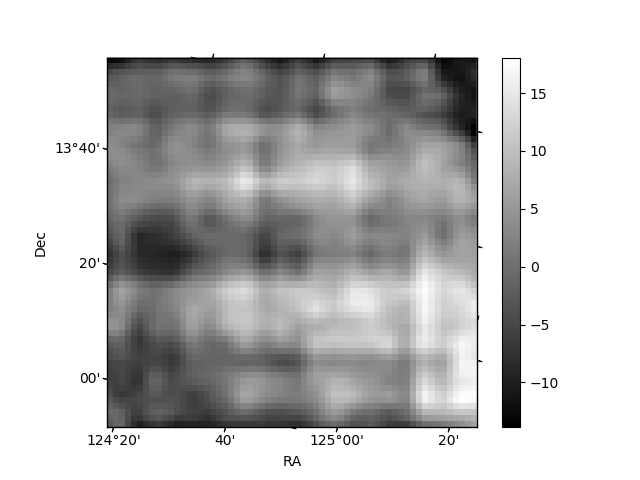
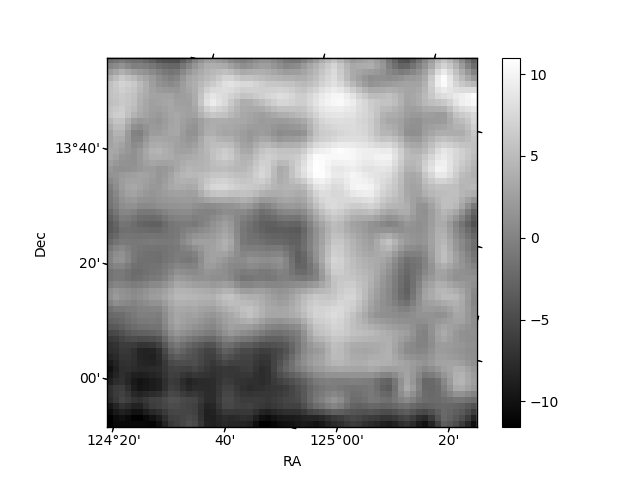
Histogram calculated using DETX and DETY for each event in the final _common_clean file
| Quadrant A | 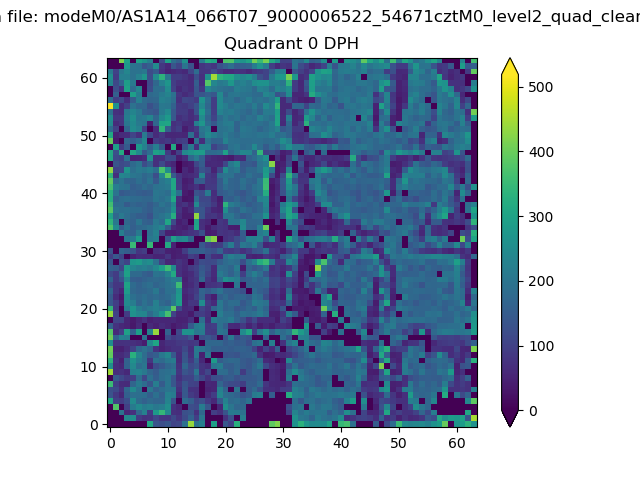 |
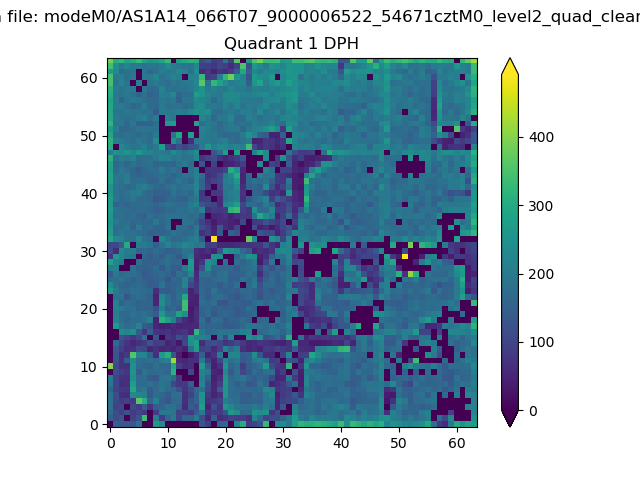 |
Quadrant B |
|---|---|---|---|
| Quadrant D | 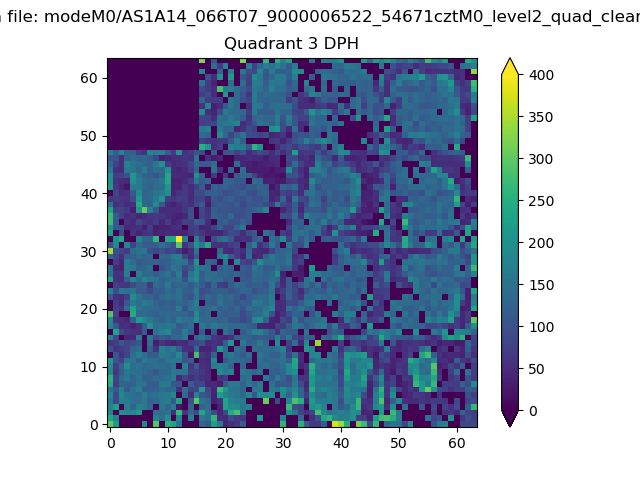 |
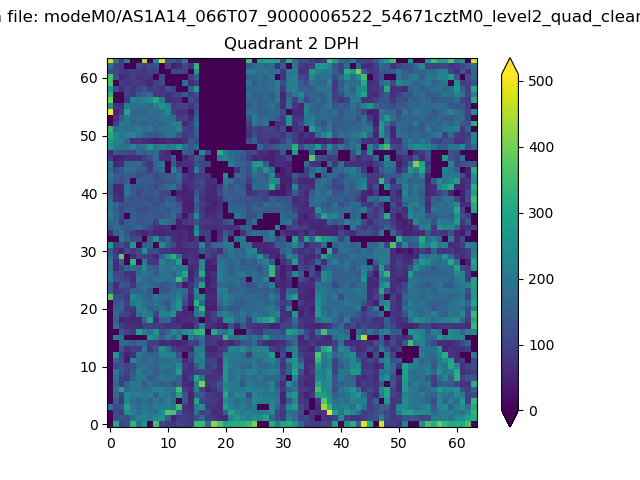 |
Quadrant C |
| Plot type | Count rate plots | Images |
|---|---|---|
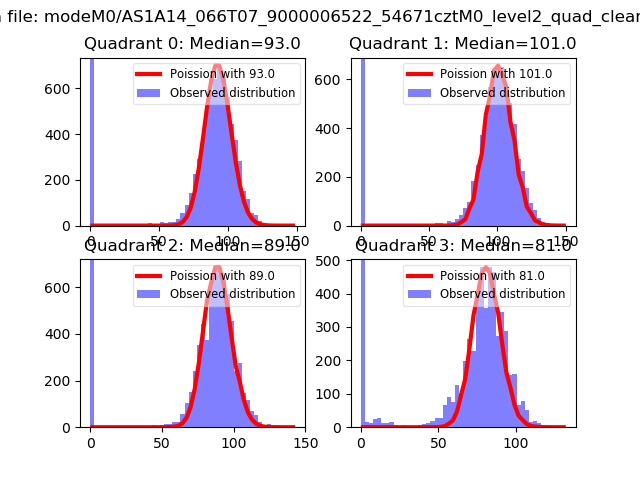
| Comparison with Poisson distribution Blue bars denote a histogram of data divided into 1 sec bins. Red curve is a Poisson curve with rate = median count rate of data. |
 |
 |
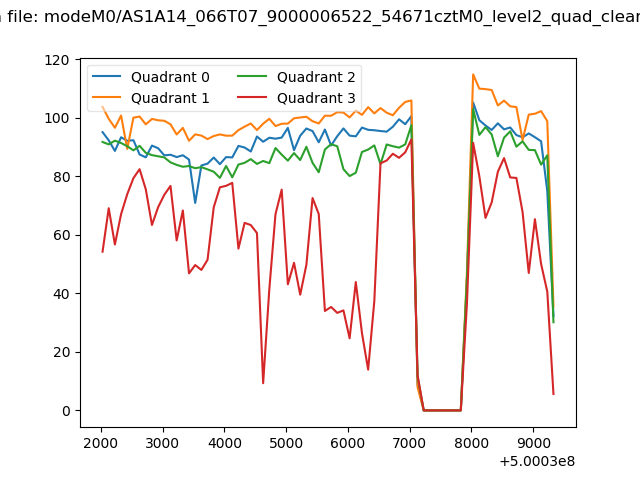
| Quadrant-wise count rates Data is divided into 100 sec bins |
 |
|
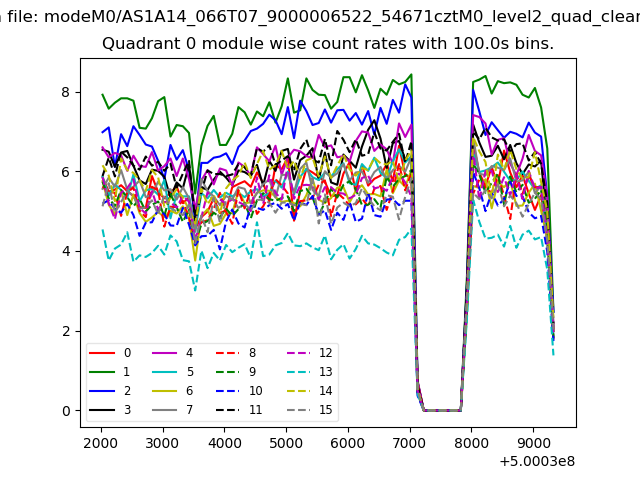
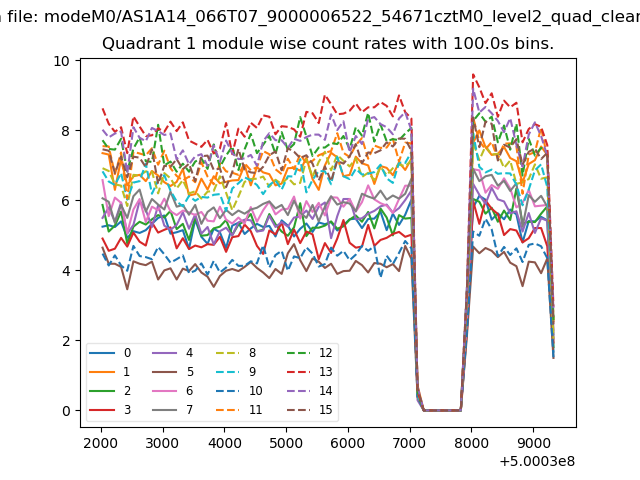
| Module-wise count rates for Quadrant A Data is divided into 100 sec bins |
 |
 |
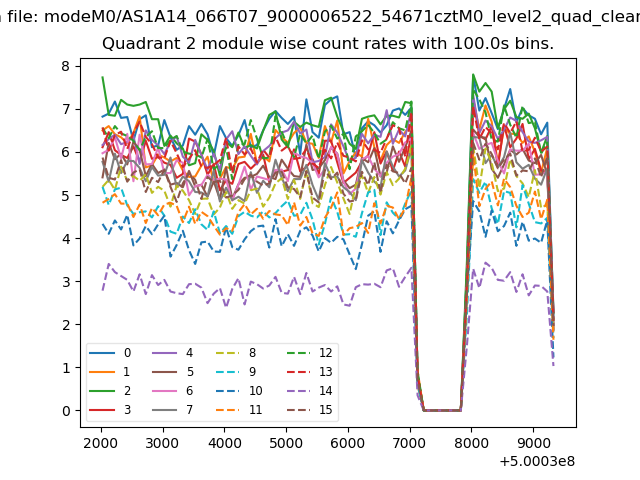
| Module-wise count rates for Quadrant B Data is divided into 100 sec bins |
 |
 |
| Module-wise count rates for Quadrant C Data is divided into 100 sec bins |
 |
 |
| Module-wise count rates for Quadrant D Data is divided into 100 sec bins |
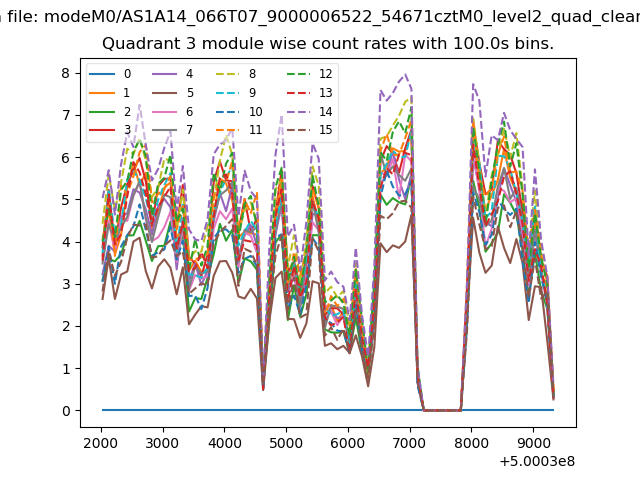 |
 |
| Parameter | Plot |
|---|---|
| CZT HV Monitor | 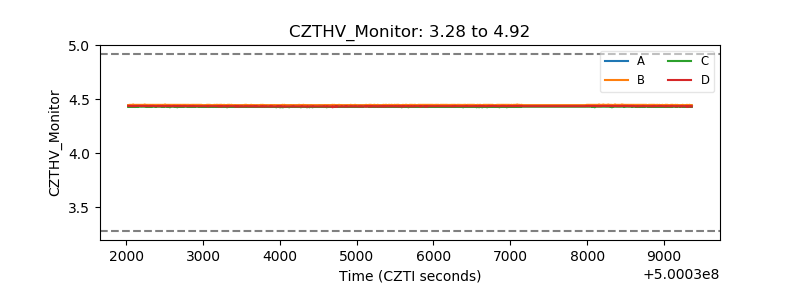 |
| D_VDD | 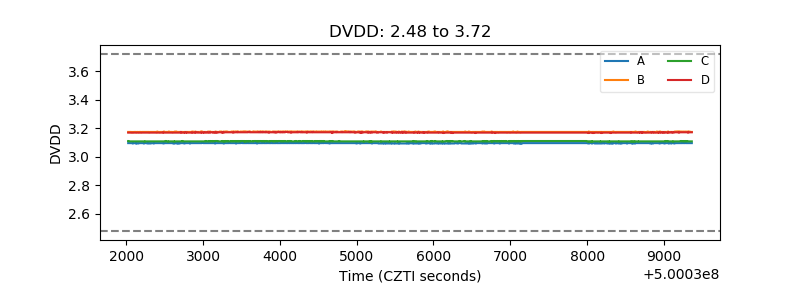 |
| Temperature 1 | 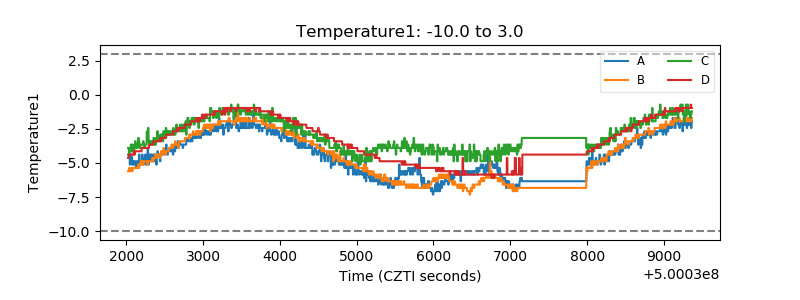 |
| Veto HV Monitor | 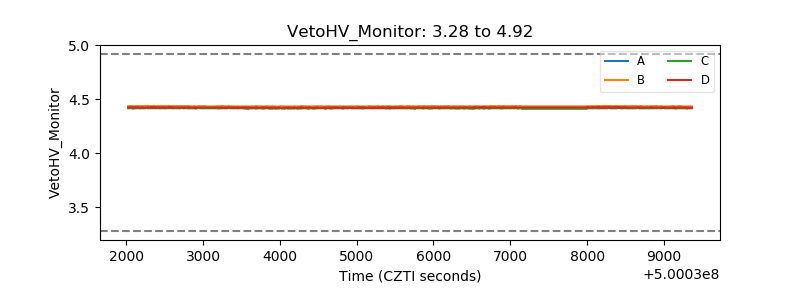 |
| Veto LLD | 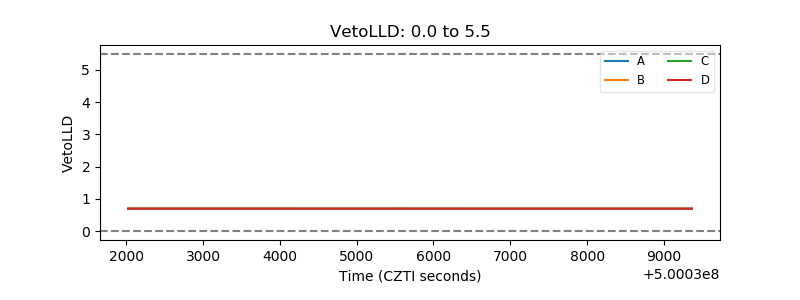 |
| Alpha Counter | 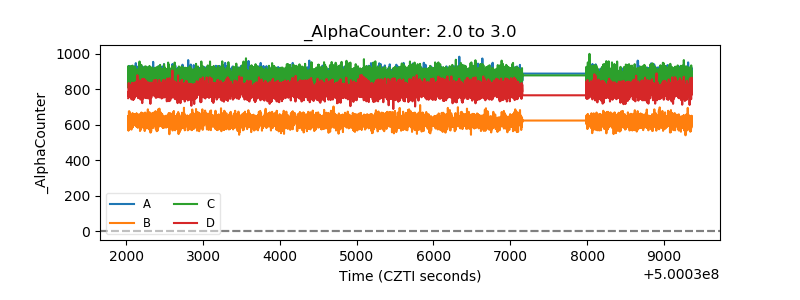 |
| _CPM_Rate | 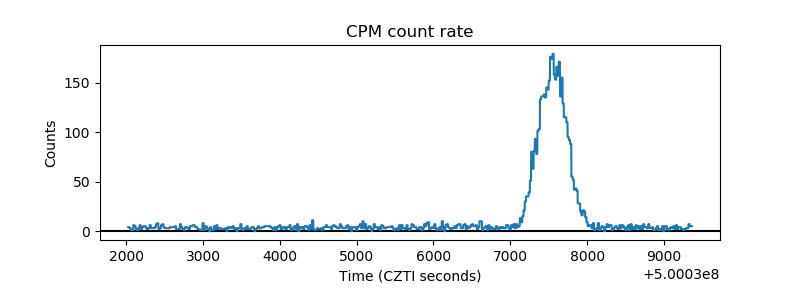 |
| CZT Counter | 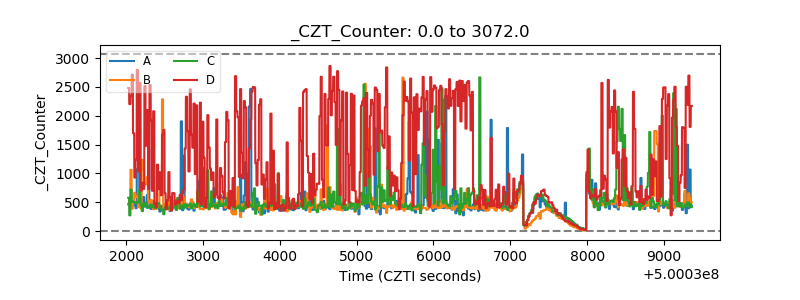 |
| +2.5 Volts monitor |  |
| +5 Volts monitor | 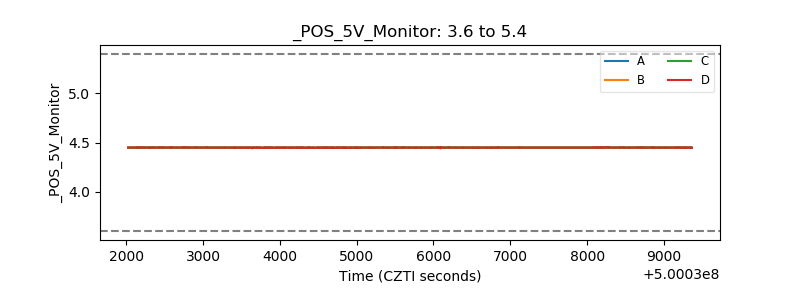 |
| _ROLL_ROT | 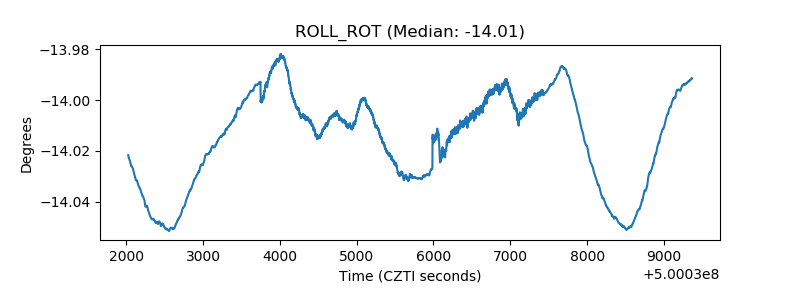 |
| _Roll_DEC | 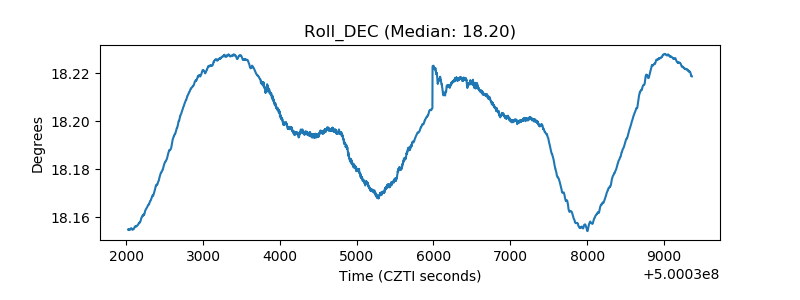 |
| _Roll_RA | 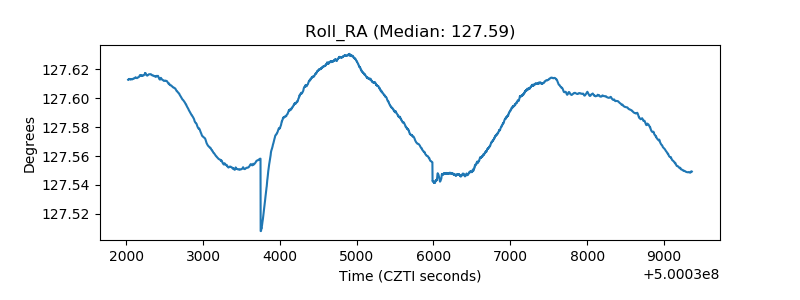 |
| Veto Counter | 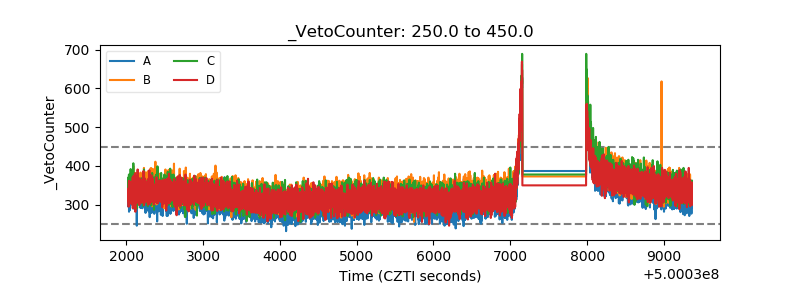 |