| Param | Original file | Final file |
|---|---|---|
| Filename | modeM0/AS1A14_066T07_9000006522_54674cztM0_level2.fits | modeM0/AS1A14_066T07_9000006522_54674cztM0_level2_quad_clean.evt |
| Size (bytes) | 619,418,880 | 91,598,400 |
| Size | 590.7 MB | 87.4 MB |
| Events in quadrant A | 3,889,381 | 632,782 |
| Events in quadrant B | 3,561,890 | 678,052 |
| Events in quadrant C | 5,018,421 | 602,657 |
| Events in quadrant D | 9,949,160 | 401,767 |
| Mode M9 | |||
|---|---|---|---|
| Quadrant | BADHDUFLAG | Total packets | Discarded packets |
| A | 0 | 11 | 0 |
| B | 0 | 11 | 0 |
| C | 0 | 11 | 0 |
| D | 0 | 11 | 0 |
| Mode M0 | |||
|---|---|---|---|
| Quadrant | BADHDUFLAG | Total packets | Discarded packets |
| A | 0 | 16118 | 1 |
| B | 0 | 15179 | 1 |
| C | 0 | 19445 | 1 |
| D | 0 | 34139 | 1 |
| Mode SS | |||
|---|---|---|---|
| Quadrant | BADHDUFLAG | Total packets | Discarded packets |
| A | 0 | 132 | 0 |
| B | 0 | 132 | 0 |
| C | 0 | 132 | 0 |
| D | 0 | 132 | 0 |
| Quadrant | Total seconds | Saturated seconds | Saturation percentage |
|---|---|---|---|
| A | 6575 | 298 | 4.532319% |
| B | 6575 | 258 | 3.923954% |
| C | 6575 | 254 | 3.863118% |
| D | 6576 | 2397 | 36.450730% |
Noise dominated data is calculated using 1-second bins in cleaned event files. If a bin has >2000 counts, and if more than 50% of those come from <1% of pixels, then it is considered to be noise-dominated and hence unusable.
| Quadrant | # 1 sec bins | Bins with >0 counts | Bins with >2000 counts | High rate bins dominated by noise | Noise dominated (total time) | Noise dominated (detector-on time) | Marked lightcurve |
|---|---|---|---|---|---|---|---|
| A | 7660 | 6575 | 167 | 167 | 2.18% | 2.54% | 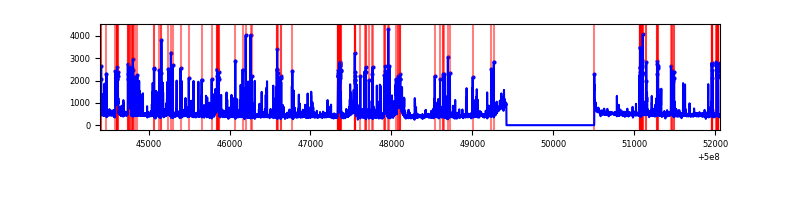 |
| B | 7660 | 6575 | 145 | 145 | 1.89% | 2.21% | 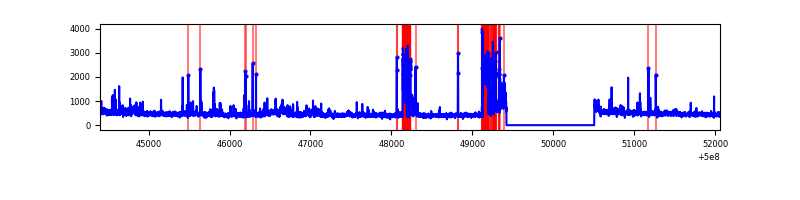 |
| C | 7660 | 6575 | 212 | 212 | 2.77% | 3.22% | 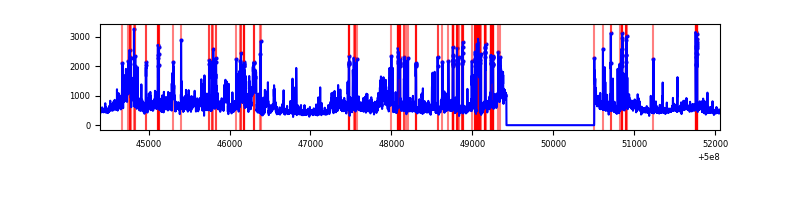 |
| D | 7661 | 6576 | 2058 | 2058 | 26.86% | 31.30% | 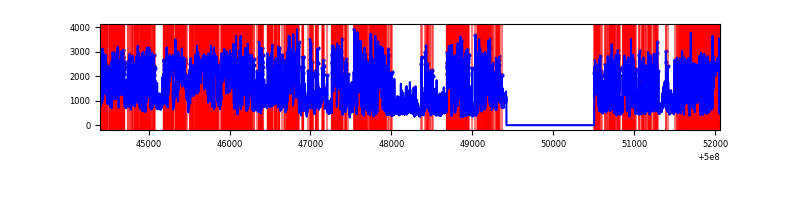 |
Top three noisy pixels from each quadrant. If the there are fewer than three noisy pixels in the level2.evt file, extra rows are filled as -1
| Pixel properties | Quadrant properties | ||||||
|---|---|---|---|---|---|---|---|
| Quadrant | DetID | PixID | Counts | Sigma | Mean | Median | Sigma |
| A | 11 | 3 | 487806 | 2724.46 | 729 | 710 | 178.8 |
| A | 7 | 14 | 318569 | 1777.87 | 729 | 710 | 178.8 |
| A | 0 | 8 | 59854 | 330.81 | 729 | 710 | 178.8 |
| B | 2 | 249 | 453783 | 2976.5 | 714 | 686 | 152.2 |
| B | 10 | 247 | 87065 | 567.44 | 714 | 686 | 152.2 |
| B | 5 | 172 | 65826 | 427.92 | 714 | 686 | 152.2 |
| C | 9 | 38 | 1869597 | 9515.13 | 712 | 706 | 196.4 |
| C | 4 | 5 | 135530 | 686.43 | 712 | 706 | 196.4 |
| C | 14 | 254 | 80415 | 405.82 | 712 | 706 | 196.4 |
| D | 11 | 129 | 6052007 | 35606.26 | 605 | 578 | 170.0 |
| D | 2 | 62 | 1244353 | 7318.3 | 605 | 578 | 170.0 |
| D | 8 | 240 | 47695 | 277.23 | 605 | 578 | 170.0 |
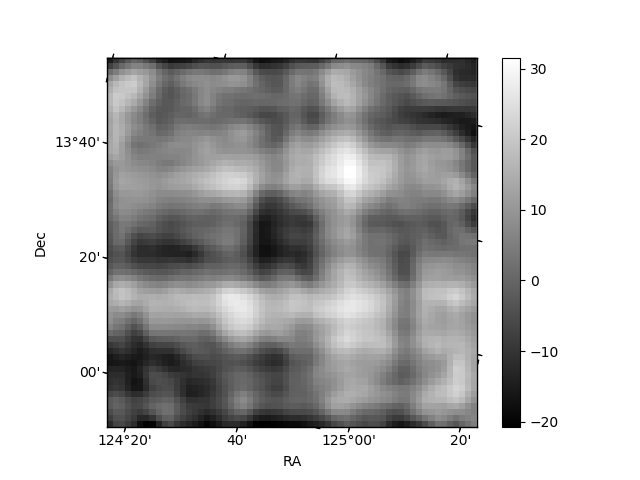
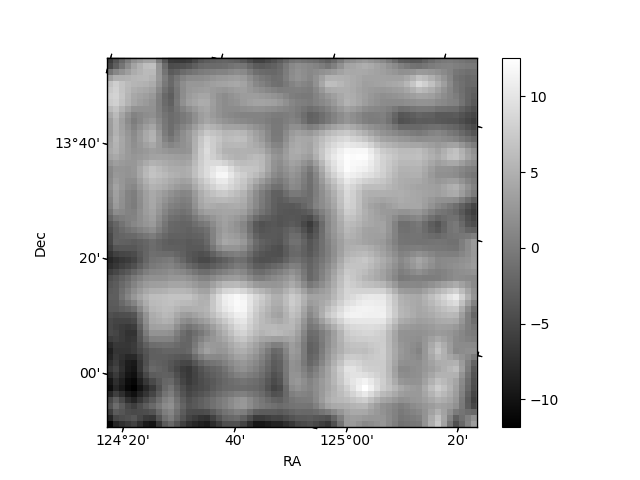
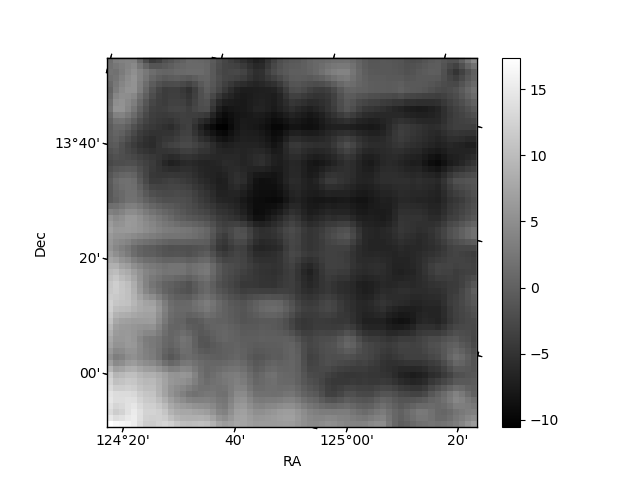
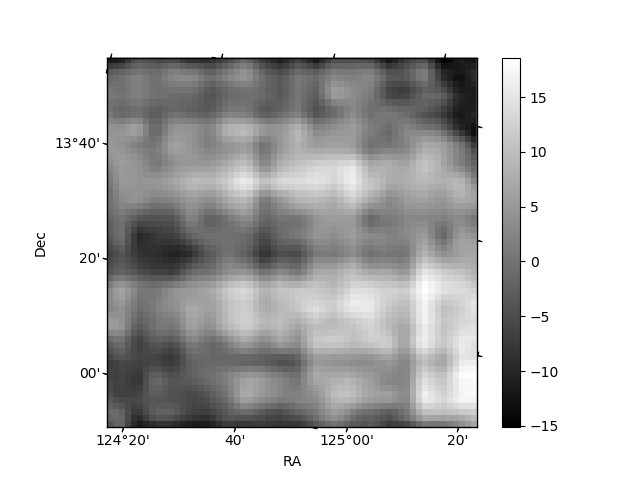
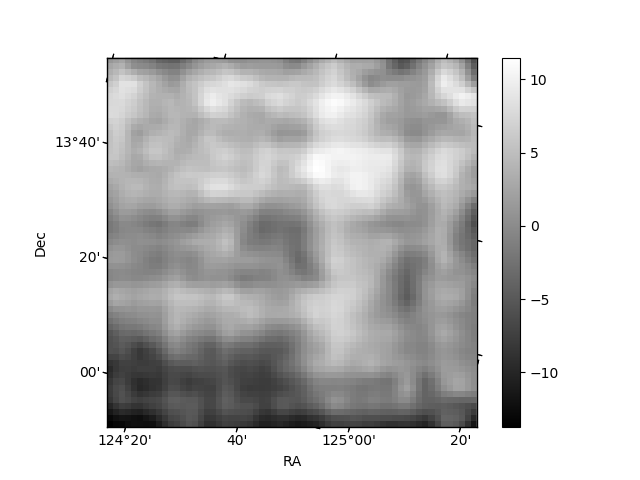
Histogram calculated using DETX and DETY for each event in the final _common_clean file
| Quadrant A | 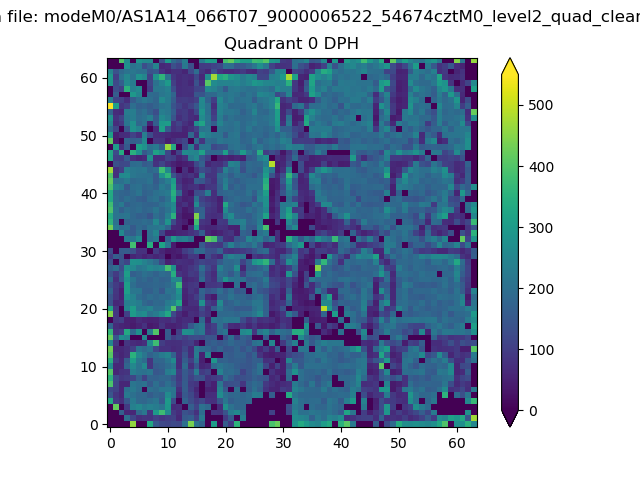 |
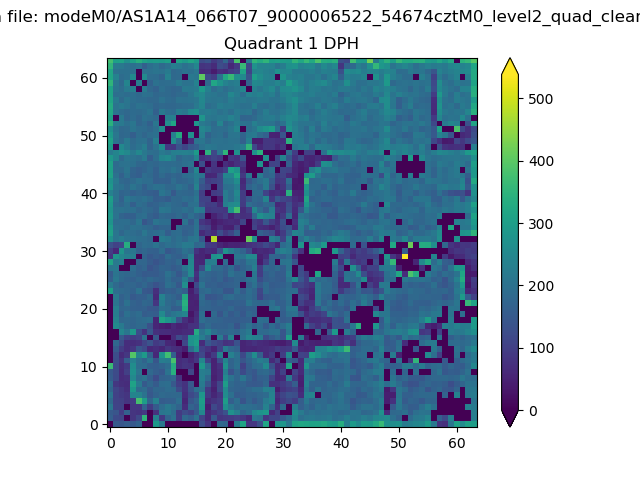 |
Quadrant B |
|---|---|---|---|
| Quadrant D | 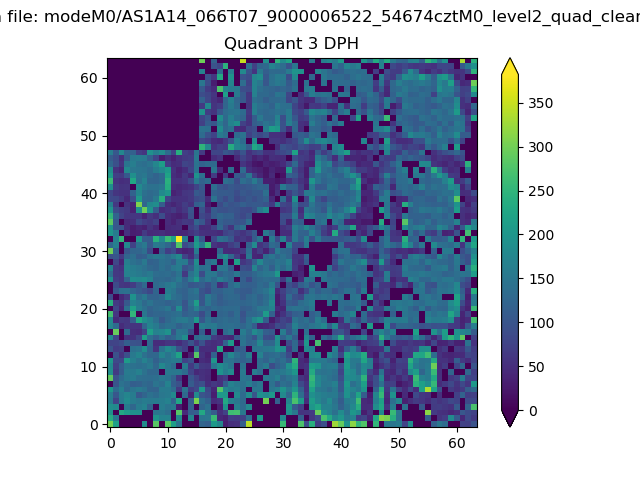 |
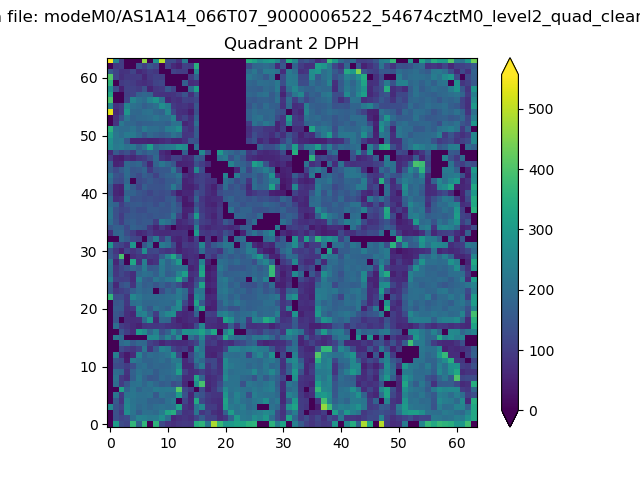 |
Quadrant C |
| Plot type | Count rate plots | Images |
|---|---|---|
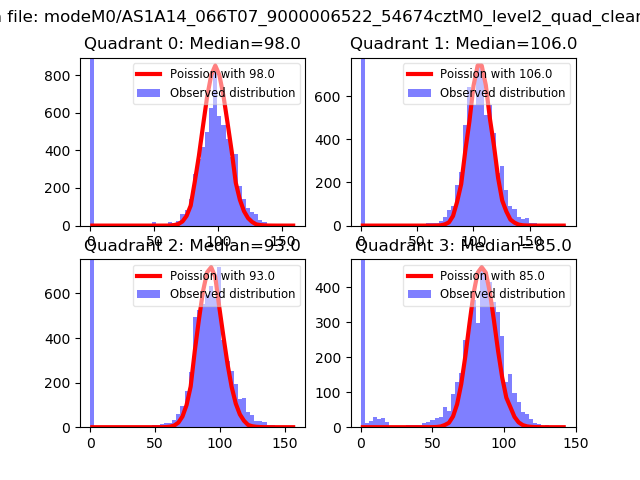
| Comparison with Poisson distribution Blue bars denote a histogram of data divided into 1 sec bins. Red curve is a Poisson curve with rate = median count rate of data. |
 |
 |
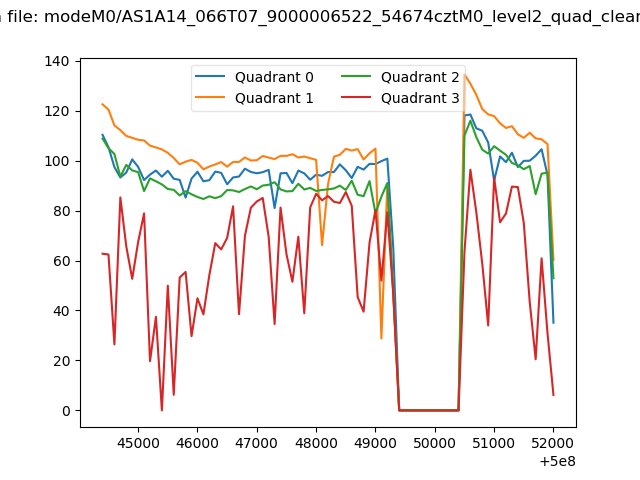
| Quadrant-wise count rates Data is divided into 100 sec bins |
 |
|
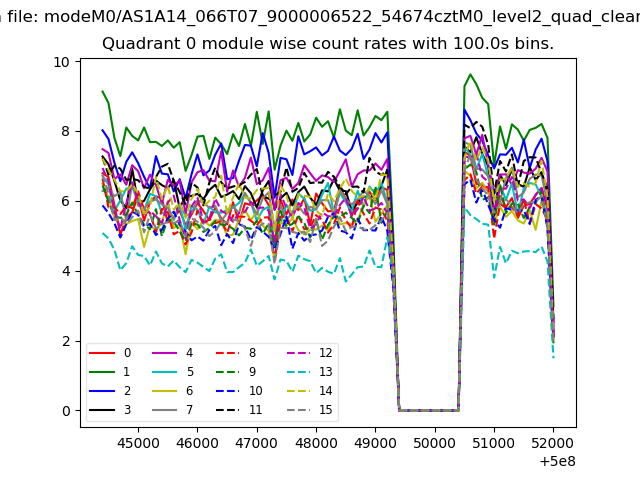
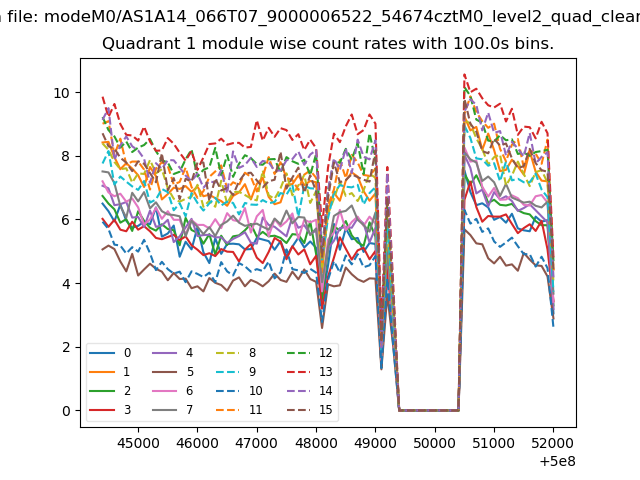
| Module-wise count rates for Quadrant A Data is divided into 100 sec bins |
 |
 |
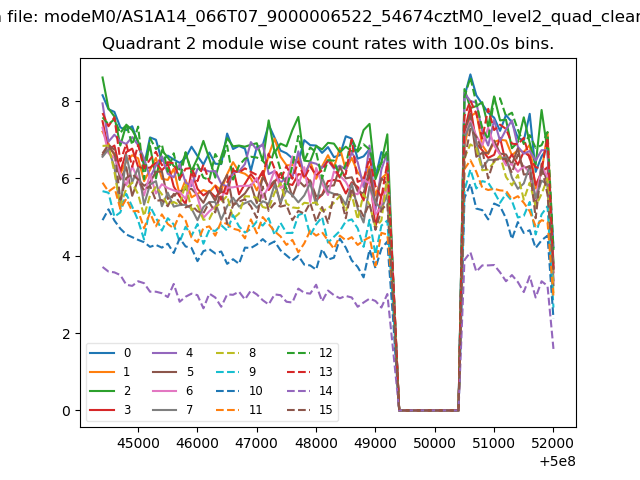
| Module-wise count rates for Quadrant B Data is divided into 100 sec bins |
 |
 |
| Module-wise count rates for Quadrant C Data is divided into 100 sec bins |
 |
 |
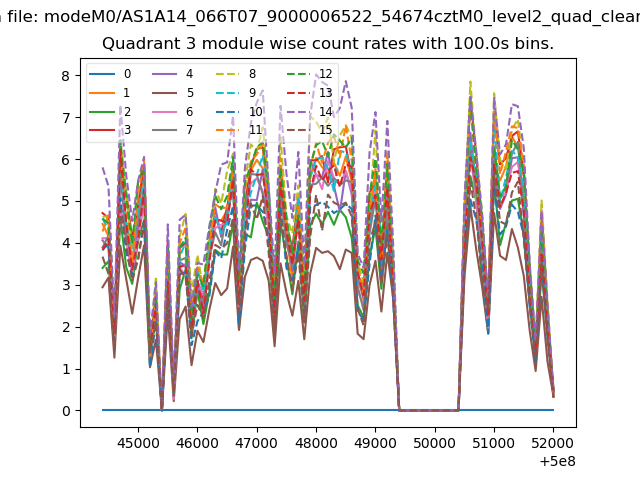
| Module-wise count rates for Quadrant D Data is divided into 100 sec bins |
 |
 |
| Parameter | Plot |
|---|---|
| CZT HV Monitor | 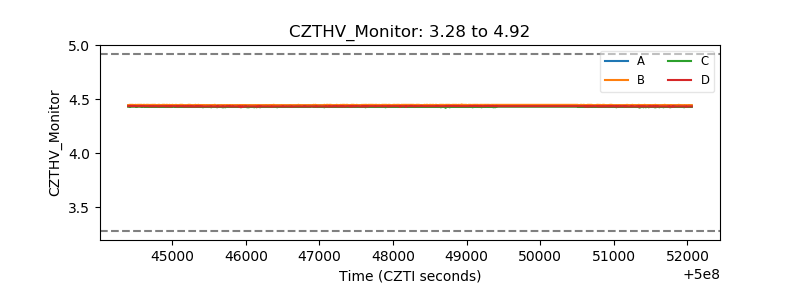 |
| D_VDD | 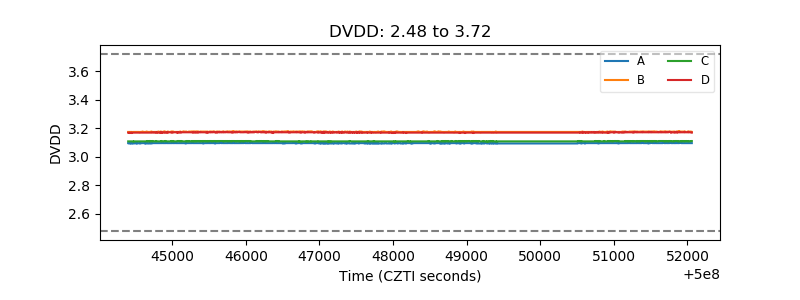 |
| Temperature 1 | 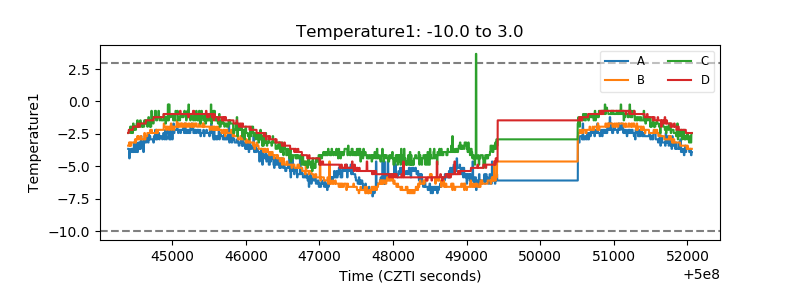 |
| Veto HV Monitor |  |
| Veto LLD | 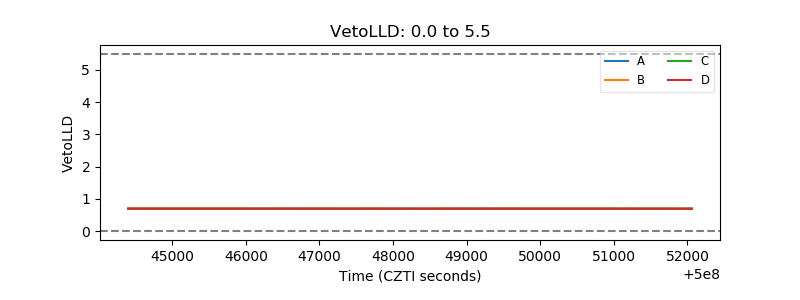 |
| Alpha Counter | 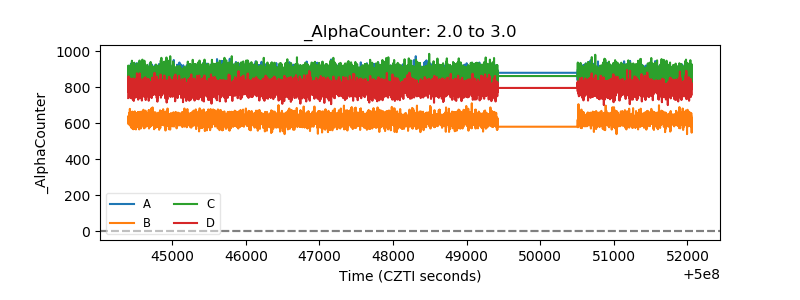 |
| _CPM_Rate | 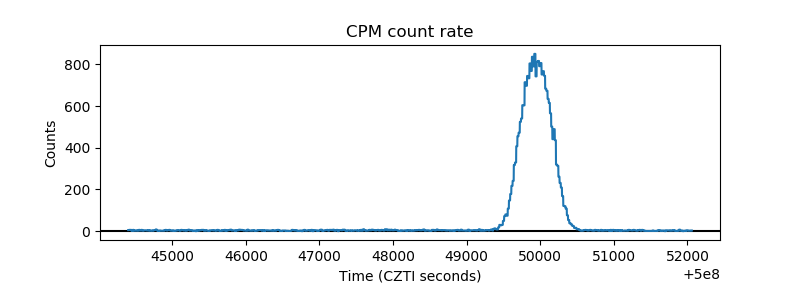 |
| CZT Counter | 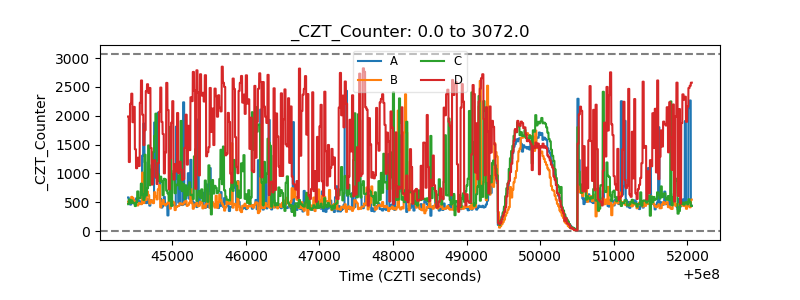 |
| +2.5 Volts monitor | 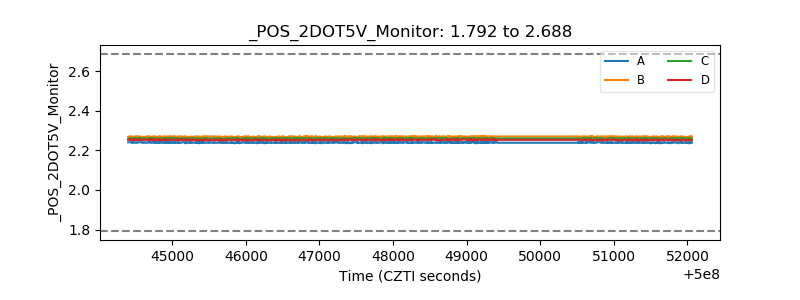 |
| +5 Volts monitor | 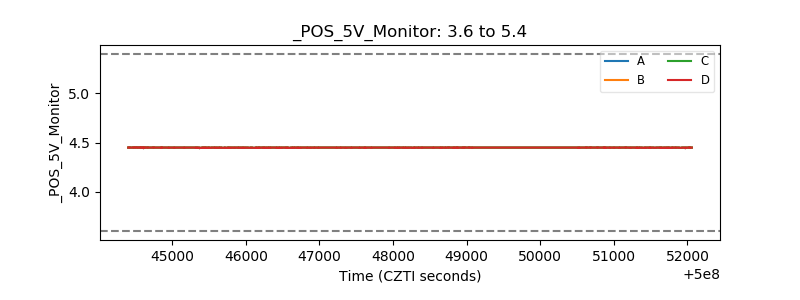 |
| _ROLL_ROT | 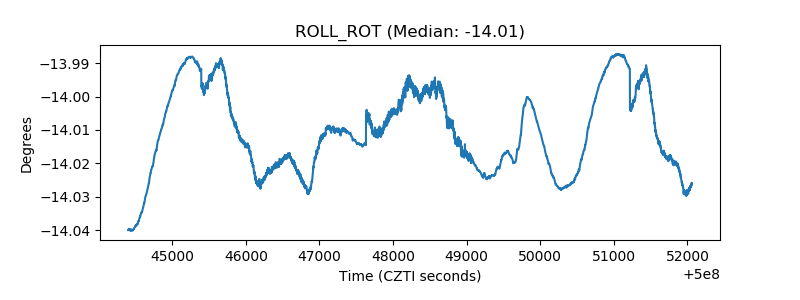 |
| _Roll_DEC | 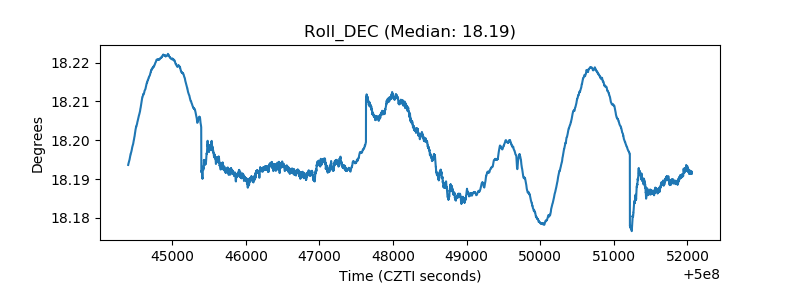 |
| _Roll_RA | 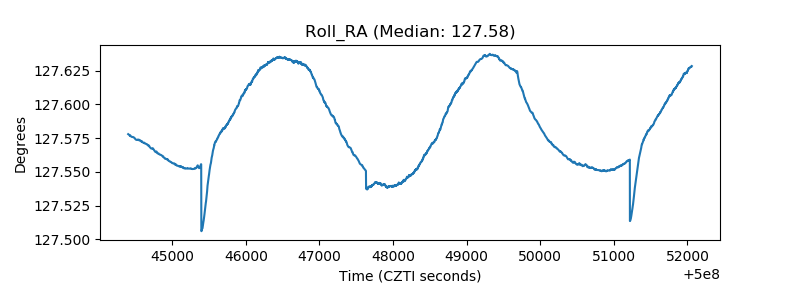 |
| Veto Counter | 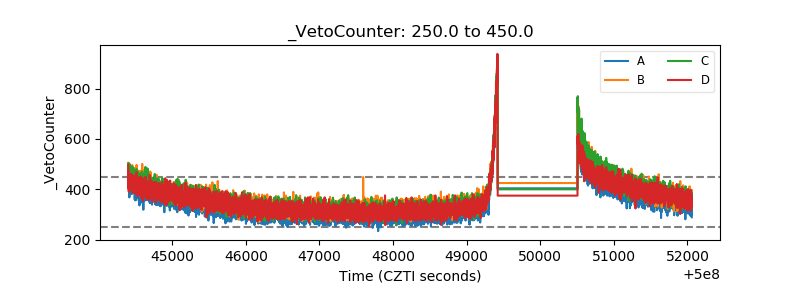 |