| Param | Original file | Final file |
|---|---|---|
| Filename | modeM0/AS1A14_066T07_9000006522_54676cztM0_level2.fits | modeM0/AS1A14_066T07_9000006522_54676cztM0_level2_quad_clean.evt |
| Size (bytes) | 510,168,960 | 93,571,200 |
| Size | 486.5 MB | 89.2 MB |
| Events in quadrant A | 3,416,384 | 640,744 |
| Events in quadrant B | 3,367,580 | 692,250 |
| Events in quadrant C | 4,141,711 | 601,303 |
| Events in quadrant D | 7,470,886 | 460,556 |
| Mode M9 | |||
|---|---|---|---|
| Quadrant | BADHDUFLAG | Total packets | Discarded packets |
| A | 0 | 21 | 0 |
| B | 0 | 21 | 0 |
| C | 0 | 22 | 0 |
| D | 0 | 22 | 0 |
| Mode M0 | |||
|---|---|---|---|
| Quadrant | BADHDUFLAG | Total packets | Discarded packets |
| A | 0 | 14496 | 3 |
| B | 0 | 14325 | 2 |
| C | 0 | 16425 | 2 |
| D | 0 | 26527 | 2 |
| Mode SS | |||
|---|---|---|---|
| Quadrant | BADHDUFLAG | Total packets | Discarded packets |
| A | 0 | 128 | 0 |
| B | 0 | 128 | 0 |
| C | 0 | 128 | 0 |
| D | 0 | 128 | 0 |
| Quadrant | Total seconds | Saturated seconds | Saturation percentage |
|---|---|---|---|
| A | 6282 | 178 | 2.833493% |
| B | 6282 | 118 | 1.878383% |
| C | 6282 | 275 | 4.377587% |
| D | 6282 | 1557 | 24.785100% |
Noise dominated data is calculated using 1-second bins in cleaned event files. If a bin has >2000 counts, and if more than 50% of those come from <1% of pixels, then it is considered to be noise-dominated and hence unusable.
| Quadrant | # 1 sec bins | Bins with >0 counts | Bins with >2000 counts | High rate bins dominated by noise | Noise dominated (total time) | Noise dominated (detector-on time) | Marked lightcurve |
|---|---|---|---|---|---|---|---|
| A | 7462 | 6282 | 94 | 94 | 1.26% | 1.50% | 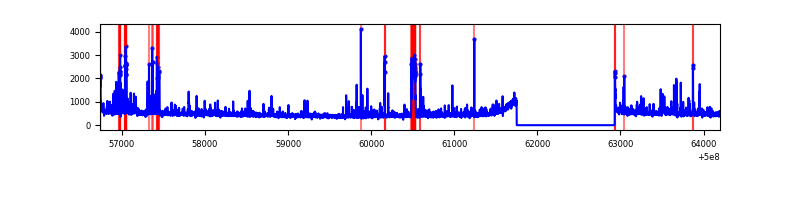 |
| B | 7462 | 6282 | 29 | 29 | 0.39% | 0.46% | 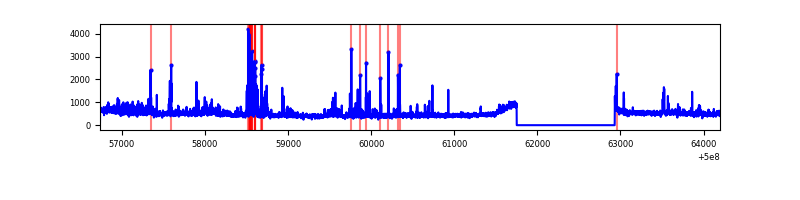 |
| C | 7462 | 6282 | 205 | 205 | 2.75% | 3.26% | 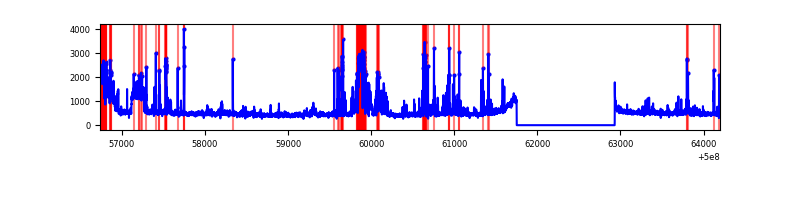 |
| D | 7462 | 6282 | 1425 | 1425 | 19.10% | 22.68% | 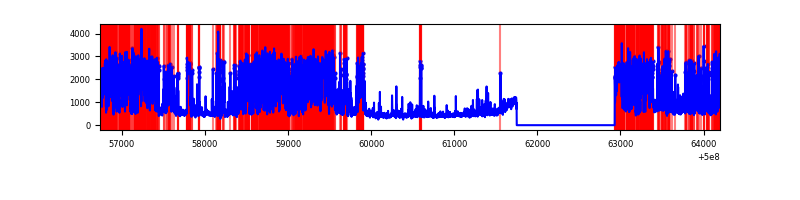 |
Top three noisy pixels from each quadrant. If the there are fewer than three noisy pixels in the level2.evt file, extra rows are filled as -1
| Pixel properties | Quadrant properties | ||||||
|---|---|---|---|---|---|---|---|
| Quadrant | DetID | PixID | Counts | Sigma | Mean | Median | Sigma |
| A | 11 | 3 | 239275 | 1326.9 | 725 | 705 | 179.8 |
| A | 12 | 15 | 125206 | 692.46 | 725 | 705 | 179.8 |
| A | 5 | 240 | 86026 | 474.54 | 725 | 705 | 179.8 |
| B | 0 | 213 | 205153 | 1334.31 | 718 | 695 | 153.2 |
| B | 10 | 247 | 137368 | 891.94 | 718 | 695 | 153.2 |
| B | 2 | 249 | 118214 | 766.94 | 718 | 695 | 153.2 |
| C | 4 | 5 | 576184 | 2985.69 | 702 | 699 | 192.7 |
| C | 12 | 250 | 250496 | 1295.98 | 702 | 699 | 192.7 |
| C | 13 | 3 | 160455 | 828.83 | 702 | 699 | 192.7 |
| D | 11 | 129 | 3852879 | 21540.42 | 629 | 603 | 178.8 |
| D | 2 | 62 | 370238 | 2066.85 | 629 | 603 | 178.8 |
| D | 2 | 172 | 339831 | 1896.83 | 629 | 603 | 178.8 |
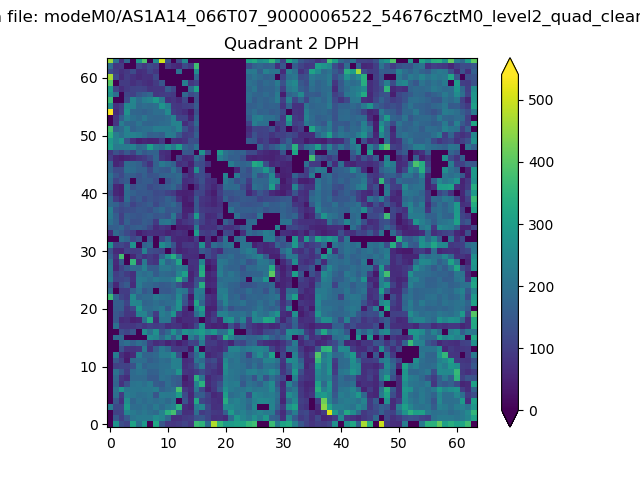
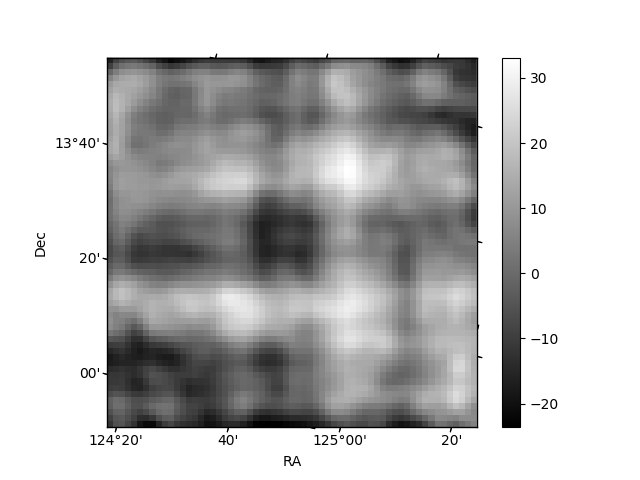
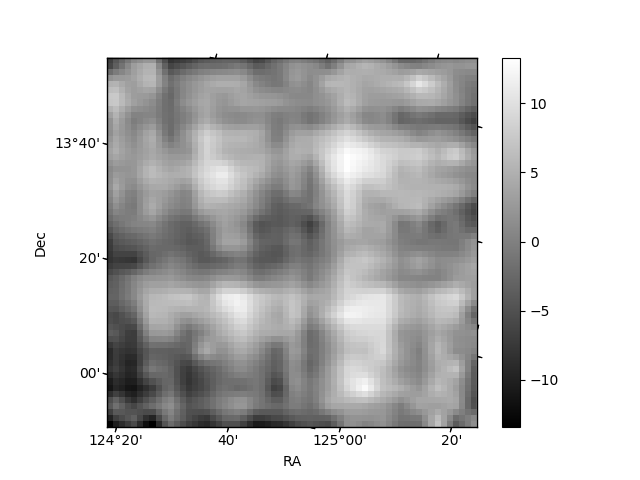
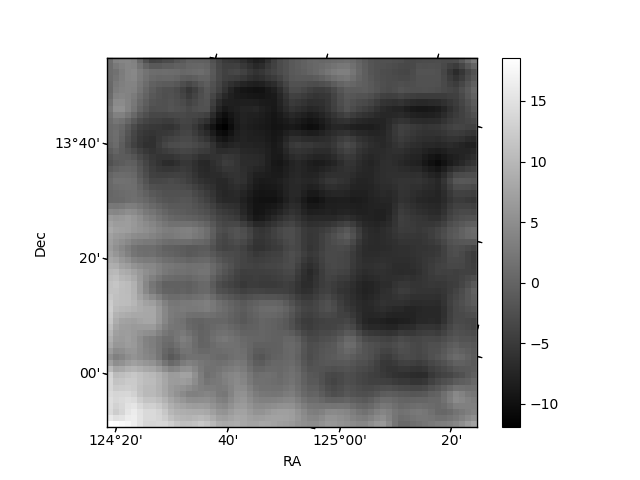
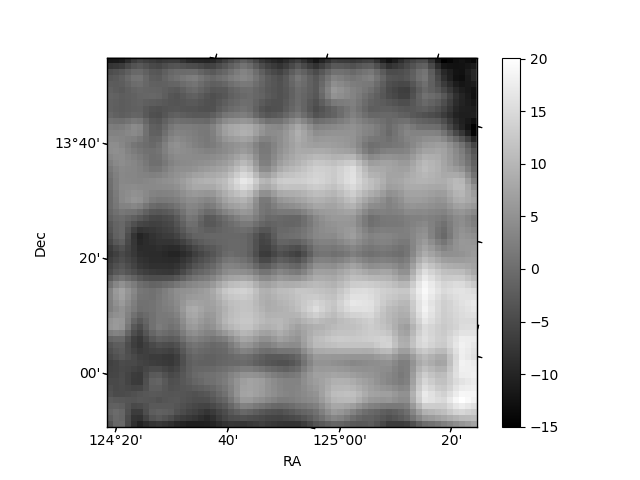
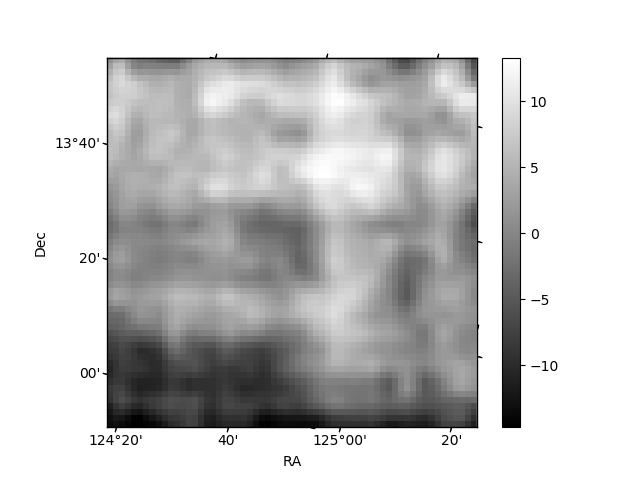
Histogram calculated using DETX and DETY for each event in the final _common_clean file
| Quadrant A | 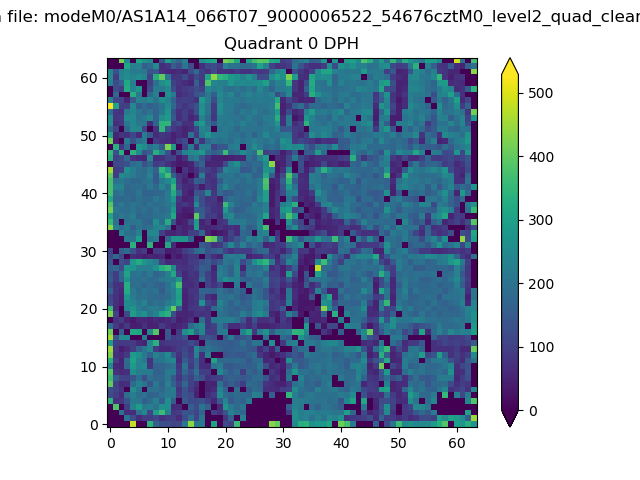 |
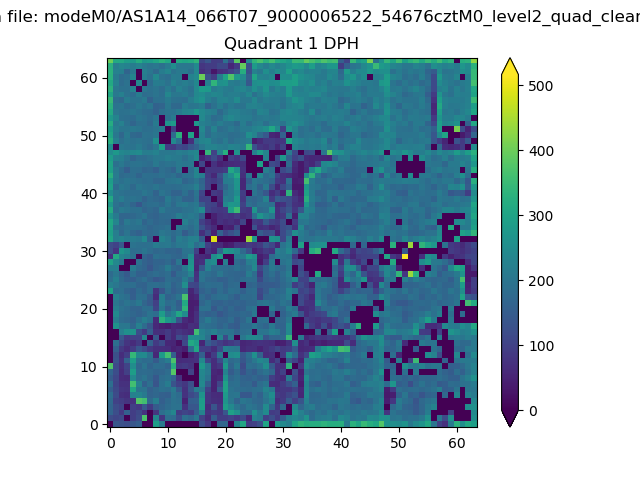 |
Quadrant B |
|---|---|---|---|
| Quadrant D | 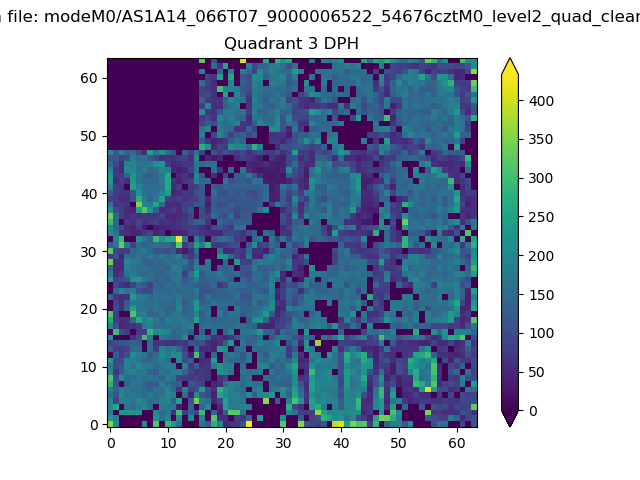 |
 |
Quadrant C |
| Plot type | Count rate plots | Images |
|---|---|---|
| Comparison with Poisson distribution Blue bars denote a histogram of data divided into 1 sec bins. Red curve is a Poisson curve with rate = median count rate of data. |
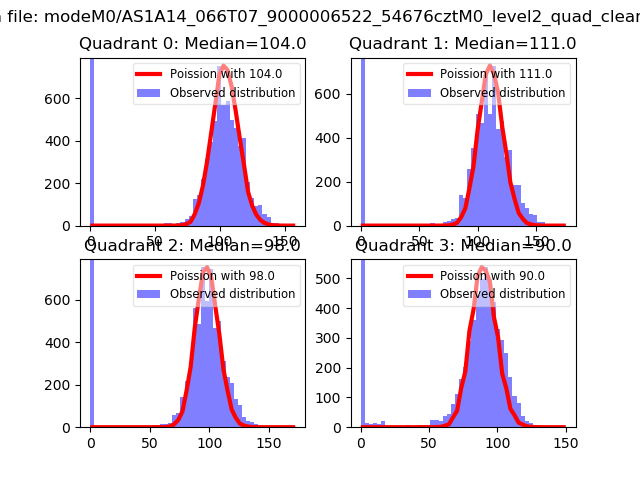 |
 |
| Quadrant-wise count rates Data is divided into 100 sec bins |
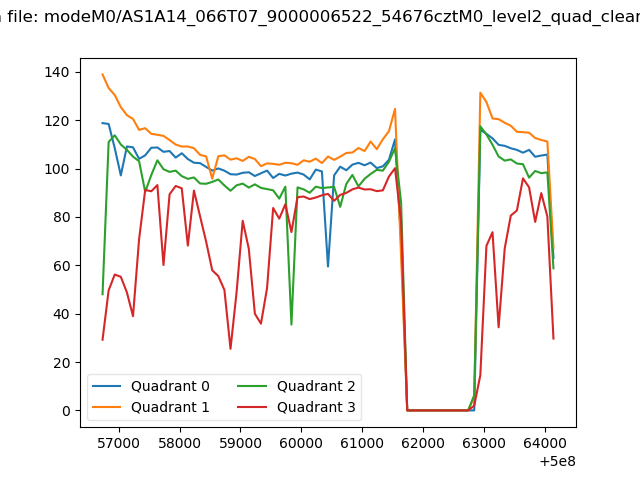 |
|
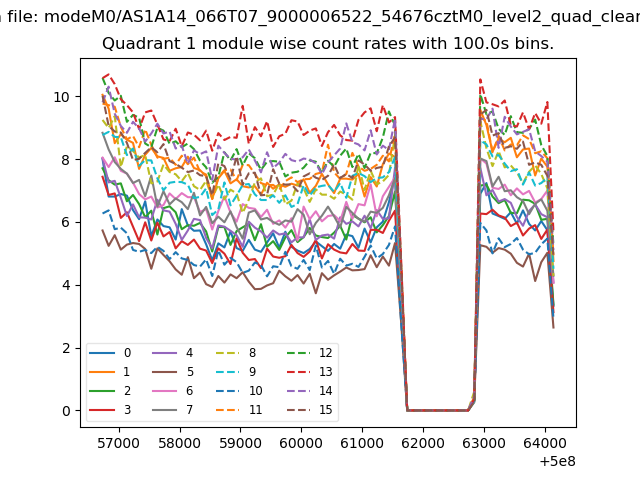
| Module-wise count rates for Quadrant A Data is divided into 100 sec bins |
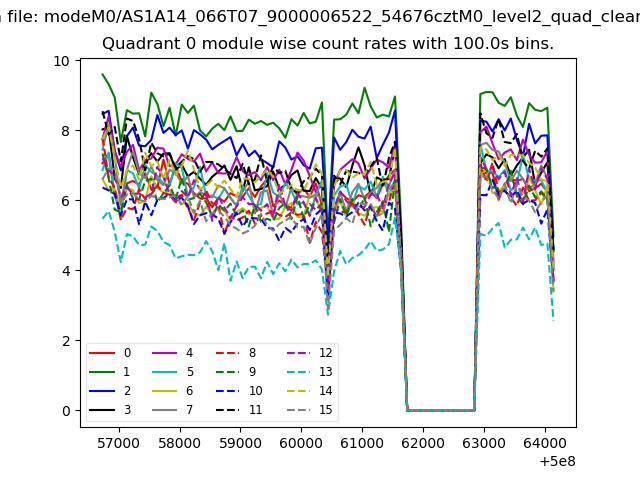 |
 |
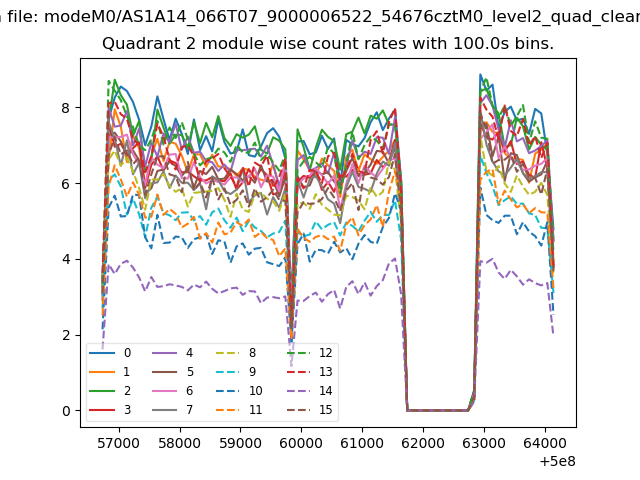
| Module-wise count rates for Quadrant B Data is divided into 100 sec bins |
 |
 |
| Module-wise count rates for Quadrant C Data is divided into 100 sec bins |
 |
 |
| Module-wise count rates for Quadrant D Data is divided into 100 sec bins |
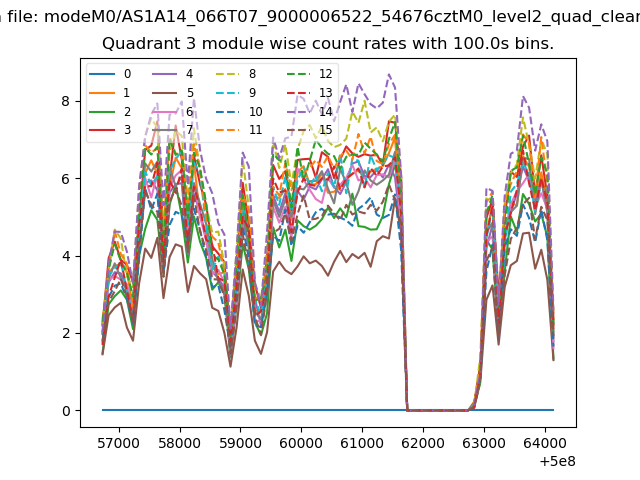 |
 |
| Parameter | Plot |
|---|---|
| CZT HV Monitor | 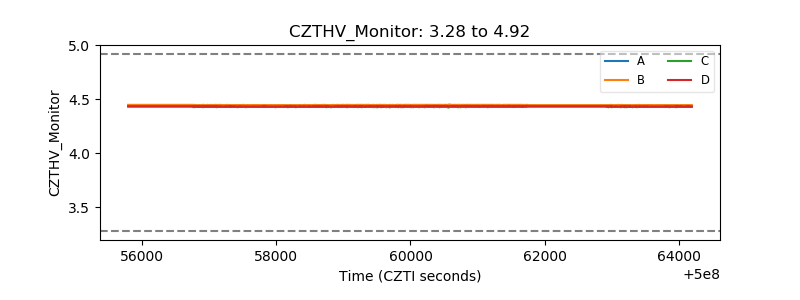 |
| D_VDD | 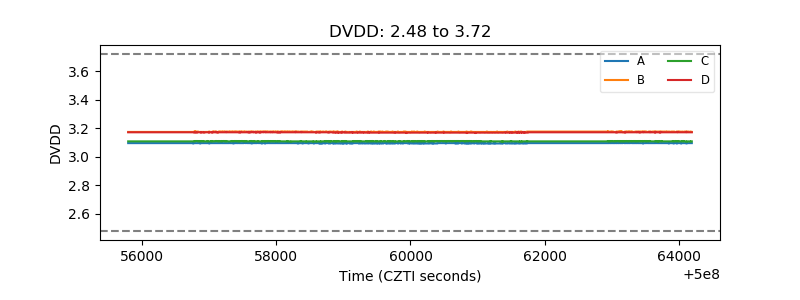 |
| Temperature 1 | 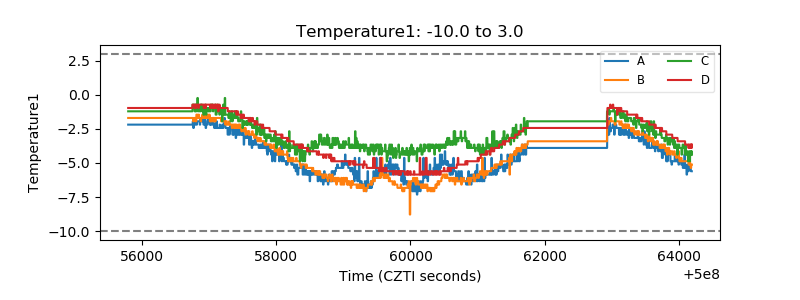 |
| Veto HV Monitor | 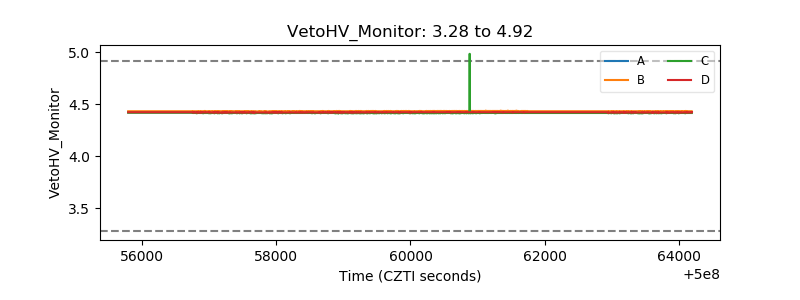 |
| Veto LLD | 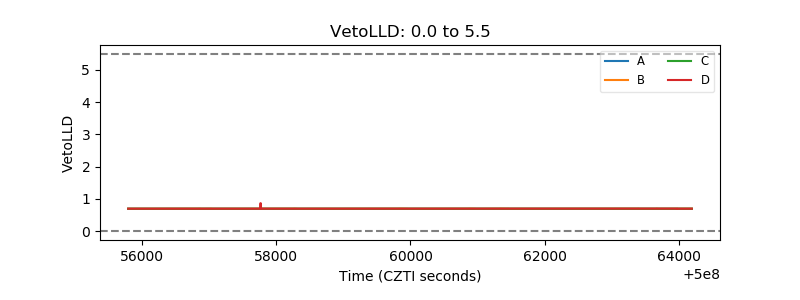 |
| Alpha Counter | 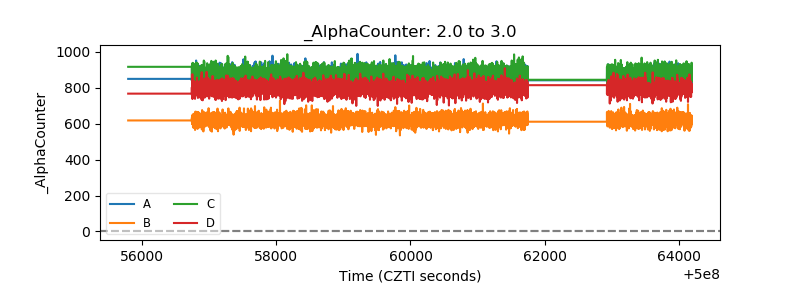 |
| _CPM_Rate | 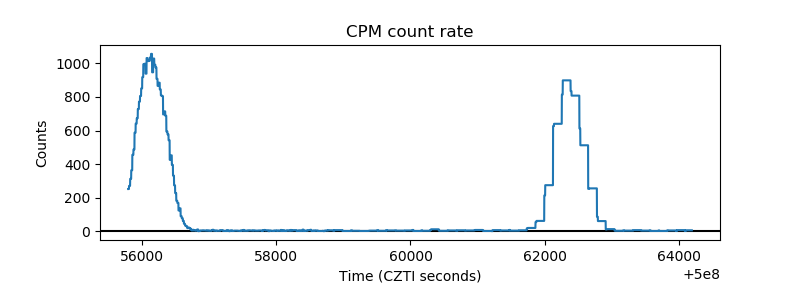 |
| CZT Counter | 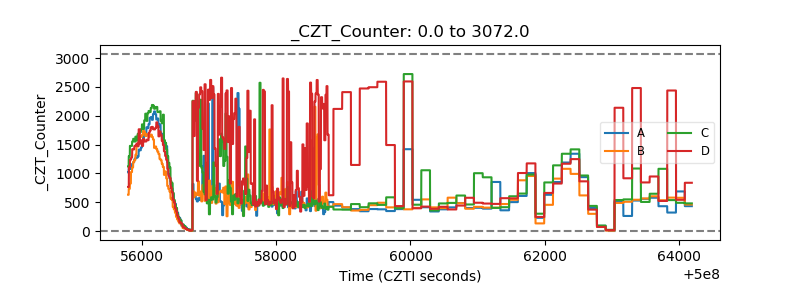 |
| +2.5 Volts monitor | 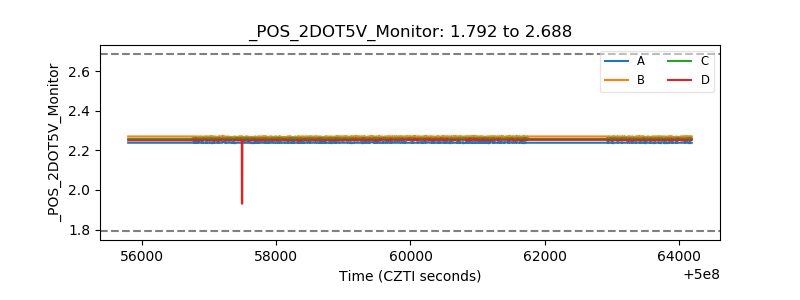 |
| +5 Volts monitor | 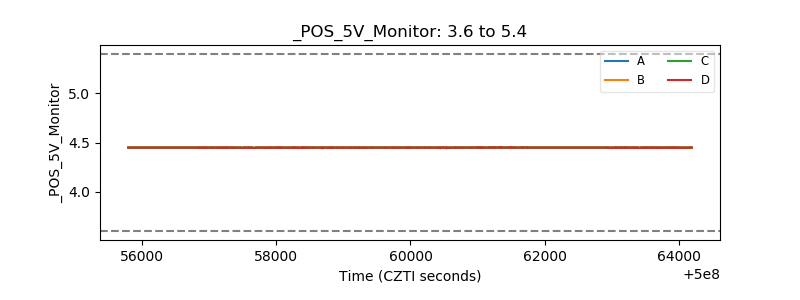 |
| _ROLL_ROT | 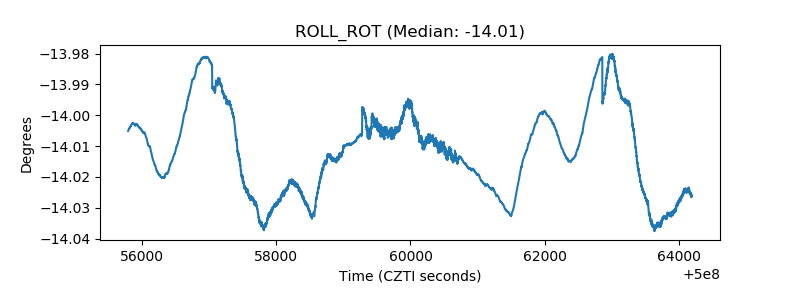 |
| _Roll_DEC | 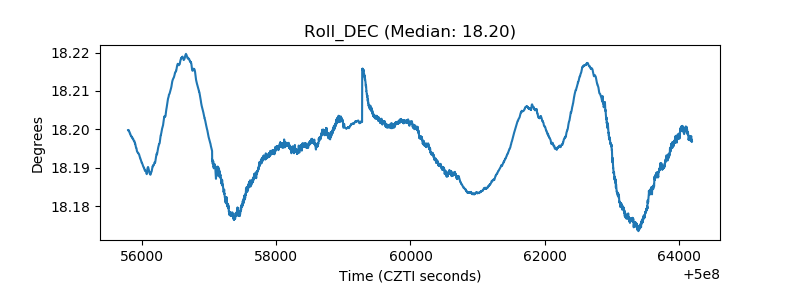 |
| _Roll_RA | 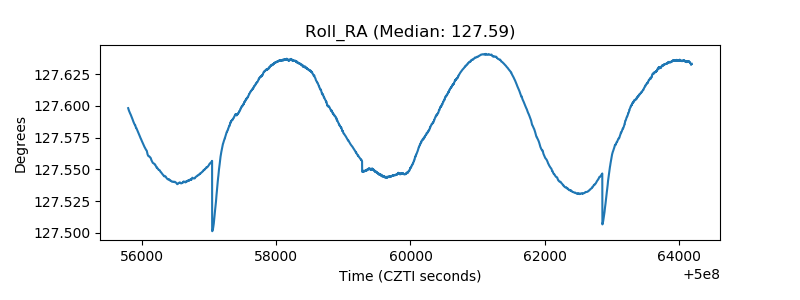 |
| Veto Counter | 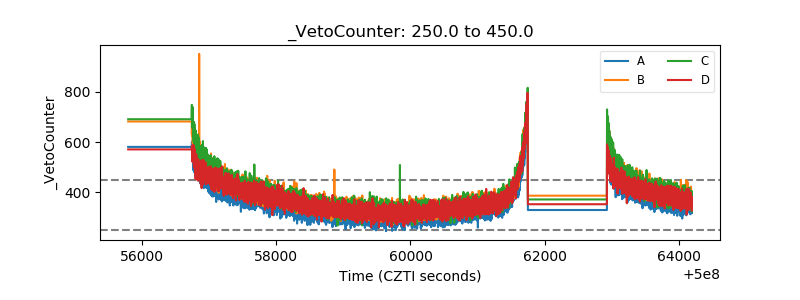 |