| Param | Original file | Final file |
|---|---|---|
| Filename | modeM0/AS1A14_066T07_9000006522_54677cztM0_level2.fits | modeM0/AS1A14_066T07_9000006522_54677cztM0_level2_quad_clean.evt |
| Size (bytes) | 438,333,120 | 88,528,320 |
| Size | 418.0 MB | 84.4 MB |
| Events in quadrant A | 2,929,318 | 598,375 |
| Events in quadrant B | 3,080,344 | 636,455 |
| Events in quadrant C | 3,453,660 | 563,153 |
| Events in quadrant D | 6,297,878 | 465,484 |
| Mode M9 | |||
|---|---|---|---|
| Quadrant | BADHDUFLAG | Total packets | Discarded packets |
| A | 0 | 11 | 0 |
| B | 0 | 11 | 0 |
| C | 0 | 11 | 0 |
| D | 0 | 11 | 0 |
| Mode M0 | |||
|---|---|---|---|
| Quadrant | BADHDUFLAG | Total packets | Discarded packets |
| A | 0 | 13003 | 1 |
| B | 0 | 13272 | 1 |
| C | 0 | 14235 | 1 |
| D | 0 | 22912 | 1 |
| Mode SS | |||
|---|---|---|---|
| Quadrant | BADHDUFLAG | Total packets | Discarded packets |
| A | 0 | 122 | 0 |
| B | 0 | 122 | 0 |
| C | 0 | 122 | 0 |
| D | 0 | 122 | 0 |
| Quadrant | Total seconds | Saturated seconds | Saturation percentage |
|---|---|---|---|
| A | 5970 | 92 | 1.541039% |
| B | 5970 | 98 | 1.641541% |
| C | 5970 | 147 | 2.462312% |
| D | 5970 | 1048 | 17.554439% |
Noise dominated data is calculated using 1-second bins in cleaned event files. If a bin has >2000 counts, and if more than 50% of those come from <1% of pixels, then it is considered to be noise-dominated and hence unusable.
| Quadrant | # 1 sec bins | Bins with >0 counts | Bins with >2000 counts | High rate bins dominated by noise | Noise dominated (total time) | Noise dominated (detector-on time) | Marked lightcurve |
|---|---|---|---|---|---|---|---|
| A | 7105 | 5970 | 16 | 16 | 0.23% | 0.27% | 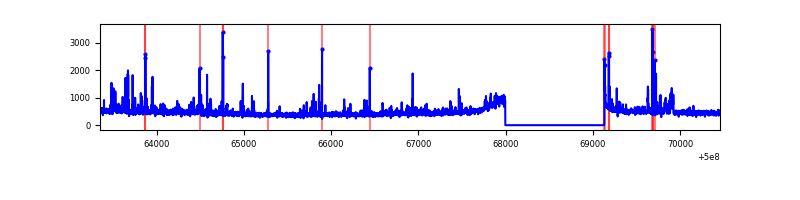 |
| B | 7105 | 5970 | 4 | 4 | 0.06% | 0.07% | 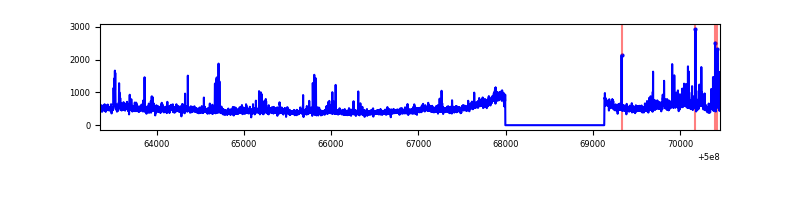 |
| C | 7105 | 5970 | 81 | 81 | 1.14% | 1.36% | 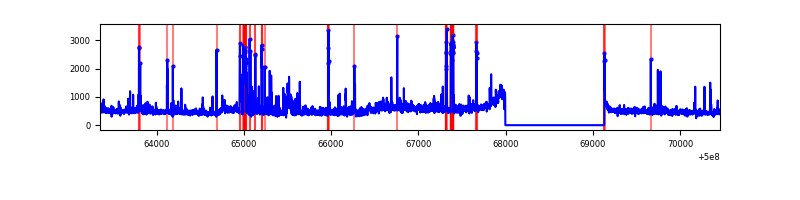 |
| D | 7105 | 5970 | 931 | 931 | 13.10% | 15.59% | 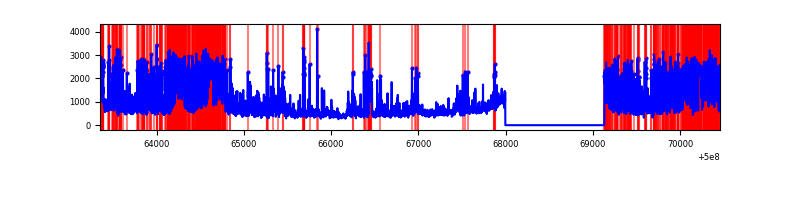 |
Top three noisy pixels from each quadrant. If the there are fewer than three noisy pixels in the level2.evt file, extra rows are filled as -1
| Pixel properties | Quadrant properties | ||||||
|---|---|---|---|---|---|---|---|
| Quadrant | DetID | PixID | Counts | Sigma | Mean | Median | Sigma |
| A | 11 | 3 | 113081 | 679.64 | 671 | 654 | 165.4 |
| A | 0 | 8 | 63840 | 381.97 | 671 | 654 | 165.4 |
| A | 13 | 248 | 57402 | 343.05 | 671 | 654 | 165.4 |
| B | 7 | 0 | 172183 | 1205.29 | 665 | 642 | 142.3 |
| B | 0 | 213 | 84604 | 589.94 | 665 | 642 | 142.3 |
| B | 2 | 249 | 66939 | 465.82 | 665 | 642 | 142.3 |
| C | 9 | 38 | 442373 | 2443.7 | 653 | 646 | 180.8 |
| C | 15 | 157 | 209293 | 1154.27 | 653 | 646 | 180.8 |
| C | 4 | 5 | 74589 | 409.06 | 653 | 646 | 180.8 |
| D | 11 | 129 | 3085384 | 17693.4 | 608 | 581 | 174.3 |
| D | 2 | 62 | 249608 | 1428.34 | 608 | 581 | 174.3 |
| D | 2 | 172 | 182843 | 1045.39 | 608 | 581 | 174.3 |
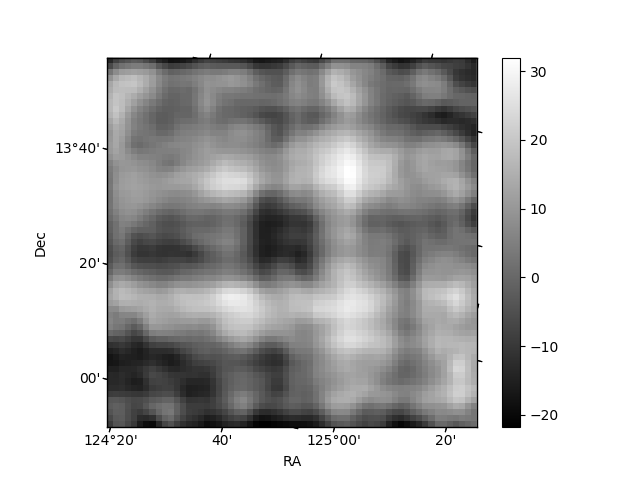
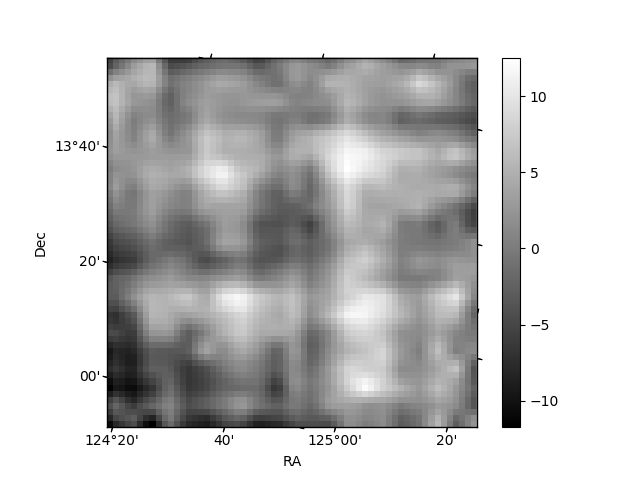
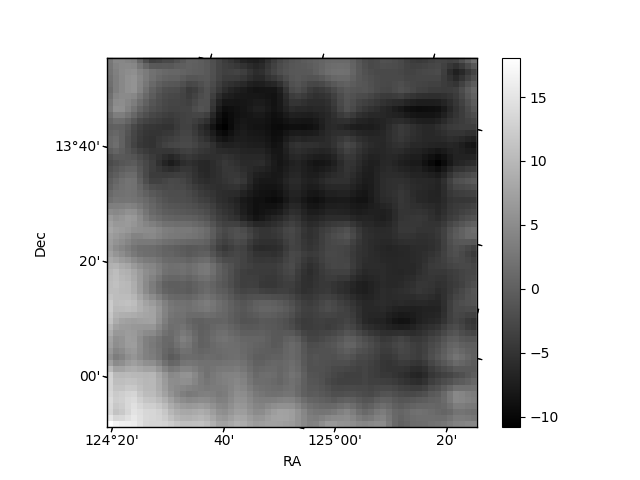
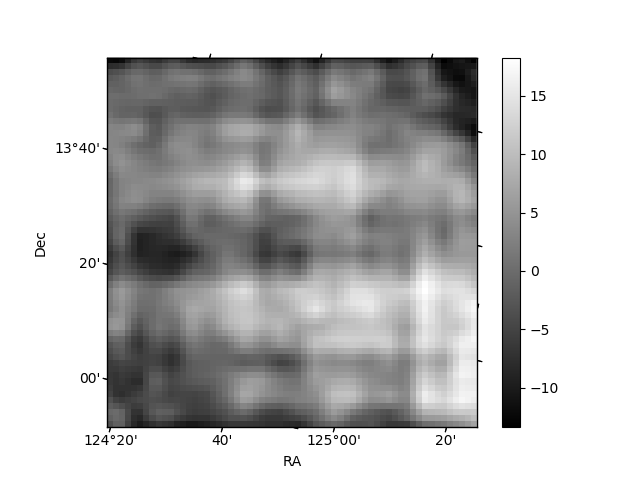
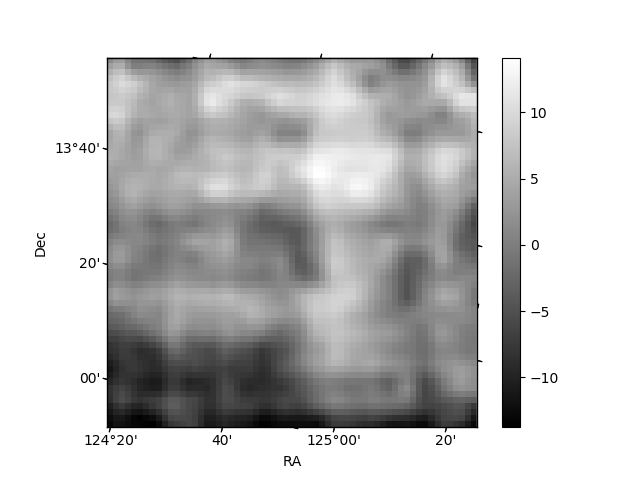
Histogram calculated using DETX and DETY for each event in the final _common_clean file
| Quadrant A | 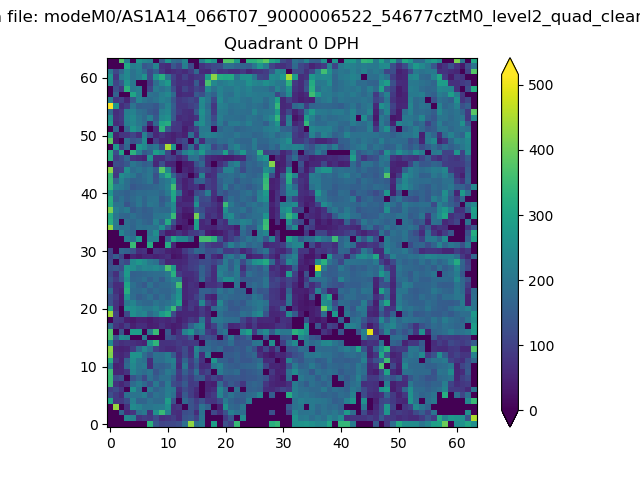 |
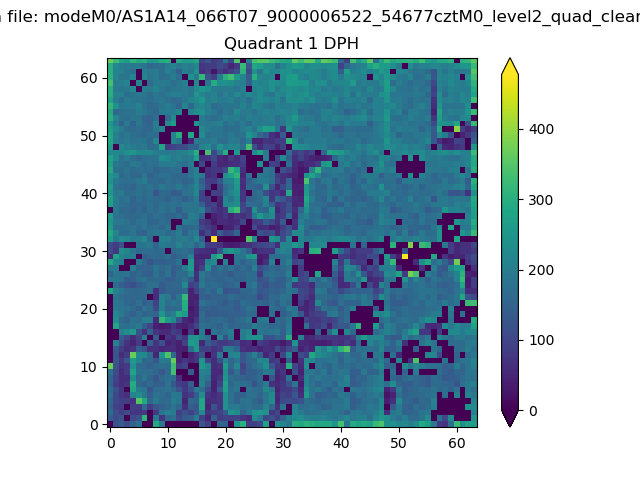 |
Quadrant B |
|---|---|---|---|
| Quadrant D |  |
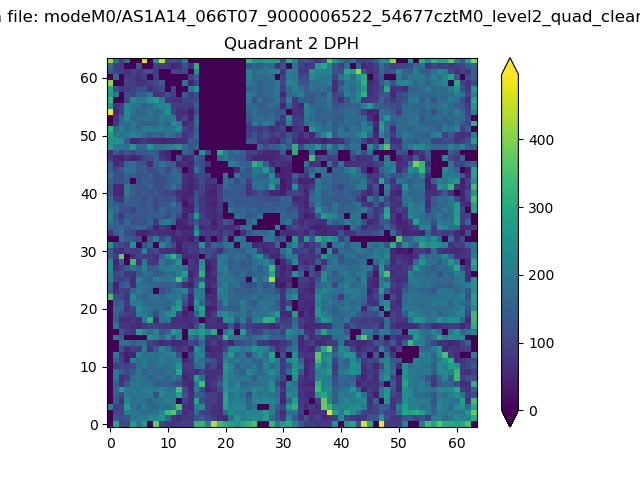 |
Quadrant C |
| Plot type | Count rate plots | Images |
|---|---|---|
| Comparison with Poisson distribution Blue bars denote a histogram of data divided into 1 sec bins. Red curve is a Poisson curve with rate = median count rate of data. |
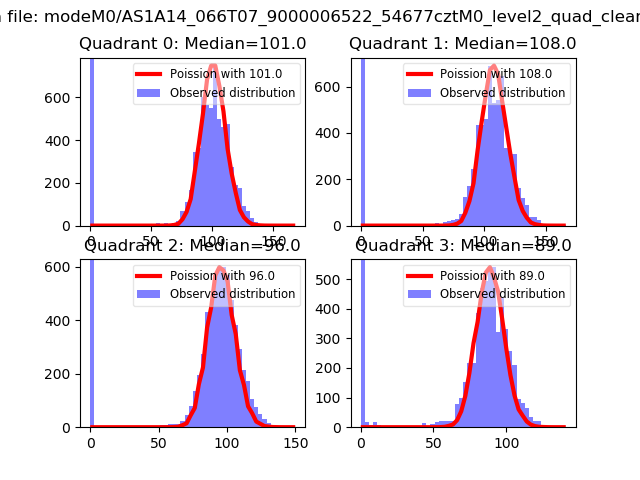 |
 |
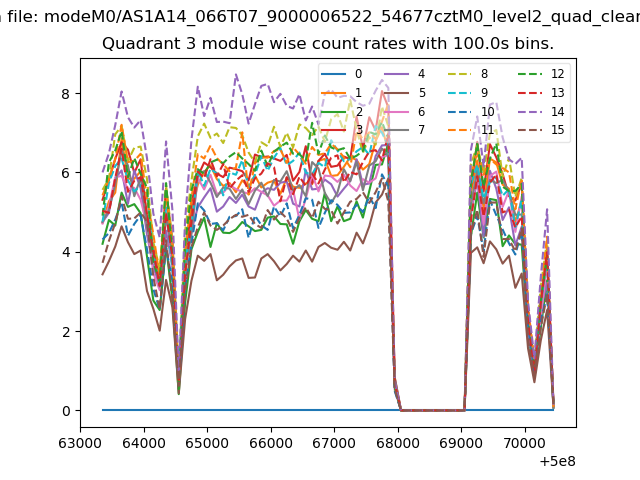
| Quadrant-wise count rates Data is divided into 100 sec bins |
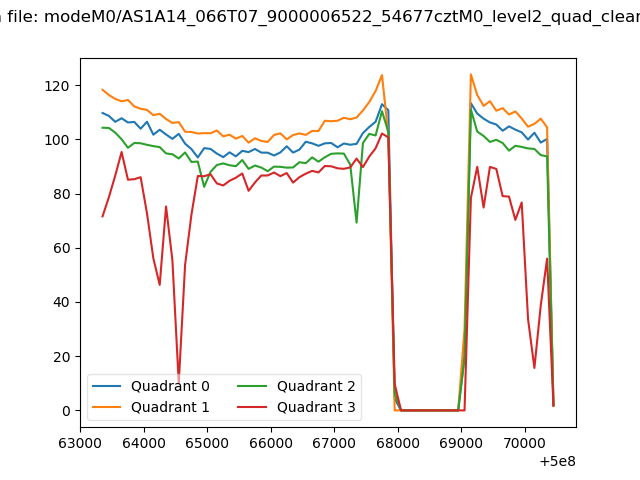 |
|
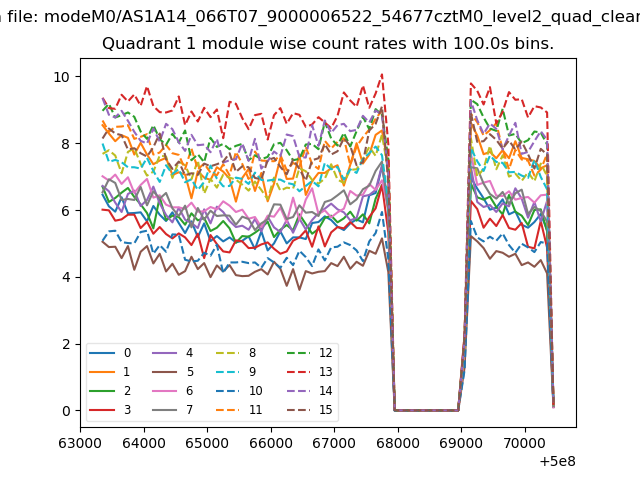
| Module-wise count rates for Quadrant A Data is divided into 100 sec bins |
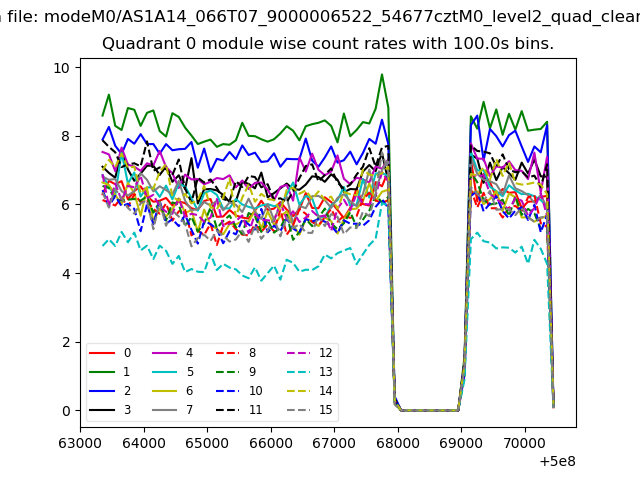 |
 |
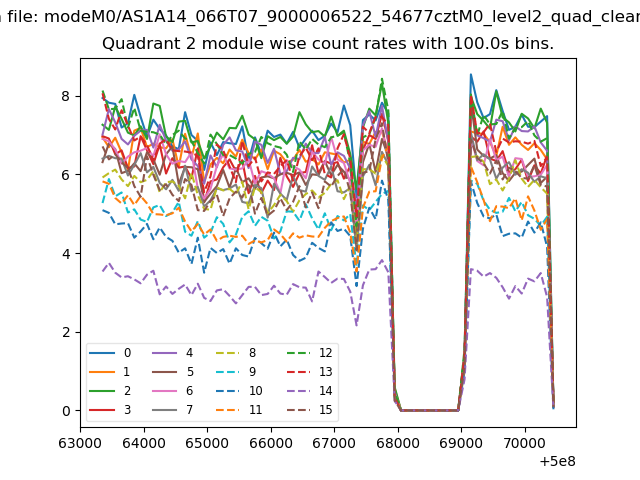
| Module-wise count rates for Quadrant B Data is divided into 100 sec bins |
 |
 |
| Module-wise count rates for Quadrant C Data is divided into 100 sec bins |
 |
 |
| Module-wise count rates for Quadrant D Data is divided into 100 sec bins |
 |
 |
| Parameter | Plot |
|---|---|
| CZT HV Monitor |  |
| D_VDD | 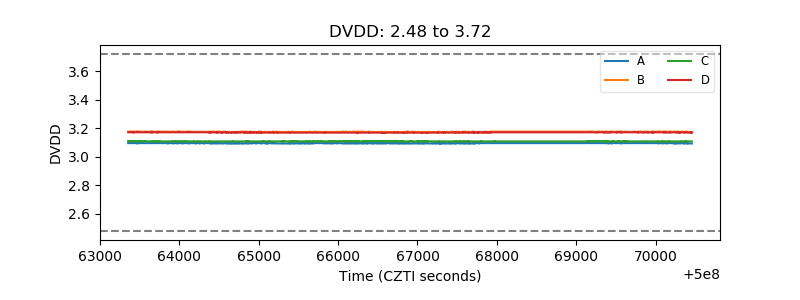 |
| Temperature 1 | 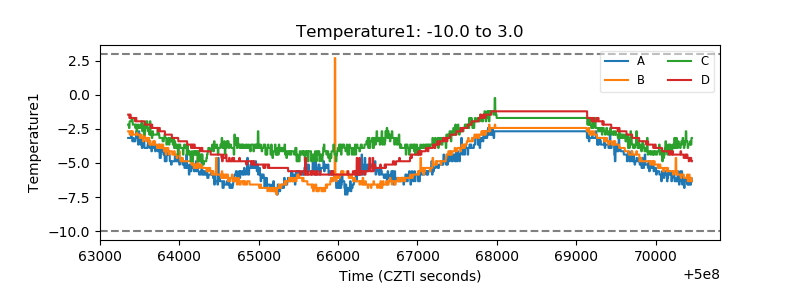 |
| Veto HV Monitor | 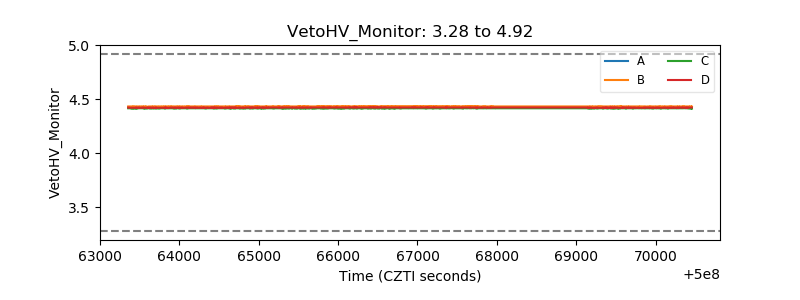 |
| Veto LLD | 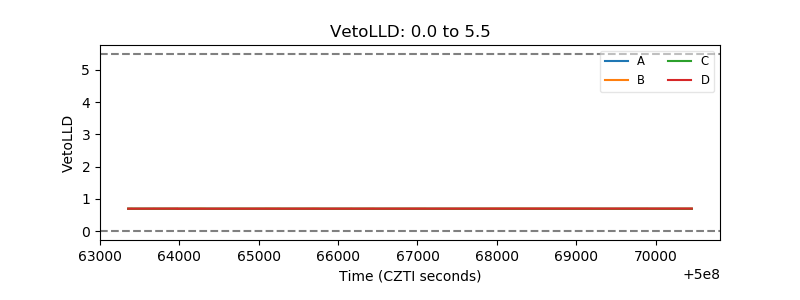 |
| Alpha Counter | 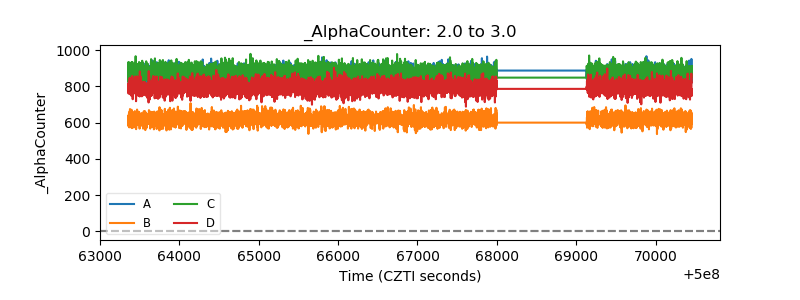 |
| _CPM_Rate | 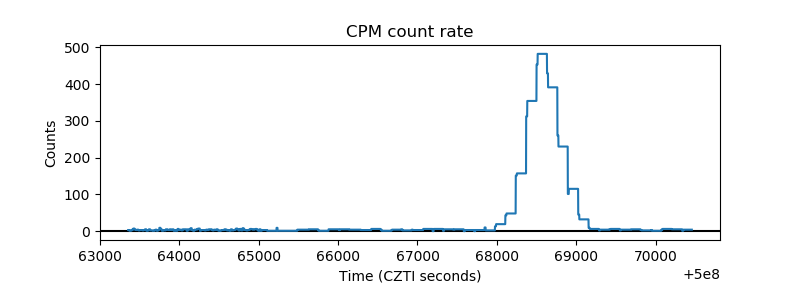 |
| CZT Counter | 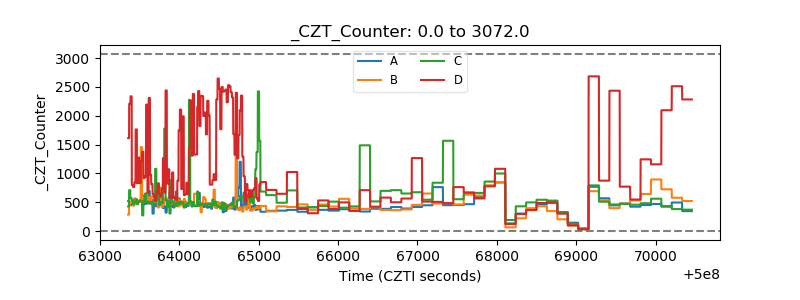 |
| +2.5 Volts monitor | 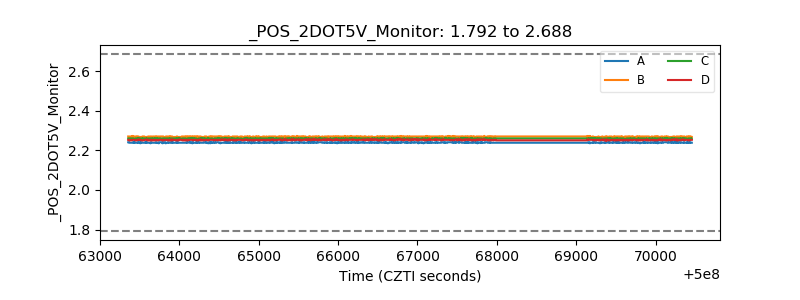 |
| +5 Volts monitor | 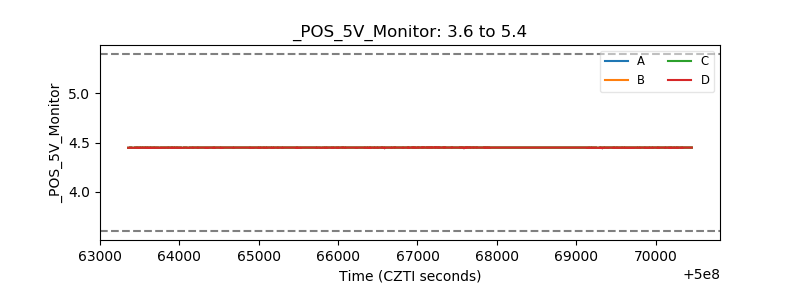 |
| _ROLL_ROT |  |
| _Roll_DEC | 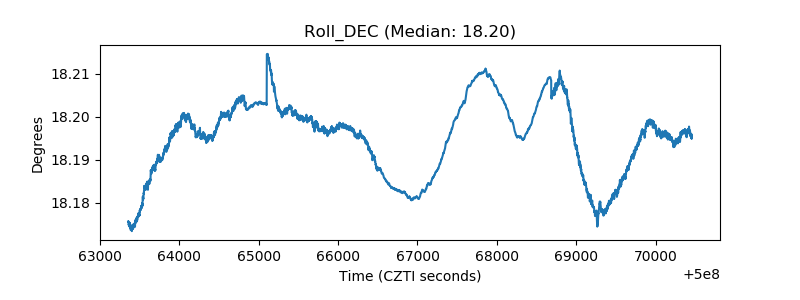 |
| _Roll_RA | 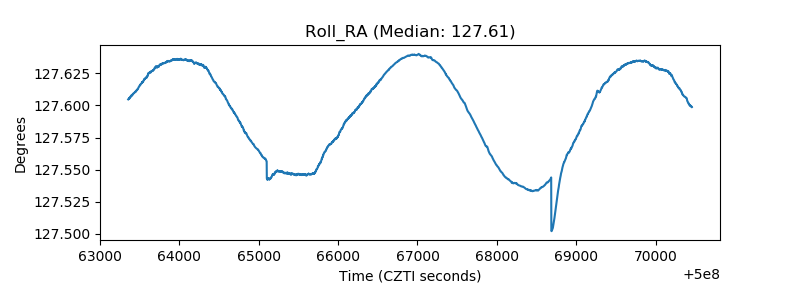 |
| Veto Counter | 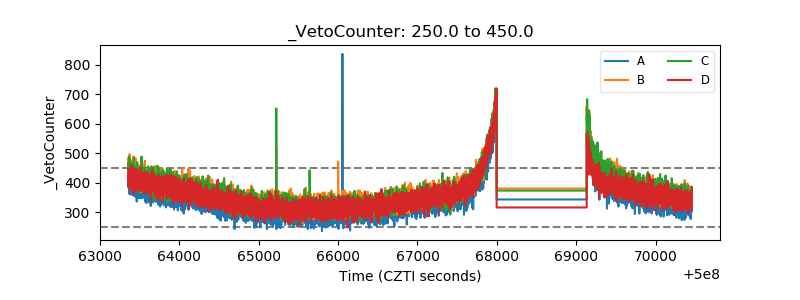 |