| Param | Original file | Final file |
|---|---|---|
| Filename | modeM0/AS1A14_066T07_9000006522_54678cztM0_level2.fits | modeM0/AS1A14_066T07_9000006522_54678cztM0_level2_quad_clean.evt |
| Size (bytes) | 485,956,800 | 92,128,320 |
| Size | 463.4 MB | 87.9 MB |
| Events in quadrant A | 3,111,276 | 624,843 |
| Events in quadrant B | 3,166,858 | 669,825 |
| Events in quadrant C | 3,183,247 | 593,224 |
| Events in quadrant D | 8,029,534 | 454,991 |
| Mode M9 | |||
|---|---|---|---|
| Quadrant | BADHDUFLAG | Total packets | Discarded packets |
| A | 0 | 10 | 0 |
| B | 0 | 10 | 0 |
| C | 0 | 10 | 0 |
| D | 0 | 10 | 0 |
| Mode M0 | |||
|---|---|---|---|
| Quadrant | BADHDUFLAG | Total packets | Discarded packets |
| A | 0 | 13989 | 1 |
| B | 0 | 14124 | 1 |
| C | 0 | 14227 | 1 |
| D | 0 | 28309 | 1 |
| Mode SS | |||
|---|---|---|---|
| Quadrant | BADHDUFLAG | Total packets | Discarded packets |
| A | 0 | 130 | 0 |
| B | 0 | 130 | 0 |
| C | 0 | 130 | 0 |
| D | 0 | 130 | 0 |
| Quadrant | Total seconds | Saturated seconds | Saturation percentage |
|---|---|---|---|
| A | 6403 | 107 | 1.671092% |
| B | 6403 | 74 | 1.155708% |
| C | 6402 | 68 | 1.062168% |
| D | 6403 | 1397 | 21.817898% |
Noise dominated data is calculated using 1-second bins in cleaned event files. If a bin has >2000 counts, and if more than 50% of those come from <1% of pixels, then it is considered to be noise-dominated and hence unusable.
| Quadrant | # 1 sec bins | Bins with >0 counts | Bins with >2000 counts | High rate bins dominated by noise | Noise dominated (total time) | Noise dominated (detector-on time) | Marked lightcurve |
|---|---|---|---|---|---|---|---|
| A | 7343 | 6404 | 49 | 49 | 0.67% | 0.77% | 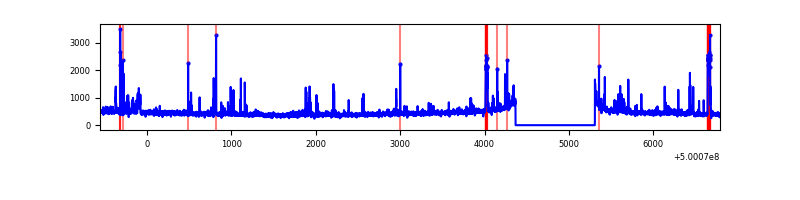 |
| B | 7343 | 6404 | 7 | 7 | 0.10% | 0.11% | 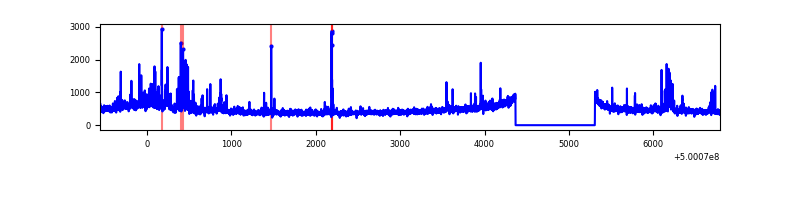 |
| C | 7342 | 6403 | 23 | 23 | 0.31% | 0.36% | 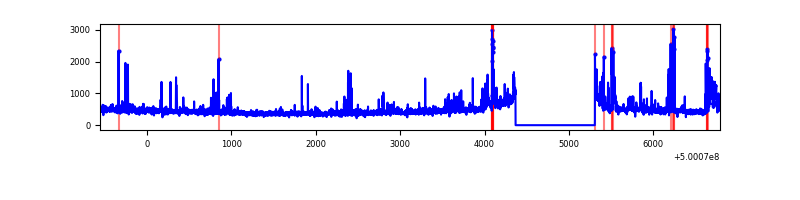 |
| D | 7343 | 6403 | 1347 | 1347 | 18.34% | 21.04% | 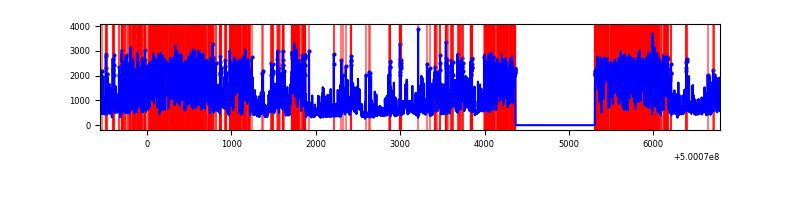 |
Top three noisy pixels from each quadrant. If the there are fewer than three noisy pixels in the level2.evt file, extra rows are filled as -1
| Pixel properties | Quadrant properties | ||||||
|---|---|---|---|---|---|---|---|
| Quadrant | DetID | PixID | Counts | Sigma | Mean | Median | Sigma |
| A | 7 | 14 | 116581 | 671.39 | 696 | 680 | 172.6 |
| A | 8 | 6 | 64784 | 371.34 | 696 | 680 | 172.6 |
| A | 11 | 3 | 63194 | 362.13 | 696 | 680 | 172.6 |
| B | 0 | 213 | 84229 | 555.73 | 695 | 669 | 150.4 |
| B | 7 | 0 | 83375 | 550.05 | 695 | 669 | 150.4 |
| B | 2 | 249 | 81500 | 537.58 | 695 | 669 | 150.4 |
| C | 4 | 5 | 208845 | 1100.25 | 682 | 678 | 189.2 |
| C | 6 | 223 | 58074 | 303.36 | 682 | 678 | 189.2 |
| C | 0 | 193 | 52706 | 274.99 | 682 | 678 | 189.2 |
| D | 11 | 129 | 3800475 | 21509.5 | 609 | 582 | 176.7 |
| D | 2 | 62 | 903017 | 5108.28 | 609 | 582 | 176.7 |
| D | 15 | 94 | 169481 | 956.06 | 609 | 582 | 176.7 |
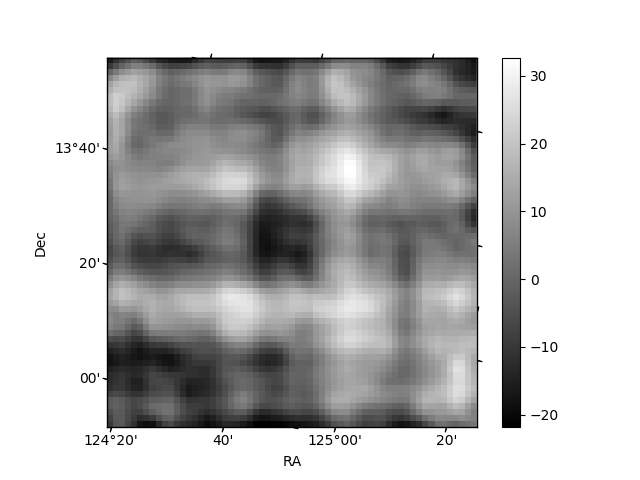
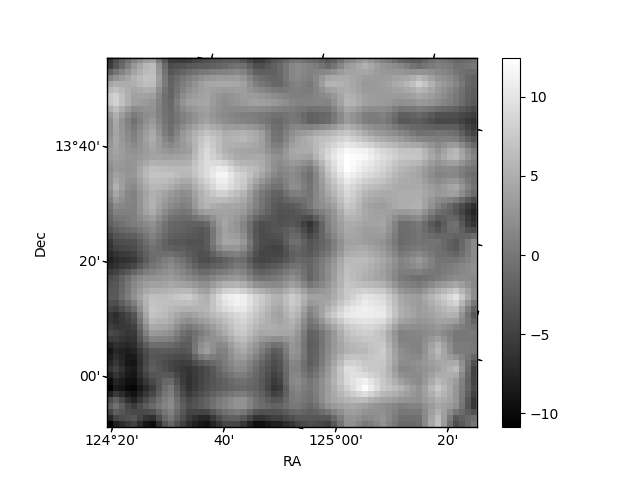
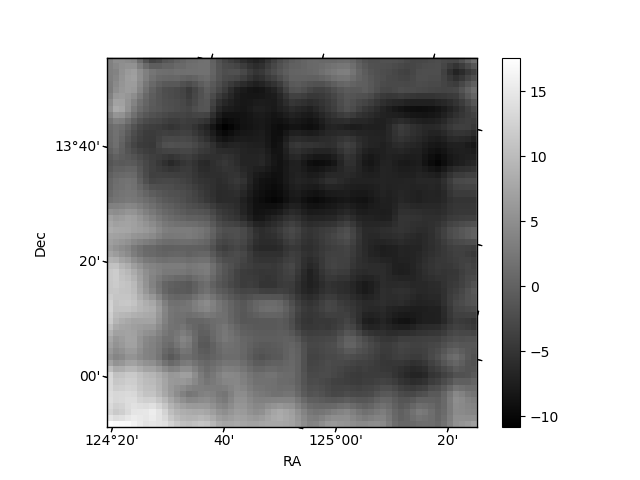
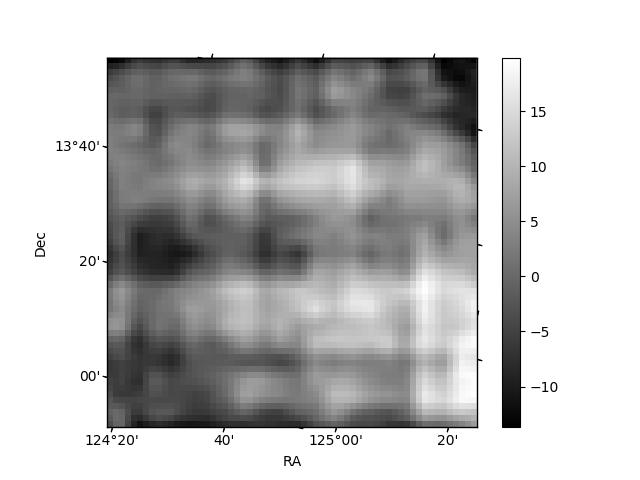
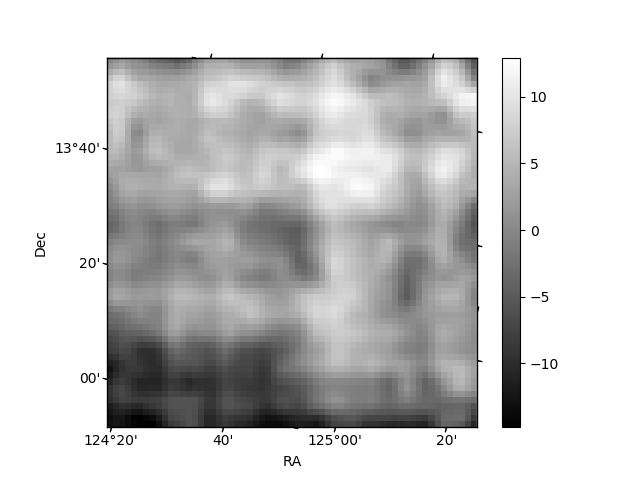
Histogram calculated using DETX and DETY for each event in the final _common_clean file
| Quadrant A | 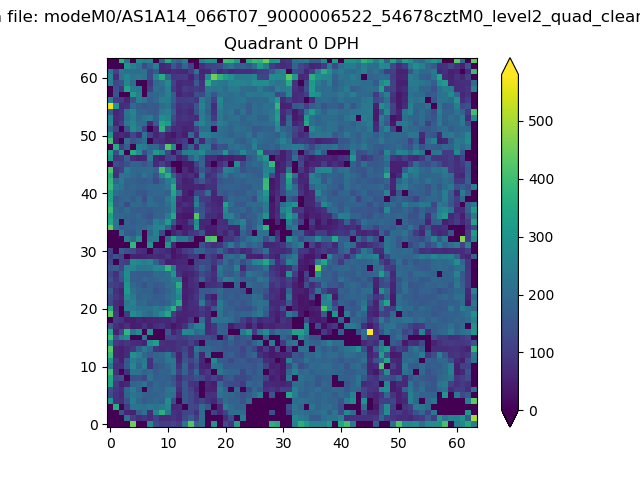 |
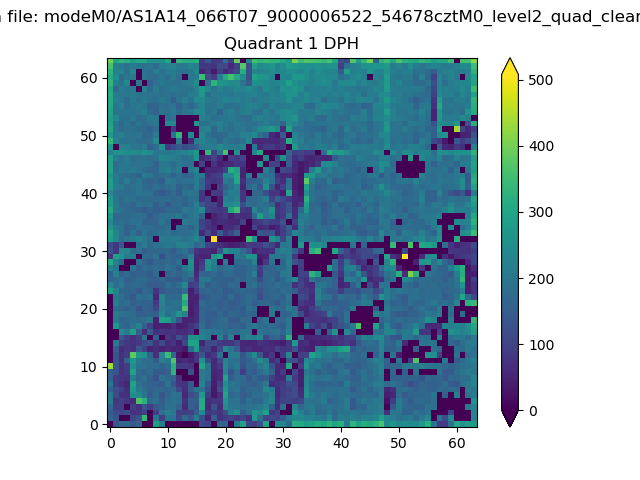 |
Quadrant B |
|---|---|---|---|
| Quadrant D | 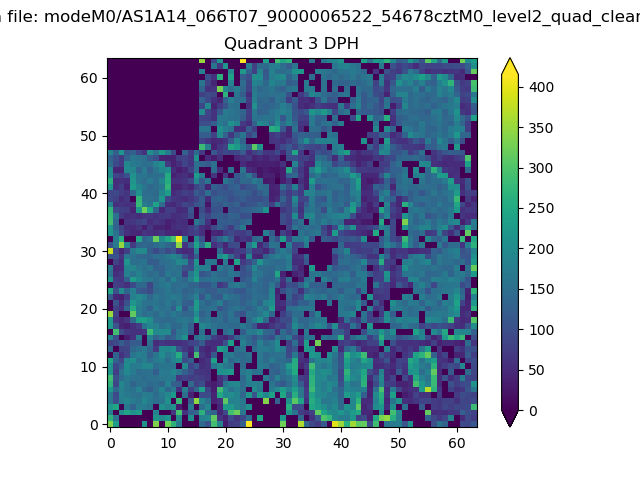 |
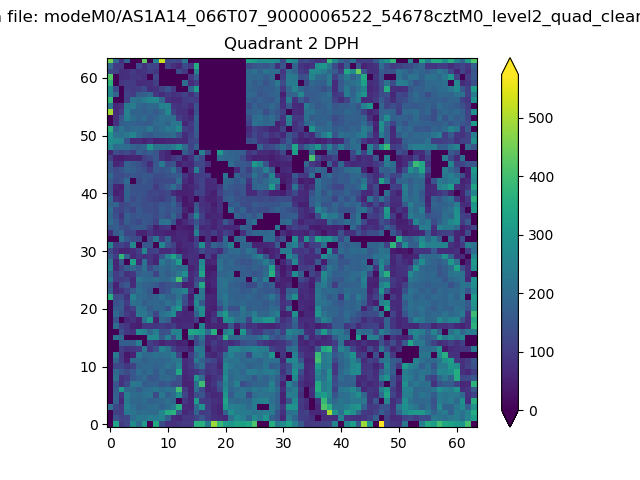 |
Quadrant C |
| Plot type | Count rate plots | Images |
|---|---|---|
| Comparison with Poisson distribution Blue bars denote a histogram of data divided into 1 sec bins. Red curve is a Poisson curve with rate = median count rate of data. |
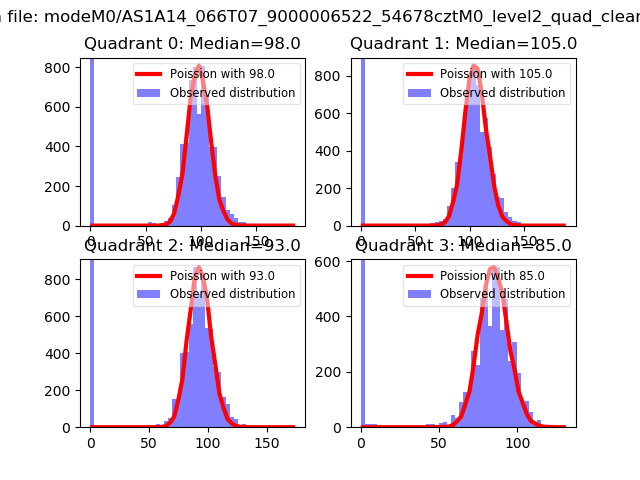 |
 |
| Quadrant-wise count rates Data is divided into 100 sec bins |
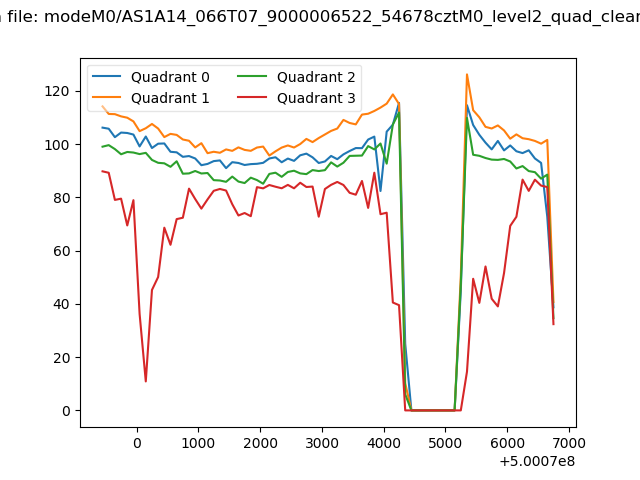 |
|
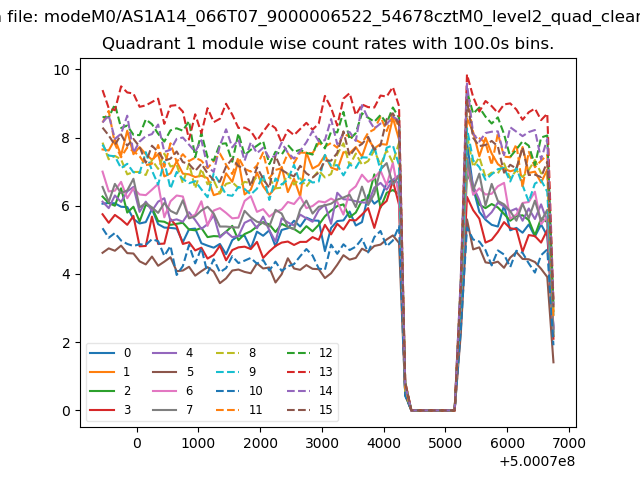
| Module-wise count rates for Quadrant A Data is divided into 100 sec bins |
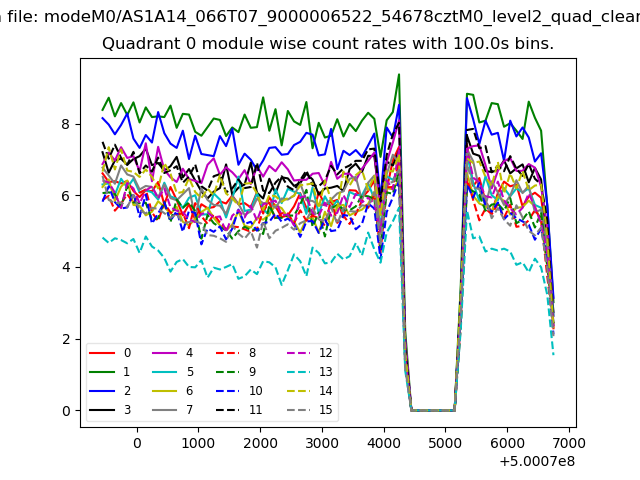 |
 |
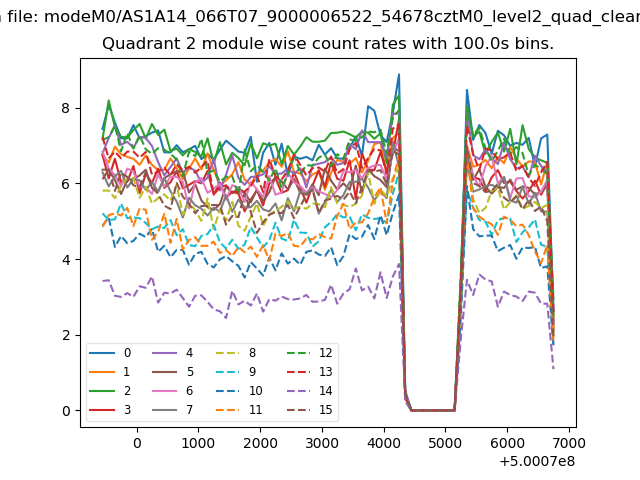
| Module-wise count rates for Quadrant B Data is divided into 100 sec bins |
 |
 |
| Module-wise count rates for Quadrant C Data is divided into 100 sec bins |
 |
 |
| Module-wise count rates for Quadrant D Data is divided into 100 sec bins |
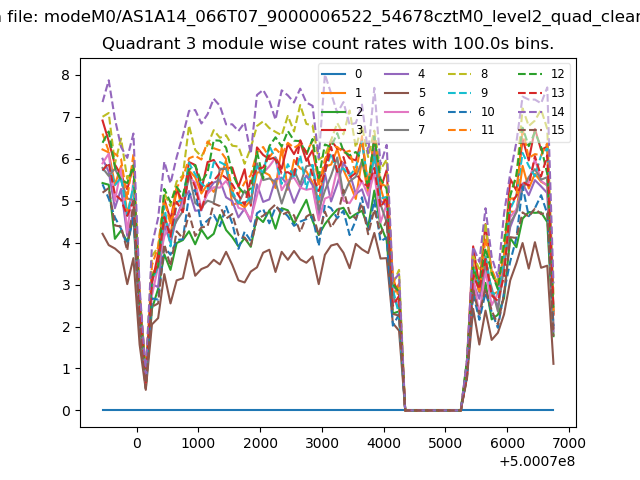 |
 |
| Parameter | Plot |
|---|---|
| CZT HV Monitor | 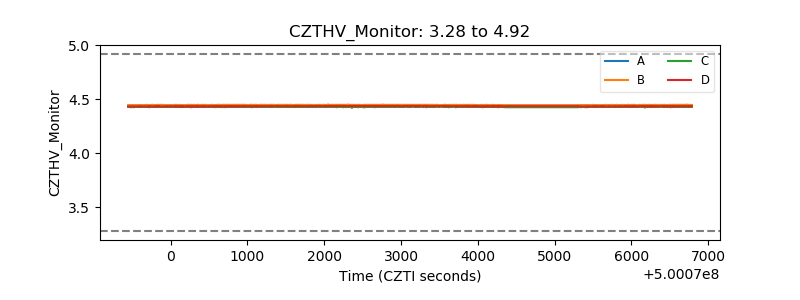 |
| D_VDD | 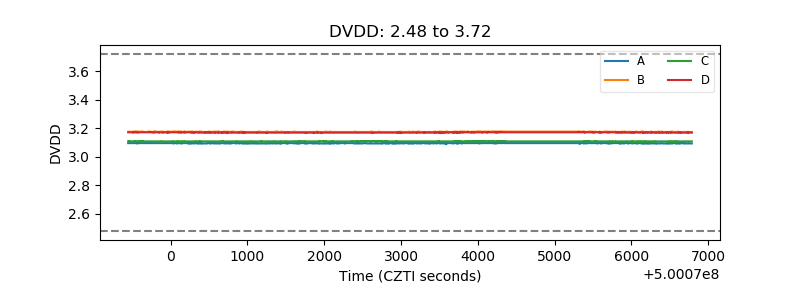 |
| Temperature 1 | 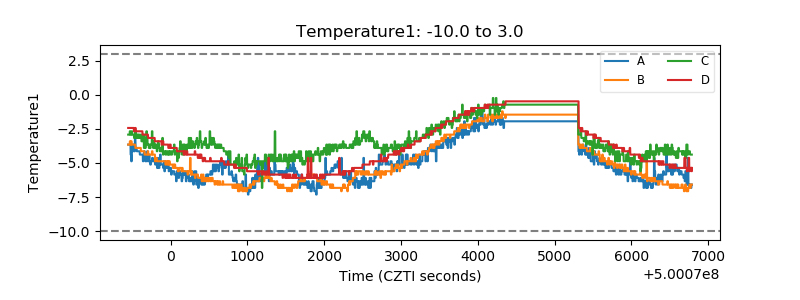 |
| Veto HV Monitor | 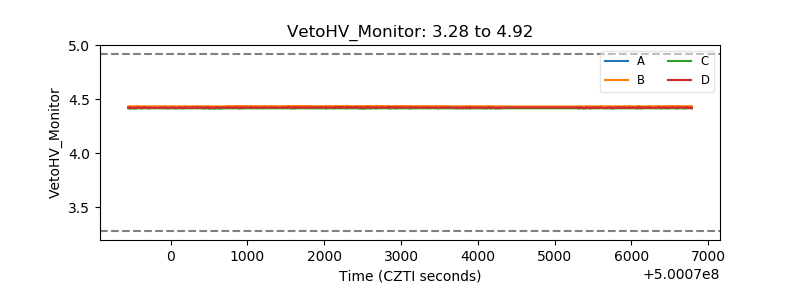 |
| Veto LLD | 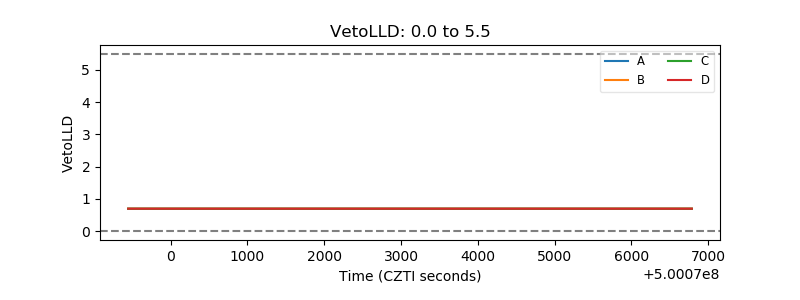 |
| Alpha Counter | 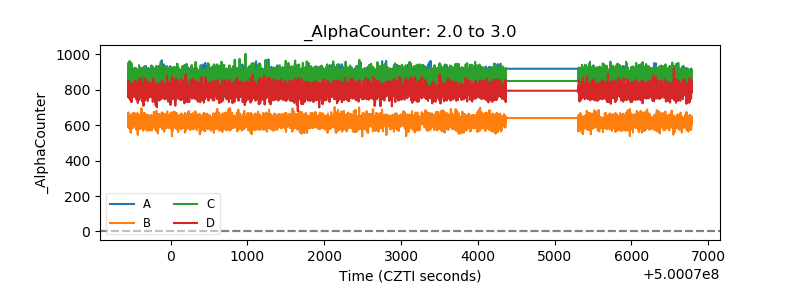 |
| _CPM_Rate | 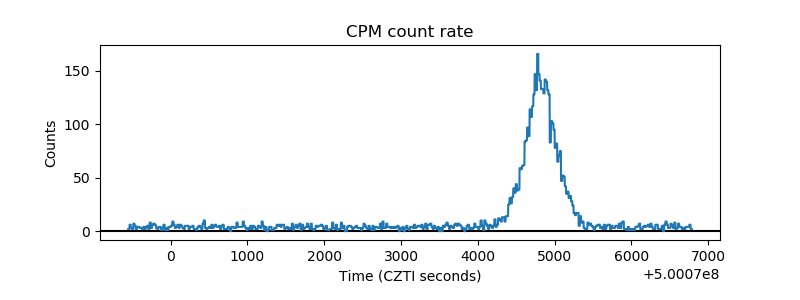 |
| CZT Counter | 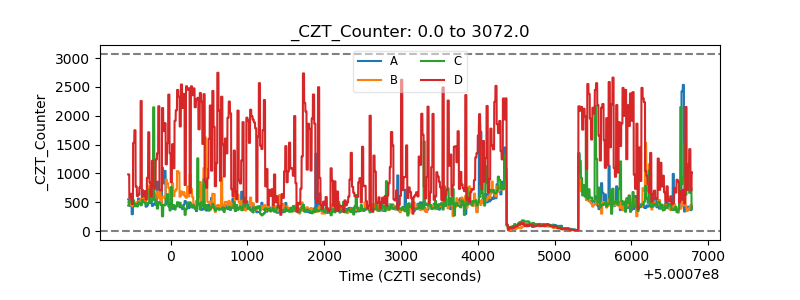 |
| +2.5 Volts monitor | 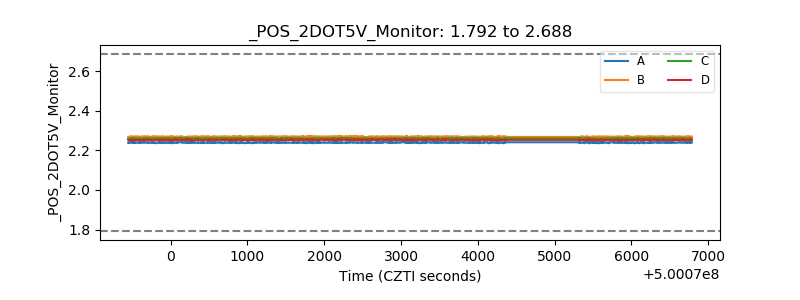 |
| +5 Volts monitor |  |
| _ROLL_ROT | 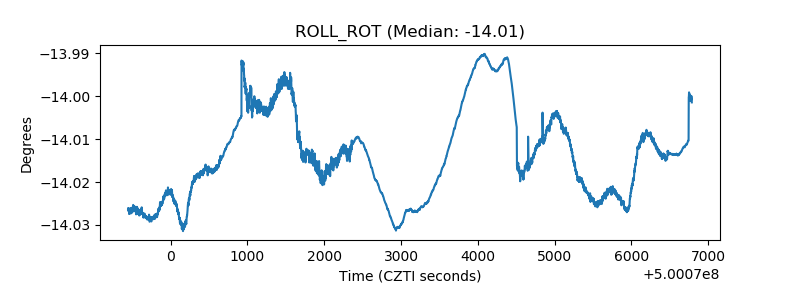 |
| _Roll_DEC | 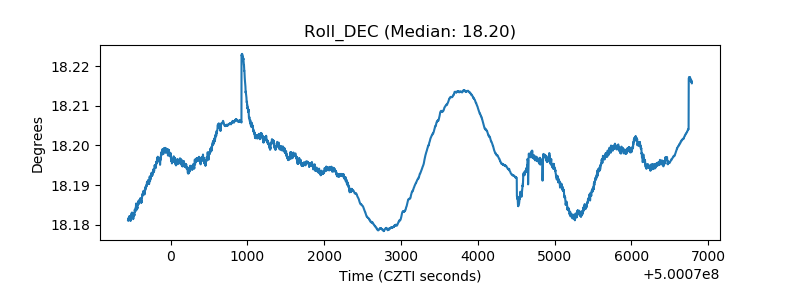 |
| _Roll_RA | 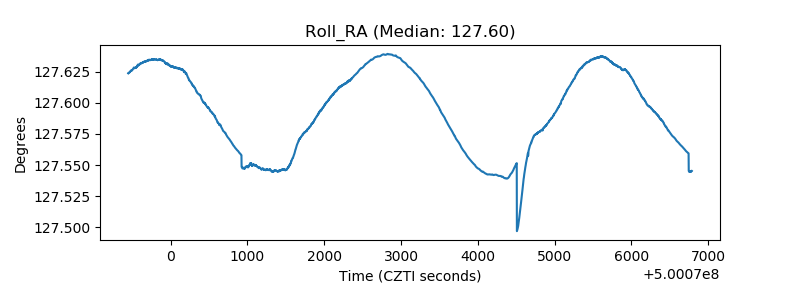 |
| Veto Counter | 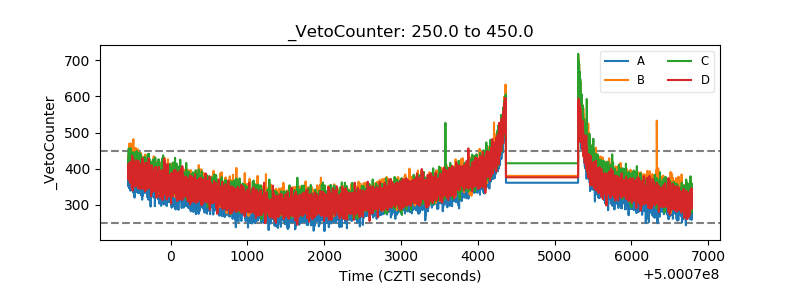 |