| Param | Original file | Final file |
|---|---|---|
| Filename | modeM0/AS1A14_066T07_9000006522_54679cztM0_level2.fits | modeM0/AS1A14_066T07_9000006522_54679cztM0_level2_quad_clean.evt |
| Size (bytes) | 566,953,920 | 99,342,720 |
| Size | 540.7 MB | 94.7 MB |
| Events in quadrant A | 3,926,361 | 671,229 |
| Events in quadrant B | 3,427,807 | 724,445 |
| Events in quadrant C | 3,691,284 | 647,209 |
| Events in quadrant D | 9,390,639 | 471,636 |
| Mode M9 | |||
|---|---|---|---|
| Quadrant | BADHDUFLAG | Total packets | Discarded packets |
| A | 0 | 5 | 0 |
| B | 0 | 5 | 0 |
| C | 0 | 5 | 0 |
| D | 0 | 5 | 0 |
| Mode M0 | |||
|---|---|---|---|
| Quadrant | BADHDUFLAG | Total packets | Discarded packets |
| A | 0 | 16997 | 1 |
| B | 0 | 15367 | 1 |
| C | 0 | 16145 | 1 |
| D | 0 | 32868 | 3 |
| Mode SS | |||
|---|---|---|---|
| Quadrant | BADHDUFLAG | Total packets | Discarded packets |
| A | 0 | 142 | 0 |
| B | 0 | 142 | 0 |
| C | 0 | 142 | 0 |
| D | 0 | 142 | 0 |
| Quadrant | Total seconds | Saturated seconds | Saturation percentage |
|---|---|---|---|
| A | 7091 | 210 | 2.961500% |
| B | 7091 | 132 | 1.861515% |
| C | 7092 | 84 | 1.184433% |
| D | 7091 | 1749 | 24.665068% |
Noise dominated data is calculated using 1-second bins in cleaned event files. If a bin has >2000 counts, and if more than 50% of those come from <1% of pixels, then it is considered to be noise-dominated and hence unusable.
| Quadrant | # 1 sec bins | Bins with >0 counts | Bins with >2000 counts | High rate bins dominated by noise | Noise dominated (total time) | Noise dominated (detector-on time) | Marked lightcurve |
|---|---|---|---|---|---|---|---|
| A | 7566 | 7092 | 135 | 135 | 1.78% | 1.90% | 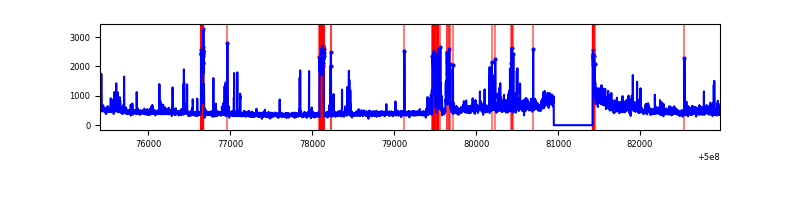 |
| B | 7566 | 7092 | 23 | 23 | 0.30% | 0.32% | 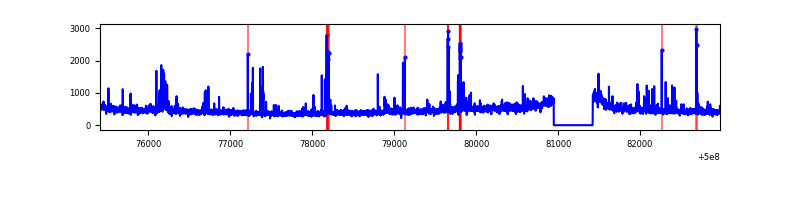 |
| C | 7567 | 7093 | 43 | 43 | 0.57% | 0.61% | 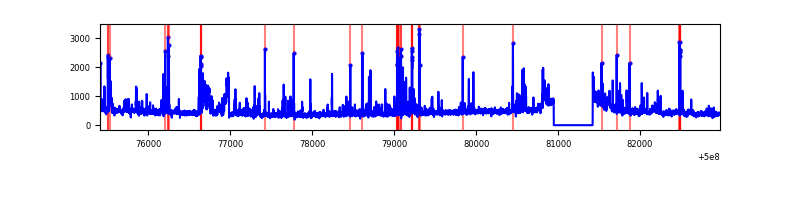 |
| D | 7565 | 7091 | 1644 | 1644 | 21.73% | 23.18% | 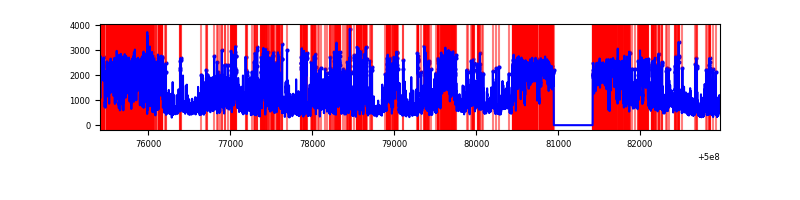 |
Top three noisy pixels from each quadrant. If the there are fewer than three noisy pixels in the level2.evt file, extra rows are filled as -1
| Pixel properties | Quadrant properties | ||||||
|---|---|---|---|---|---|---|---|
| Quadrant | DetID | PixID | Counts | Sigma | Mean | Median | Sigma |
| A | 7 | 14 | 387888 | 2040.51 | 765 | 743 | 189.7 |
| A | 3 | 14 | 352826 | 1855.71 | 765 | 743 | 189.7 |
| A | 11 | 3 | 79938 | 417.41 | 765 | 743 | 189.7 |
| B | 2 | 249 | 133606 | 793.16 | 768 | 740 | 167.5 |
| B | 0 | 213 | 119070 | 706.38 | 768 | 740 | 167.5 |
| B | 10 | 247 | 68612 | 405.17 | 768 | 740 | 167.5 |
| C | 4 | 5 | 274242 | 1310.02 | 754 | 748 | 208.8 |
| C | 14 | 254 | 150622 | 717.89 | 754 | 748 | 208.8 |
| C | 6 | 223 | 106050 | 504.39 | 754 | 748 | 208.8 |
| D | 11 | 129 | 5158718 | 27657.62 | 648 | 619 | 186.5 |
| D | 2 | 62 | 729475 | 3908.11 | 648 | 619 | 186.5 |
| D | 11 | 176 | 413664 | 2214.74 | 648 | 619 | 186.5 |
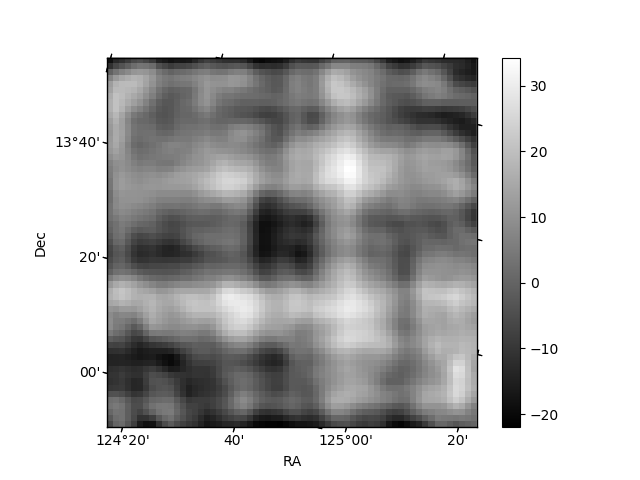
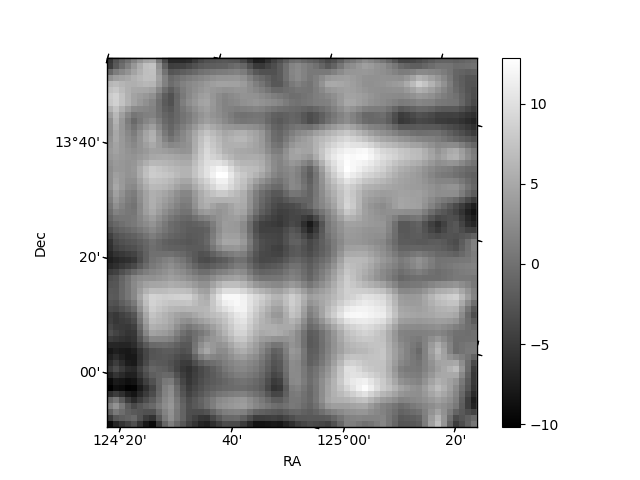
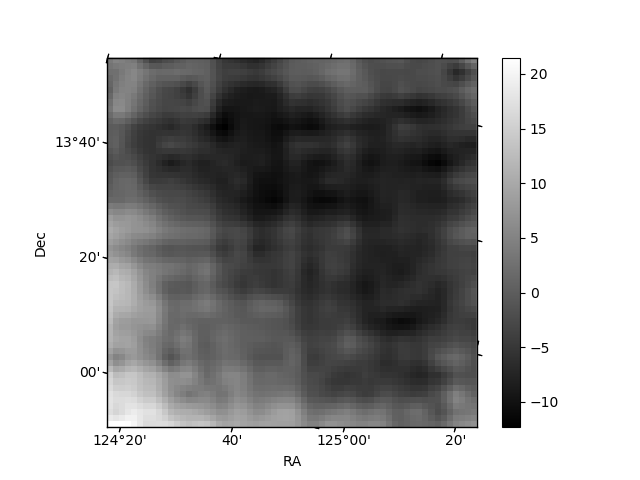
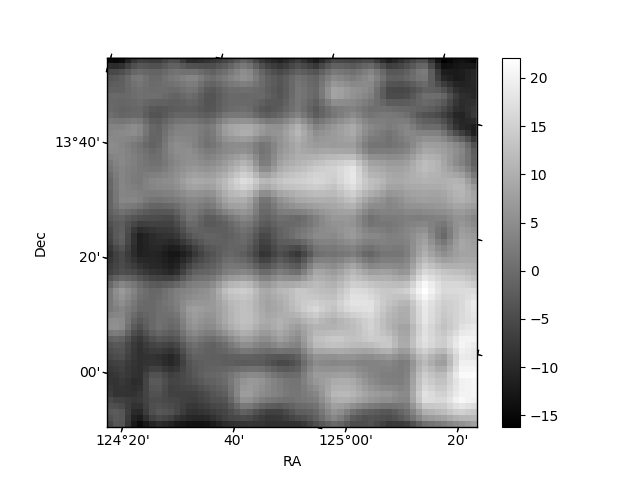
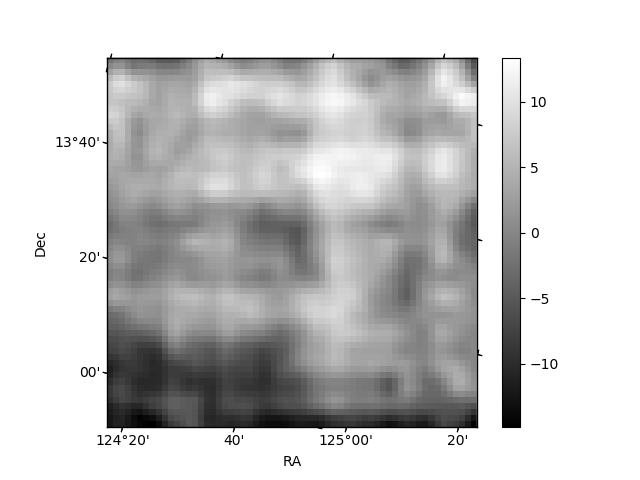
Histogram calculated using DETX and DETY for each event in the final _common_clean file
| Quadrant A | 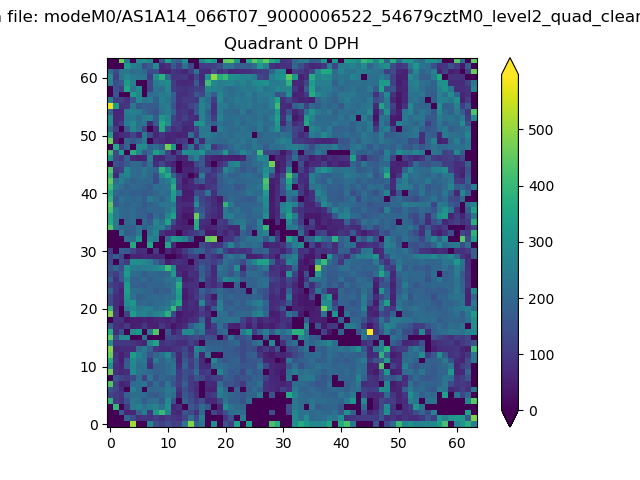 |
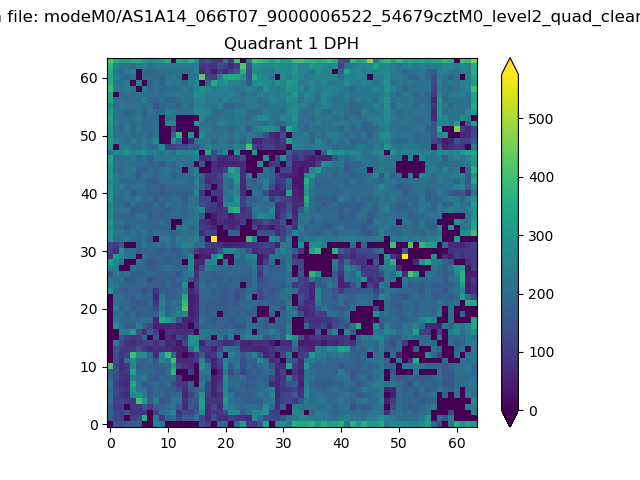 |
Quadrant B |
|---|---|---|---|
| Quadrant D | 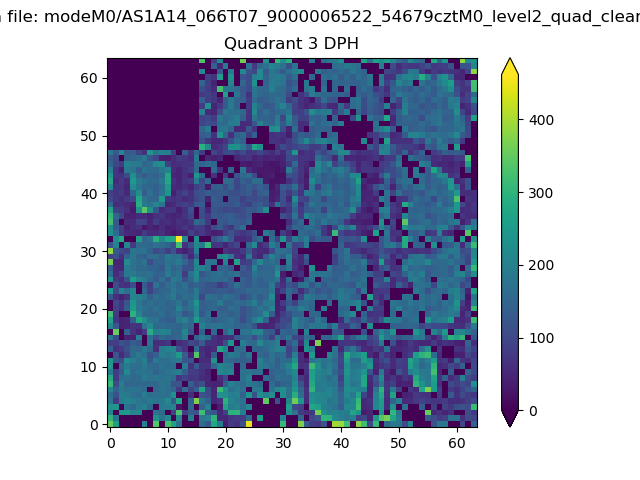 |
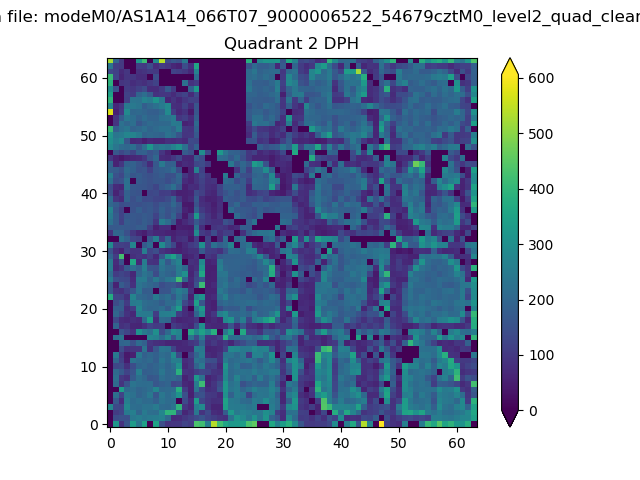 |
Quadrant C |
| Plot type | Count rate plots | Images |
|---|---|---|
| Comparison with Poisson distribution Blue bars denote a histogram of data divided into 1 sec bins. Red curve is a Poisson curve with rate = median count rate of data. |
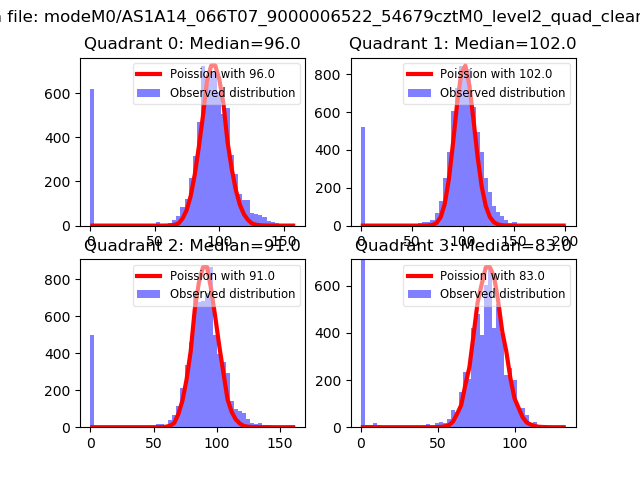 |
 |
| Quadrant-wise count rates Data is divided into 100 sec bins |
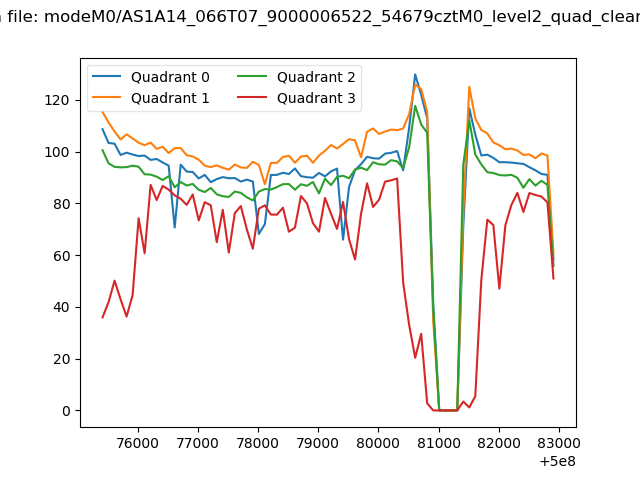 |
|
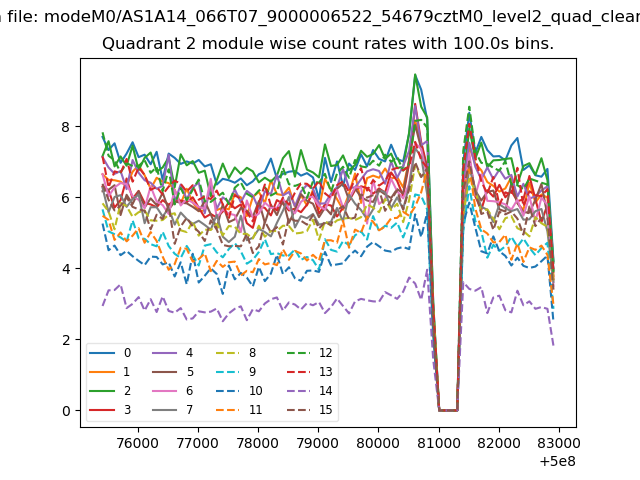
| Module-wise count rates for Quadrant A Data is divided into 100 sec bins |
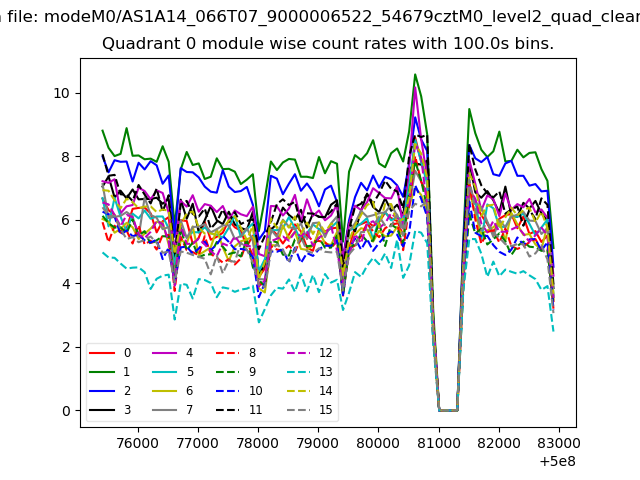 |
 |
| Module-wise count rates for Quadrant B Data is divided into 100 sec bins |
 |
 |
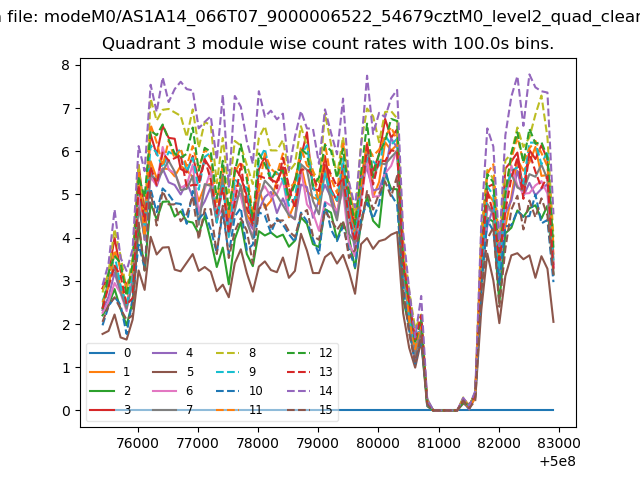
| Module-wise count rates for Quadrant C Data is divided into 100 sec bins |
 |
 |
| Module-wise count rates for Quadrant D Data is divided into 100 sec bins |
 |
 |
| Parameter | Plot |
|---|---|
| CZT HV Monitor | 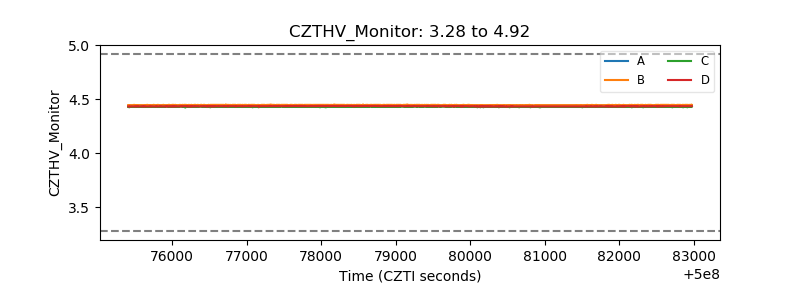 |
| D_VDD | 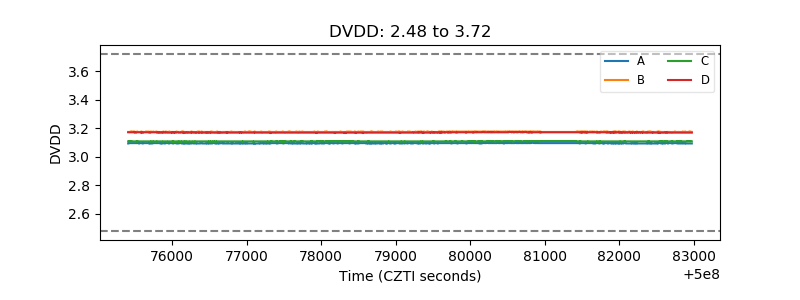 |
| Temperature 1 | 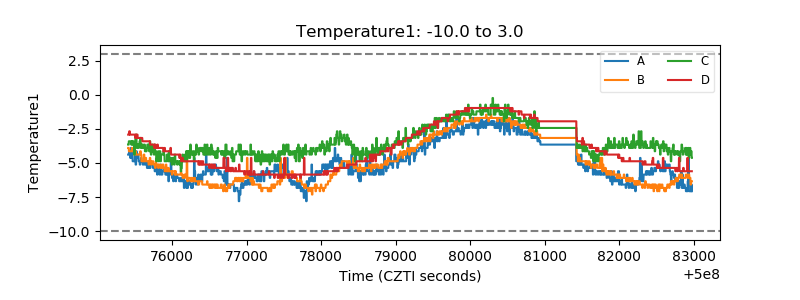 |
| Veto HV Monitor | 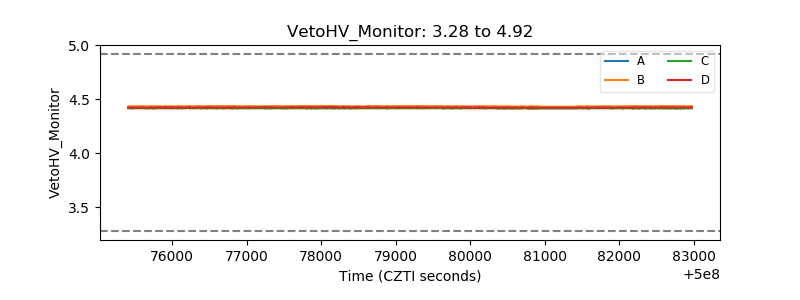 |
| Veto LLD | 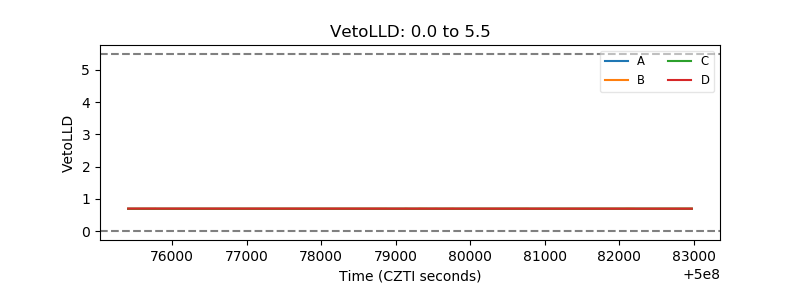 |
| Alpha Counter | 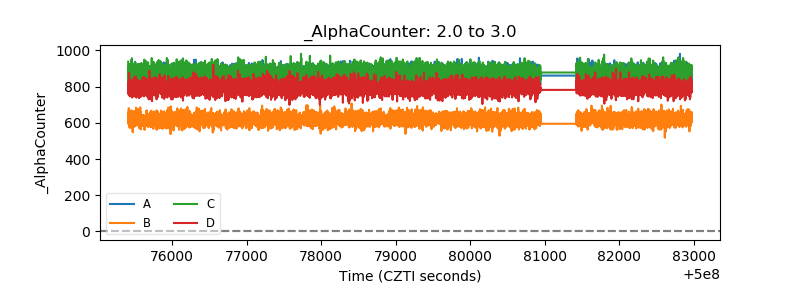 |
| _CPM_Rate | 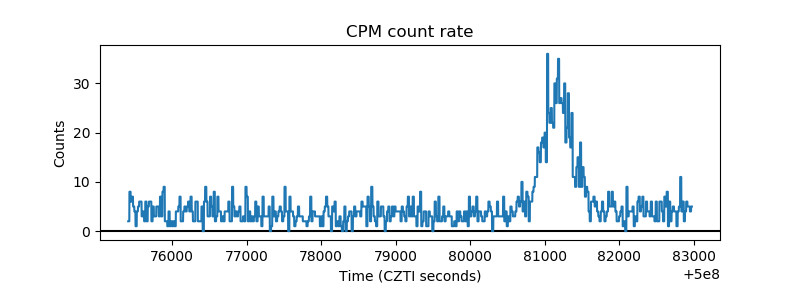 |
| CZT Counter |  |
| +2.5 Volts monitor | 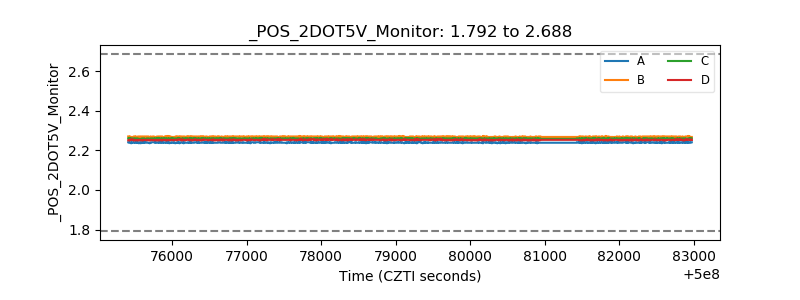 |
| +5 Volts monitor | 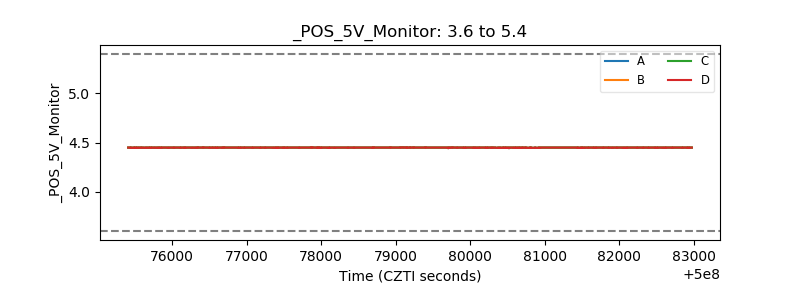 |
| _ROLL_ROT | 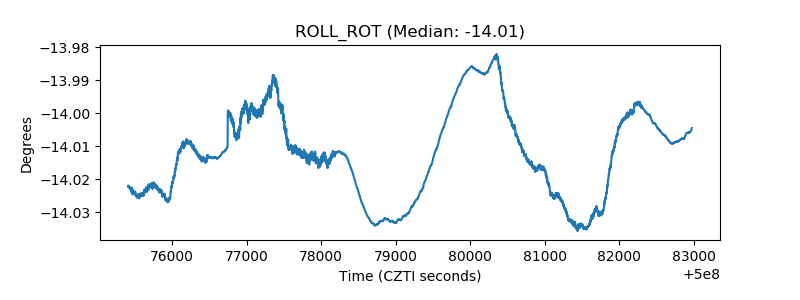 |
| _Roll_DEC | 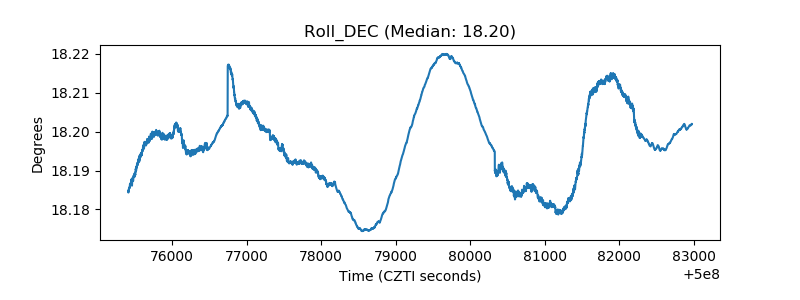 |
| _Roll_RA | 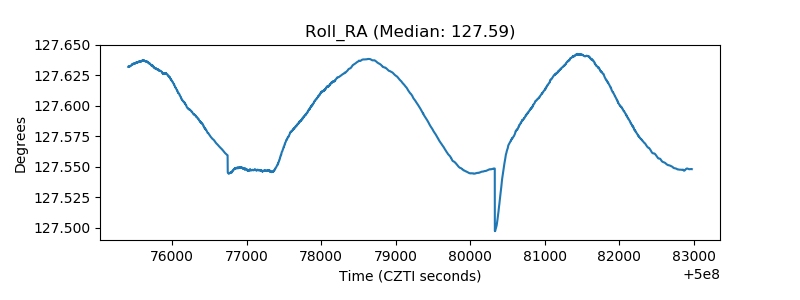 |
| Veto Counter | 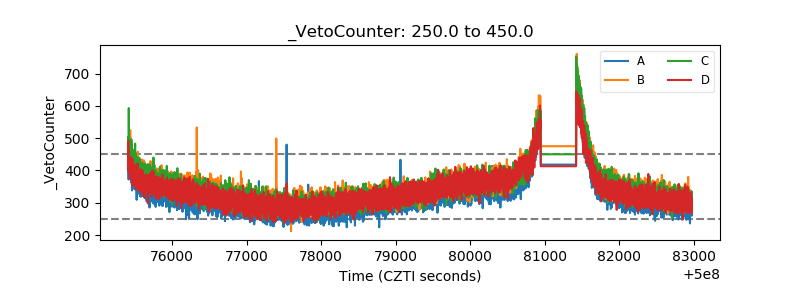 |