| Param | Original file | Final file |
|---|---|---|
| Filename | modeM0/AS1A14_066T07_9000006522_54680cztM0_level2.fits | modeM0/AS1A14_066T07_9000006522_54680cztM0_level2_quad_clean.evt |
| Size (bytes) | 668,638,080 | 109,244,160 |
| Size | 637.7 MB | 104.2 MB |
| Events in quadrant A | 4,190,912 | 757,473 |
| Events in quadrant B | 3,923,144 | 805,247 |
| Events in quadrant C | 4,798,977 | 705,276 |
| Events in quadrant D | 11,223,885 | 489,529 |
| Mode M9 | |||
|---|---|---|---|
| Quadrant | BADHDUFLAG | Total packets | Discarded packets |
| A | 0 | 5 | 0 |
| B | 0 | 5 | 0 |
| C | 0 | 5 | 0 |
| D | 0 | 5 | 0 |
| Mode M0 | |||
|---|---|---|---|
| Quadrant | BADHDUFLAG | Total packets | Discarded packets |
| A | 0 | 18069 | 1 |
| B | 0 | 17491 | 1 |
| C | 0 | 19859 | 1 |
| D | 0 | 38903 | 1 |
| Mode SS | |||
|---|---|---|---|
| Quadrant | BADHDUFLAG | Total packets | Discarded packets |
| A | 0 | 160 | 0 |
| B | 0 | 160 | 0 |
| C | 0 | 160 | 0 |
| D | 0 | 160 | 0 |
| Quadrant | Total seconds | Saturated seconds | Saturation percentage |
|---|---|---|---|
| A | 7912 | 120 | 1.516684% |
| B | 7913 | 160 | 2.021989% |
| C | 7913 | 291 | 3.677493% |
| D | 7913 | 2438 | 30.810059% |
Noise dominated data is calculated using 1-second bins in cleaned event files. If a bin has >2000 counts, and if more than 50% of those come from <1% of pixels, then it is considered to be noise-dominated and hence unusable.
| Quadrant | # 1 sec bins | Bins with >0 counts | Bins with >2000 counts | High rate bins dominated by noise | Noise dominated (total time) | Noise dominated (detector-on time) | Marked lightcurve |
|---|---|---|---|---|---|---|---|
| A | 8387 | 7913 | 61 | 61 | 0.73% | 0.77% | 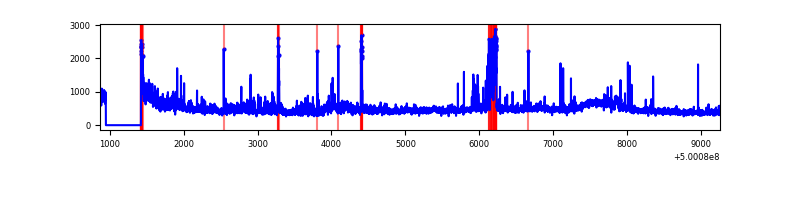 |
| B | 8388 | 7914 | 28 | 28 | 0.33% | 0.35% | 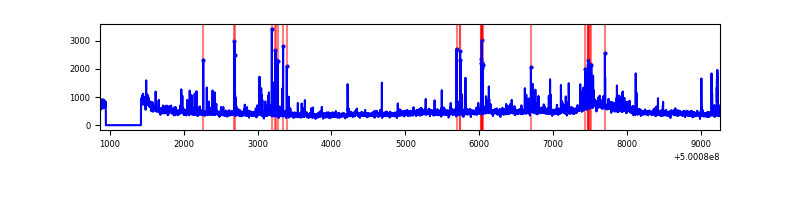 |
| C | 8388 | 7914 | 244 | 244 | 2.91% | 3.08% | 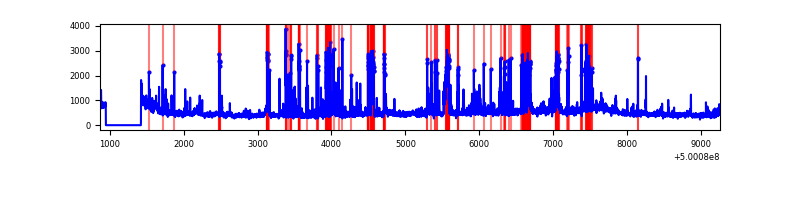 |
| D | 8388 | 7914 | 2294 | 2294 | 27.35% | 28.99% | 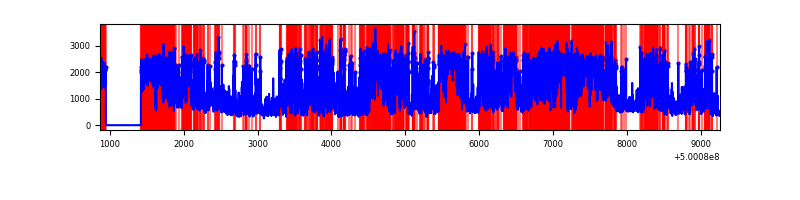 |
Top three noisy pixels from each quadrant. If the there are fewer than three noisy pixels in the level2.evt file, extra rows are filled as -1
| Pixel properties | Quadrant properties | ||||||
|---|---|---|---|---|---|---|---|
| Quadrant | DetID | PixID | Counts | Sigma | Mean | Median | Sigma |
| A | 3 | 14 | 421742 | 1935.46 | 874 | 851 | 217.5 |
| A | 13 | 248 | 138323 | 632.16 | 874 | 851 | 217.5 |
| A | 7 | 14 | 90659 | 412.98 | 874 | 851 | 217.5 |
| B | 2 | 249 | 239600 | 1276.89 | 869 | 839 | 187.0 |
| B | 0 | 213 | 127769 | 678.82 | 869 | 839 | 187.0 |
| B | 10 | 247 | 70424 | 372.14 | 869 | 839 | 187.0 |
| C | 4 | 5 | 483855 | 2066.84 | 844 | 836 | 233.7 |
| C | 13 | 3 | 375394 | 1602.74 | 844 | 836 | 233.7 |
| C | 14 | 254 | 268715 | 1146.26 | 844 | 836 | 233.7 |
| D | 11 | 129 | 5901561 | 29028.49 | 714 | 683 | 203.3 |
| D | 11 | 176 | 1439171 | 7076.43 | 714 | 683 | 203.3 |
| D | 2 | 62 | 607713 | 2986.19 | 714 | 683 | 203.3 |
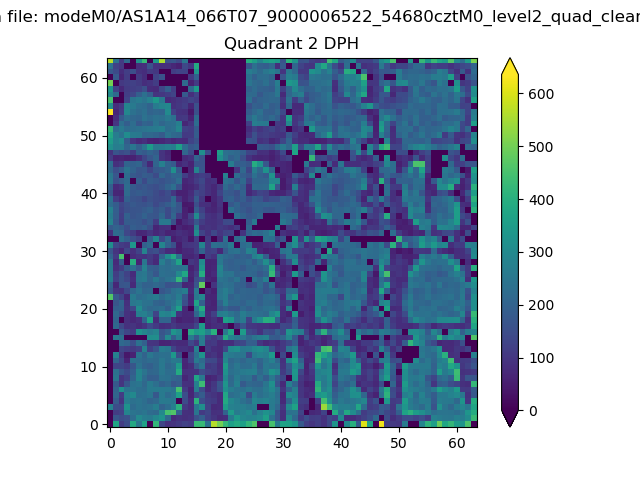
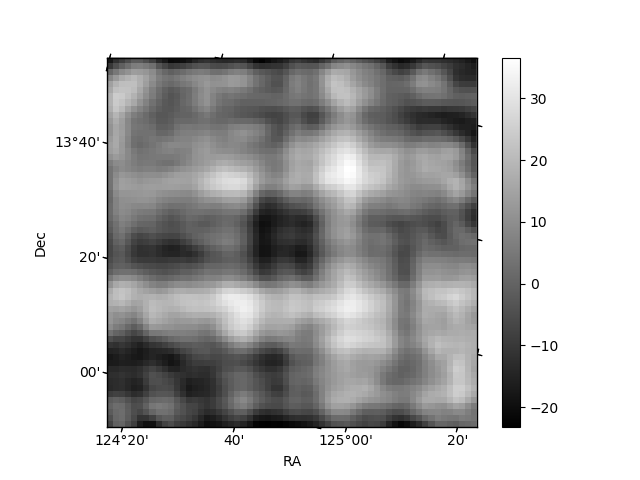
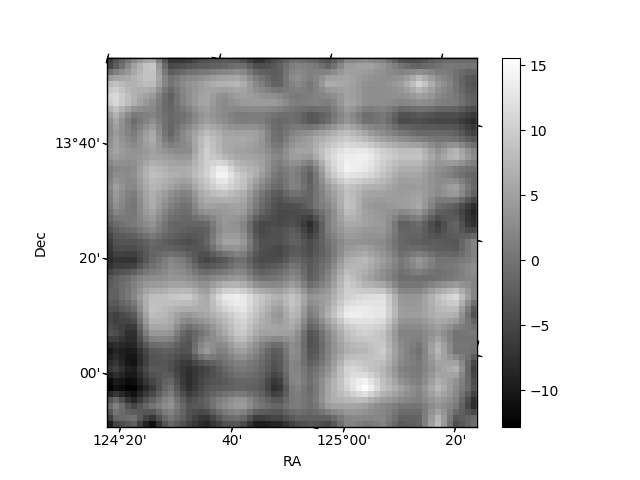
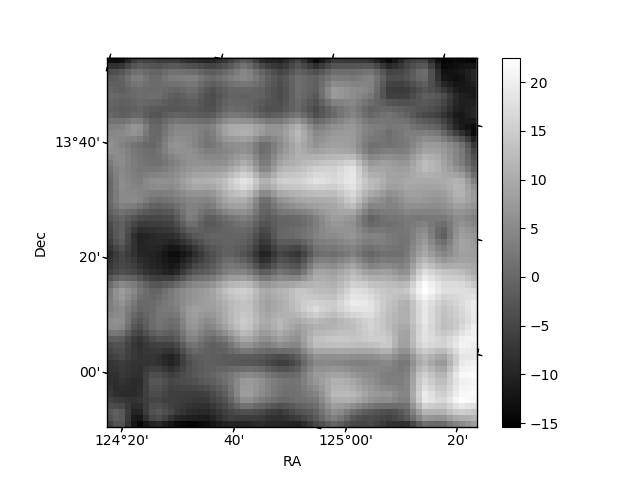
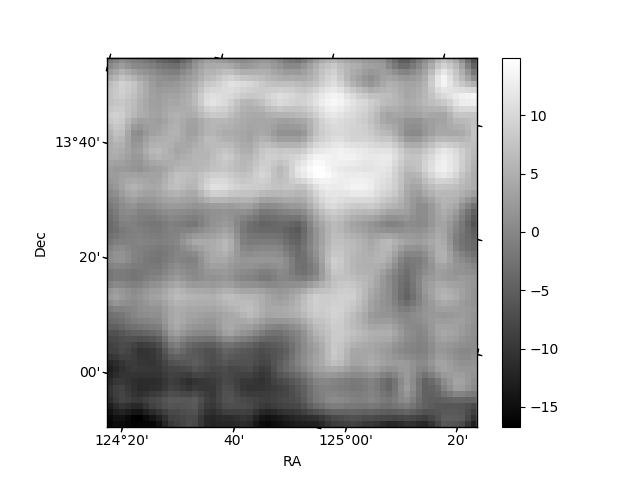
Histogram calculated using DETX and DETY for each event in the final _common_clean file
| Quadrant A | 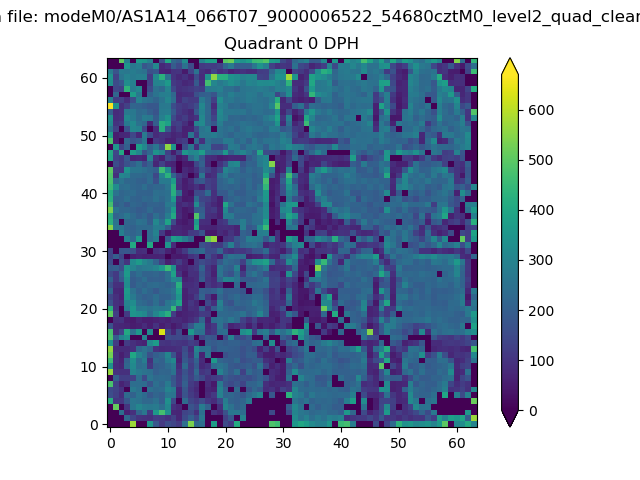 |
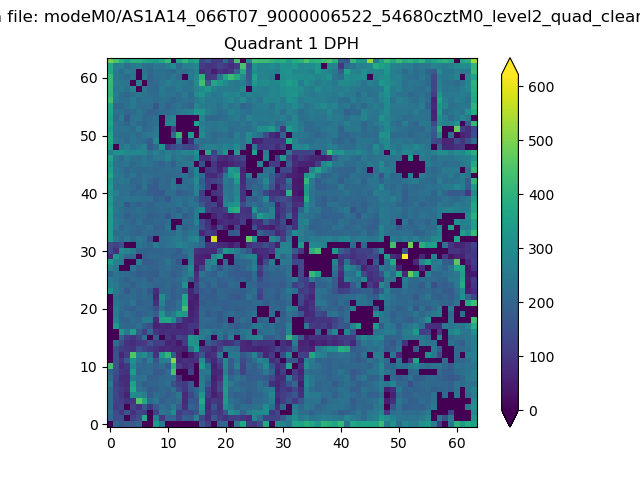 |
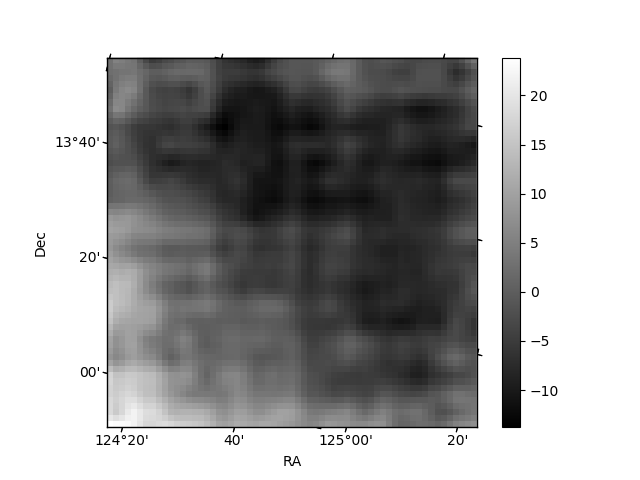
Quadrant B |
|---|---|---|---|
| Quadrant D | 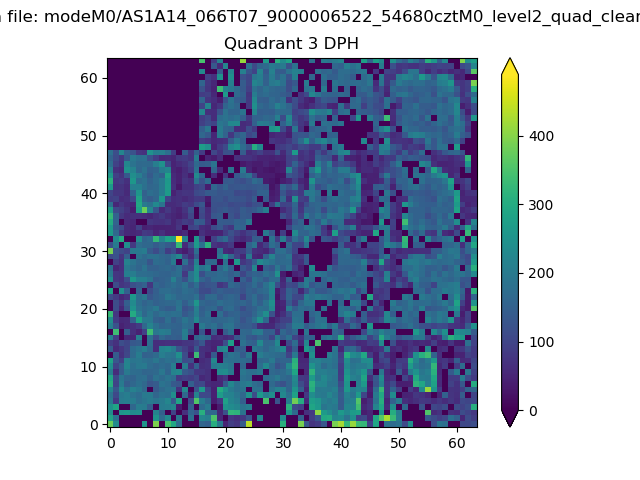 |
 |
Quadrant C |
| Plot type | Count rate plots | Images |
|---|---|---|
| Comparison with Poisson distribution Blue bars denote a histogram of data divided into 1 sec bins. Red curve is a Poisson curve with rate = median count rate of data. |
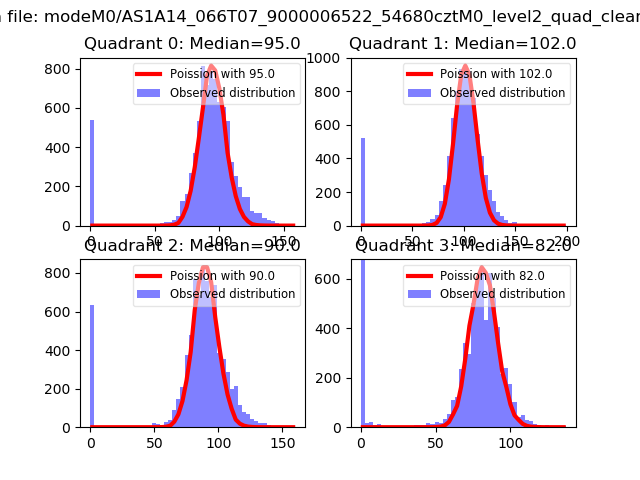 |
 |
| Quadrant-wise count rates Data is divided into 100 sec bins |
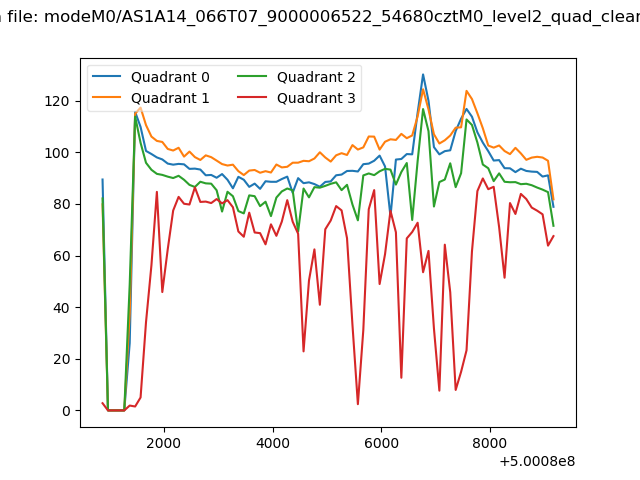 |
|
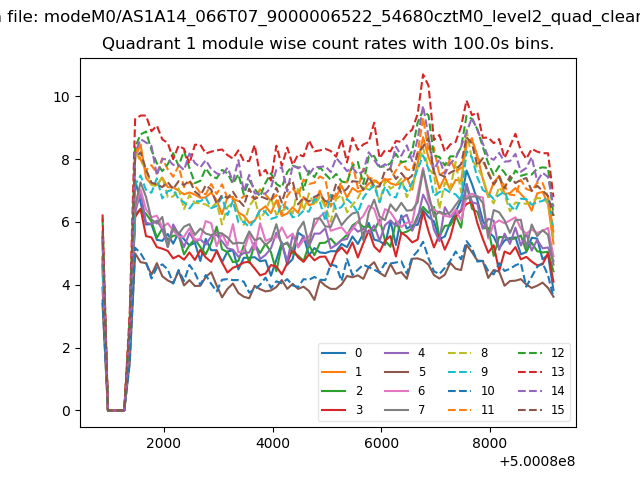
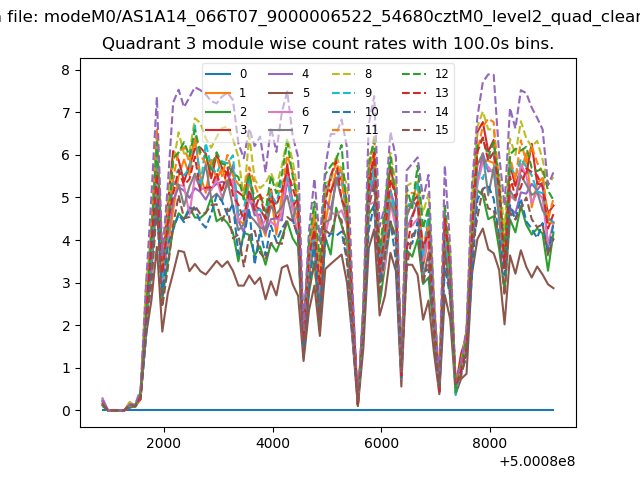
| Module-wise count rates for Quadrant A Data is divided into 100 sec bins |
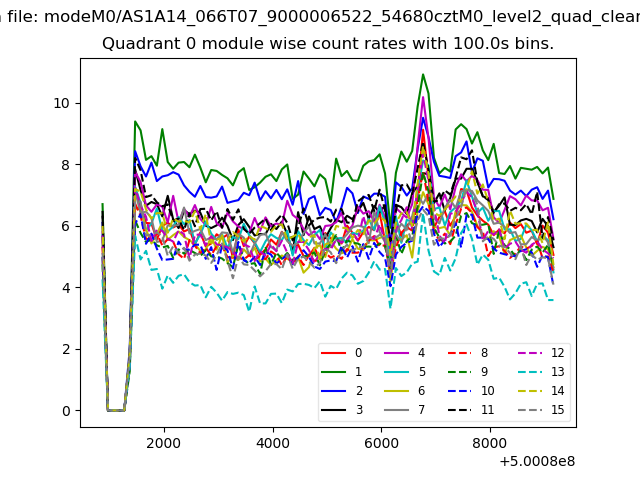 |
 |
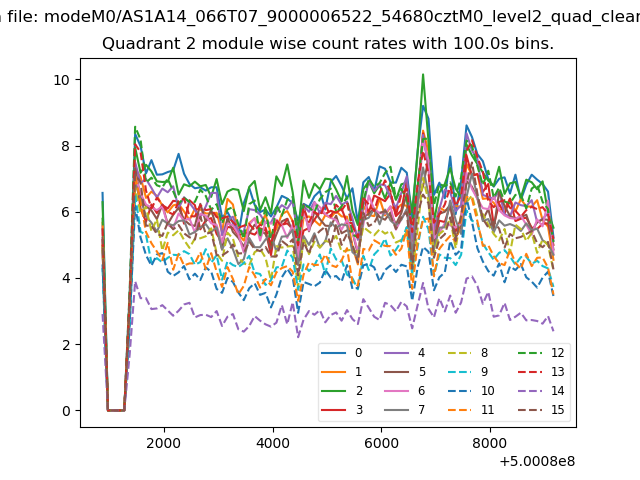
| Module-wise count rates for Quadrant B Data is divided into 100 sec bins |
 |
 |
| Module-wise count rates for Quadrant C Data is divided into 100 sec bins |
 |
 |
| Module-wise count rates for Quadrant D Data is divided into 100 sec bins |
 |
 |
| Parameter | Plot |
|---|---|
| CZT HV Monitor | 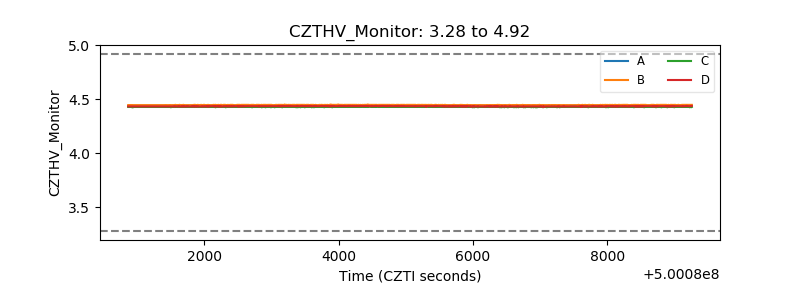 |
| D_VDD | 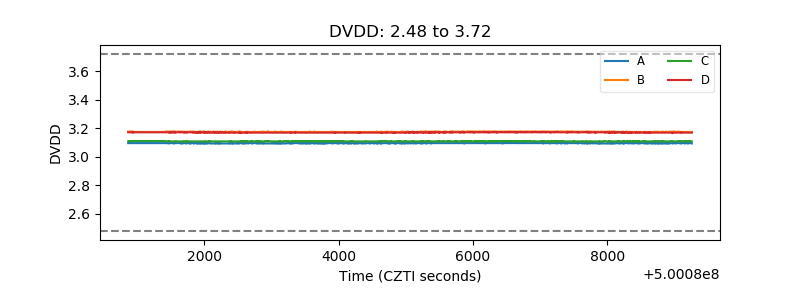 |
| Temperature 1 | 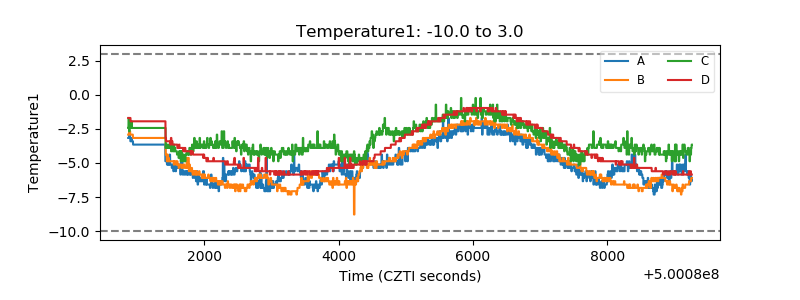 |
| Veto HV Monitor | 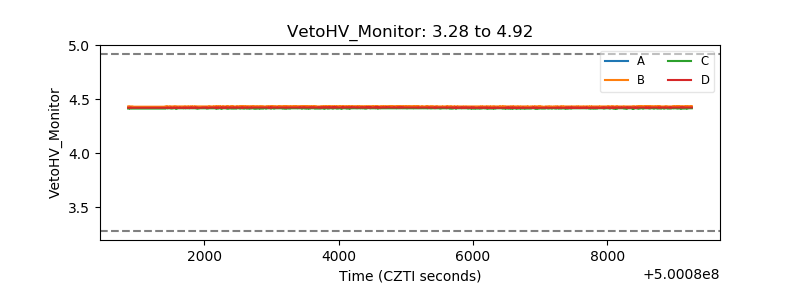 |
| Veto LLD | 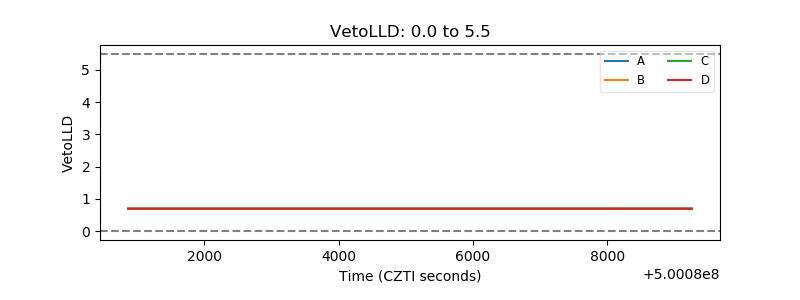 |
| Alpha Counter | 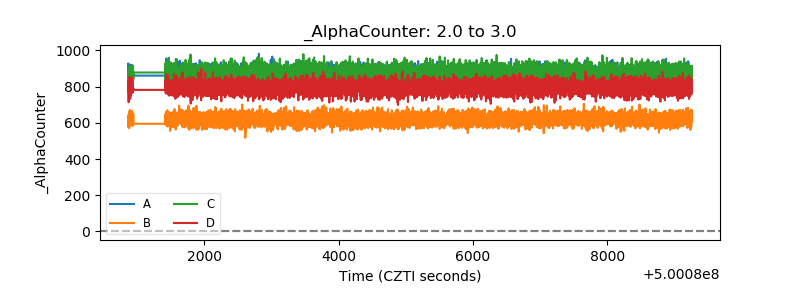 |
| _CPM_Rate | 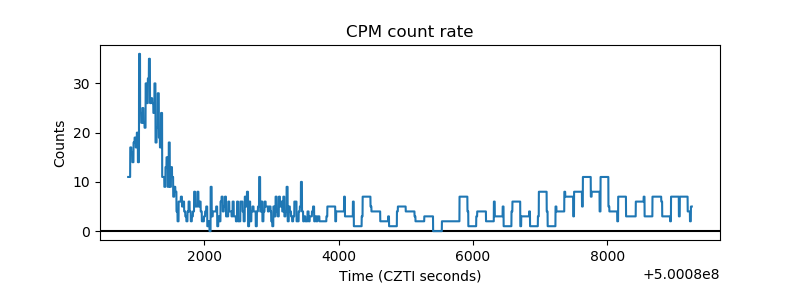 |
| CZT Counter | 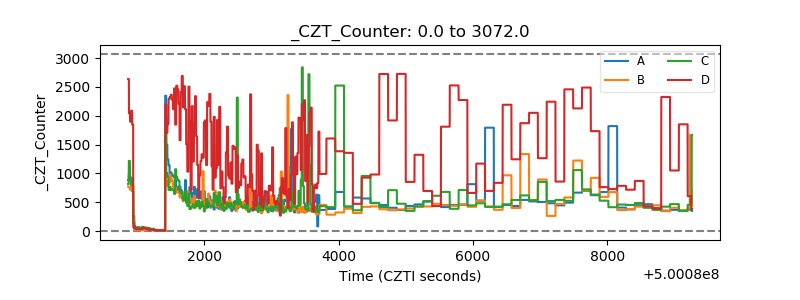 |
| +2.5 Volts monitor | 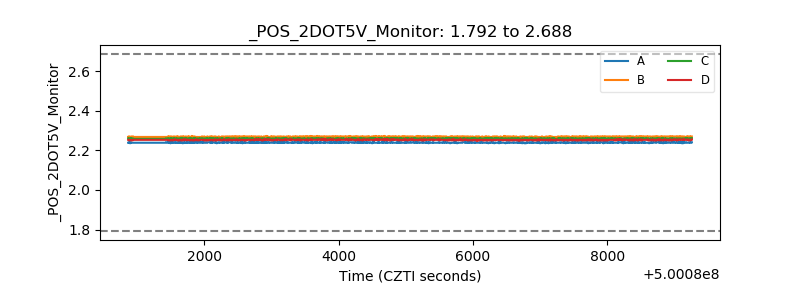 |
| +5 Volts monitor | 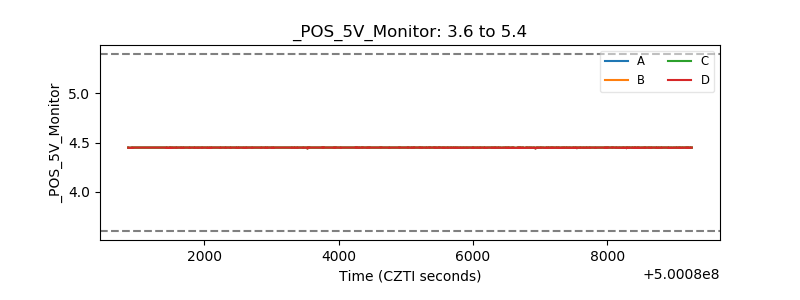 |
| _ROLL_ROT | 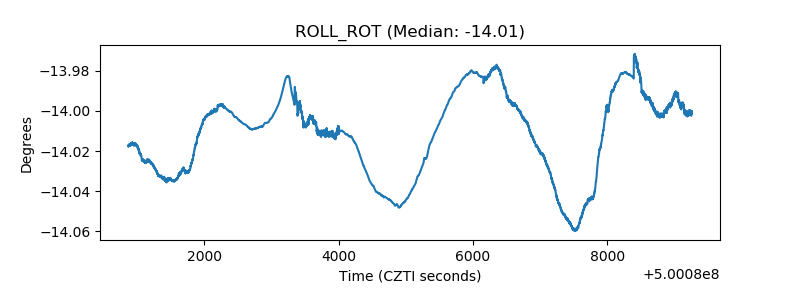 |
| _Roll_DEC | 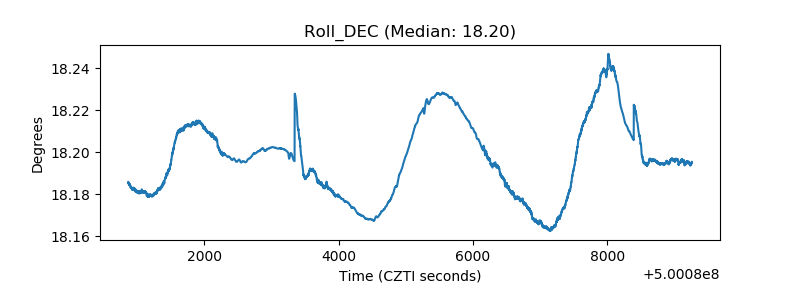 |
| _Roll_RA | 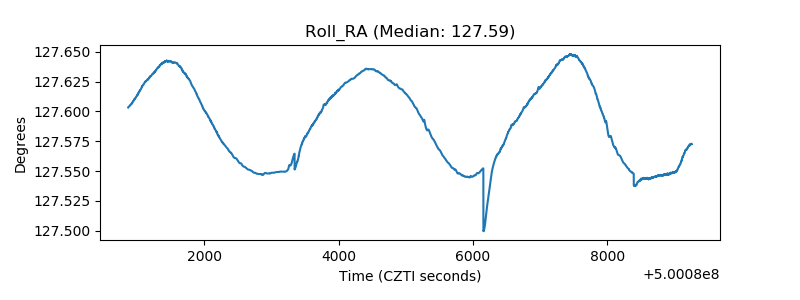 |
| Veto Counter | 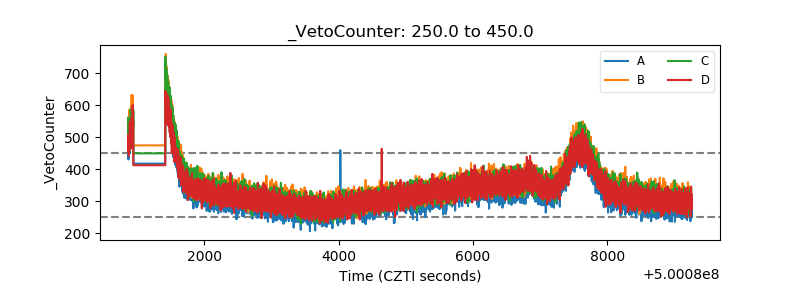 |