| Param | Original file | Final file |
|---|---|---|
| Filename | modeM0/AS1A14_066T07_9000006522_54681cztM0_level2.fits | modeM0/AS1A14_066T07_9000006522_54681cztM0_level2_quad_clean.evt |
| Size (bytes) | 726,266,880 | 116,104,320 |
| Size | 692.6 MB | 110.7 MB |
| Events in quadrant A | 3,966,901 | 816,820 |
| Events in quadrant B | 4,206,527 | 867,733 |
| Events in quadrant C | 5,355,965 | 742,857 |
| Events in quadrant D | 12,686,424 | 489,911 |
| Mode M0 | |||
|---|---|---|---|
| Quadrant | BADHDUFLAG | Total packets | Discarded packets |
| A | 0 | 18302 | 0 |
| B | 0 | 18946 | 0 |
| C | 0 | 22384 | 0 |
| D | 0 | 43712 | 0 |
| Mode SS | |||
|---|---|---|---|
| Quadrant | BADHDUFLAG | Total packets | Discarded packets |
| A | 0 | 172 | 0 |
| B | 0 | 172 | 0 |
| C | 0 | 172 | 0 |
| D | 0 | 172 | 0 |
| Quadrant | Total seconds | Saturated seconds | Saturation percentage |
|---|---|---|---|
| A | 8615 | 13 | 0.150900% |
| B | 8615 | 90 | 1.044689% |
| C | 8615 | 383 | 4.445734% |
| D | 8614 | 3004 | 34.873462% |
Noise dominated data is calculated using 1-second bins in cleaned event files. If a bin has >2000 counts, and if more than 50% of those come from <1% of pixels, then it is considered to be noise-dominated and hence unusable.
| Quadrant | # 1 sec bins | Bins with >0 counts | Bins with >2000 counts | High rate bins dominated by noise | Noise dominated (total time) | Noise dominated (detector-on time) | Marked lightcurve |
|---|---|---|---|---|---|---|---|
| A | 8615 | 8615 | 10 | 10 | 0.12% | 0.12% | 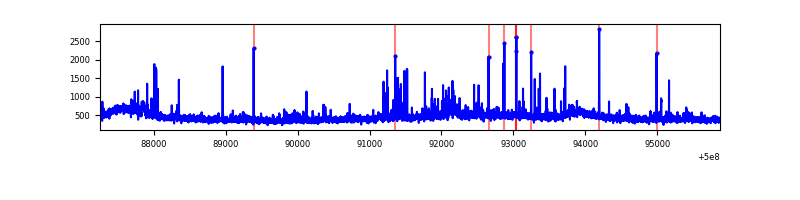 |
| B | 8615 | 8615 | 50 | 50 | 0.58% | 0.58% | 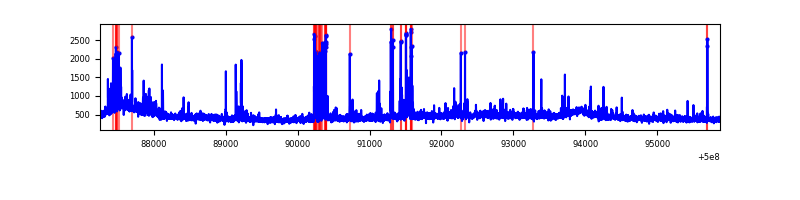 |
| C | 8615 | 8615 | 355 | 355 | 4.12% | 4.12% | 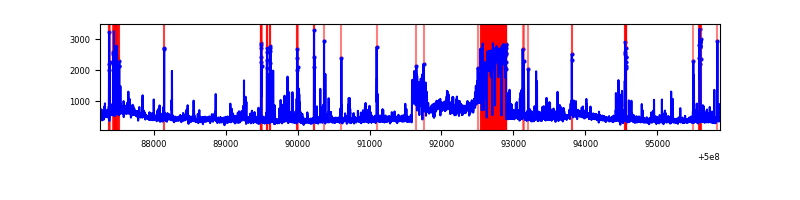 |
| D | 8614 | 8614 | 2718 | 2718 | 31.55% | 31.55% | 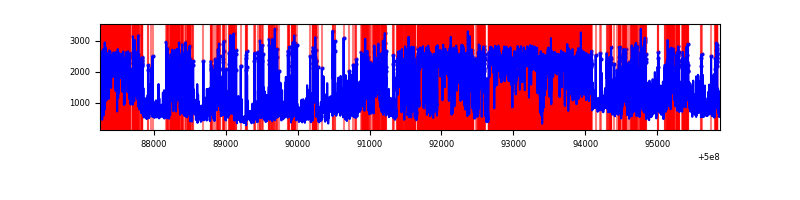 |
Top three noisy pixels from each quadrant. If the there are fewer than three noisy pixels in the level2.evt file, extra rows are filled as -1
| Pixel properties | Quadrant properties | ||||||
|---|---|---|---|---|---|---|---|
| Quadrant | DetID | PixID | Counts | Sigma | Mean | Median | Sigma |
| A | 11 | 3 | 197942 | 850.91 | 931 | 906 | 231.6 |
| A | 8 | 6 | 90865 | 388.49 | 931 | 906 | 231.6 |
| A | 0 | 8 | 23040 | 95.59 | 931 | 906 | 231.6 |
| B | 2 | 249 | 335147 | 1656.27 | 923 | 889 | 201.8 |
| B | 10 | 247 | 96956 | 476.02 | 923 | 889 | 201.8 |
| B | 0 | 213 | 92557 | 454.22 | 923 | 889 | 201.8 |
| C | 4 | 5 | 1090873 | 4480.77 | 887 | 880 | 243.3 |
| C | 14 | 254 | 176605 | 722.37 | 887 | 880 | 243.3 |
| C | 13 | 3 | 174518 | 713.8 | 887 | 880 | 243.3 |
| D | 11 | 129 | 6887303 | 34007.78 | 704 | 673 | 202.5 |
| D | 11 | 176 | 942732 | 4652.11 | 704 | 673 | 202.5 |
| D | 2 | 62 | 663862 | 3274.98 | 704 | 673 | 202.5 |
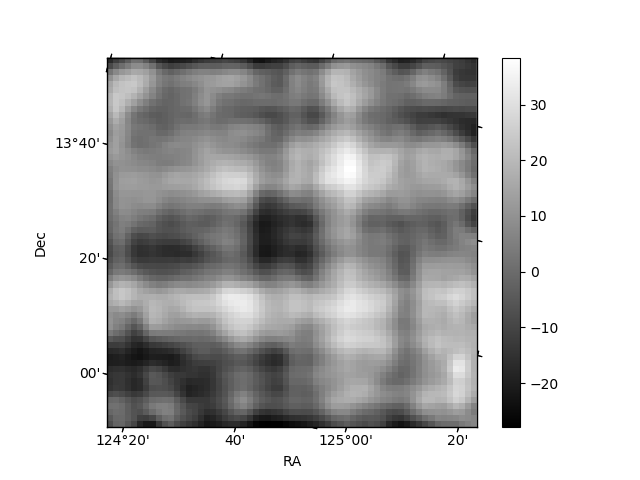
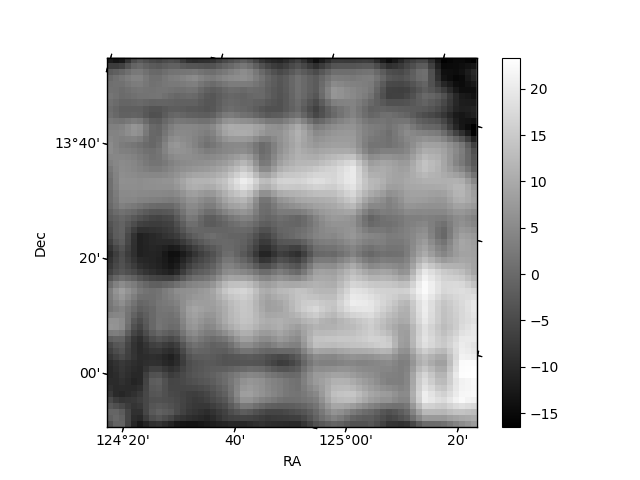
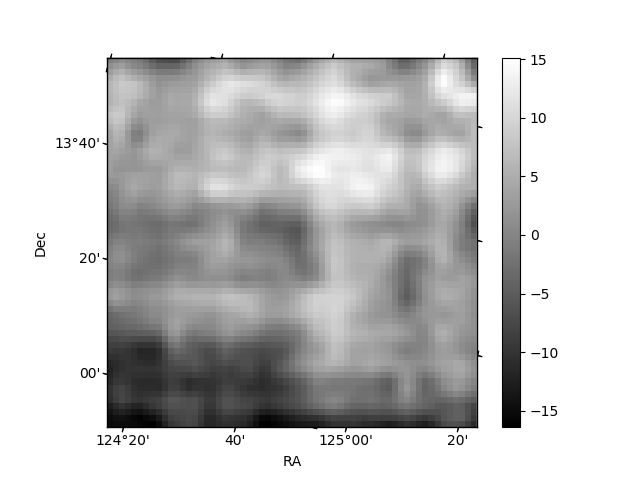
Histogram calculated using DETX and DETY for each event in the final _common_clean file
| Quadrant A | 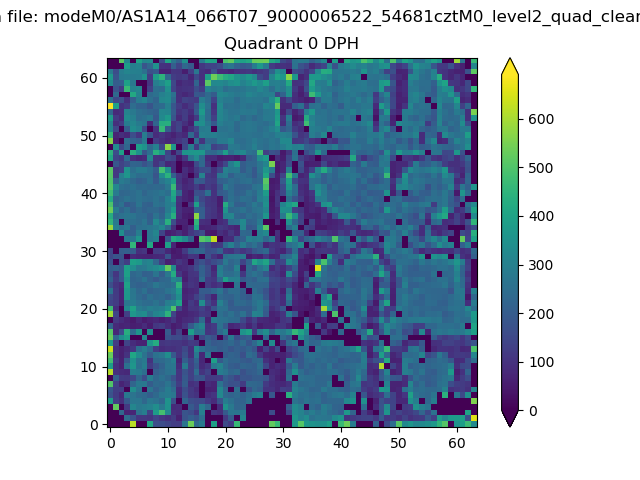 |
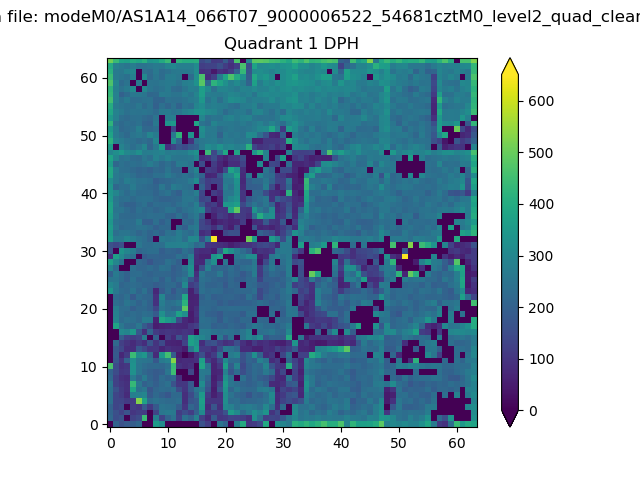 |
Quadrant B |
|---|---|---|---|
| Quadrant D | 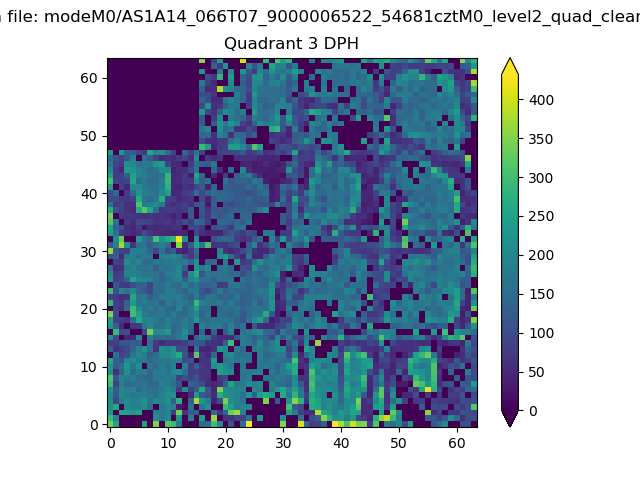 |
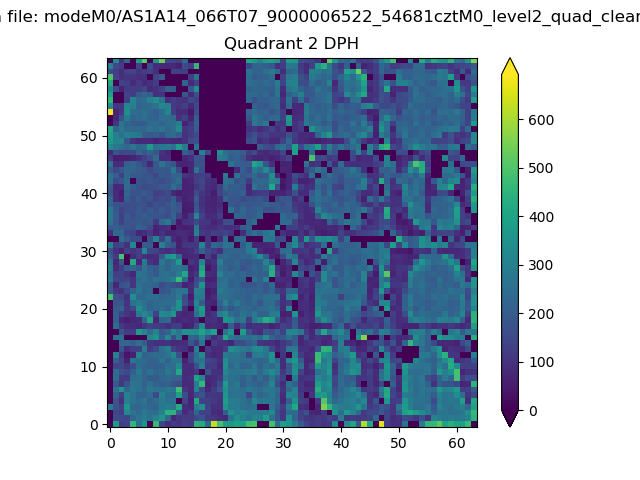 |
Quadrant C |
| Plot type | Count rate plots | Images |
|---|---|---|
| Comparison with Poisson distribution Blue bars denote a histogram of data divided into 1 sec bins. Red curve is a Poisson curve with rate = median count rate of data. |
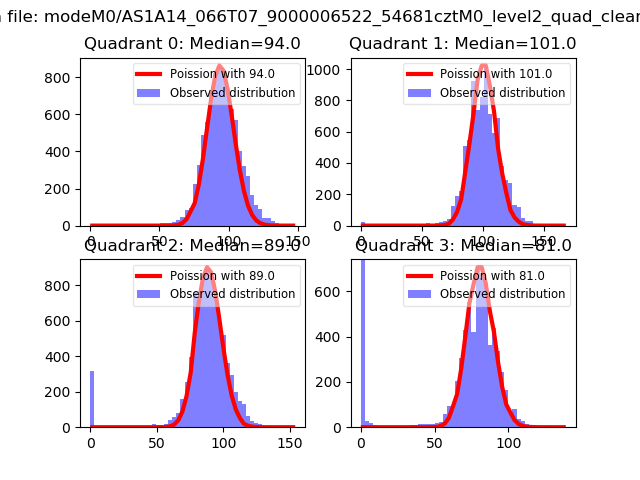 |
 |
| Quadrant-wise count rates Data is divided into 100 sec bins |
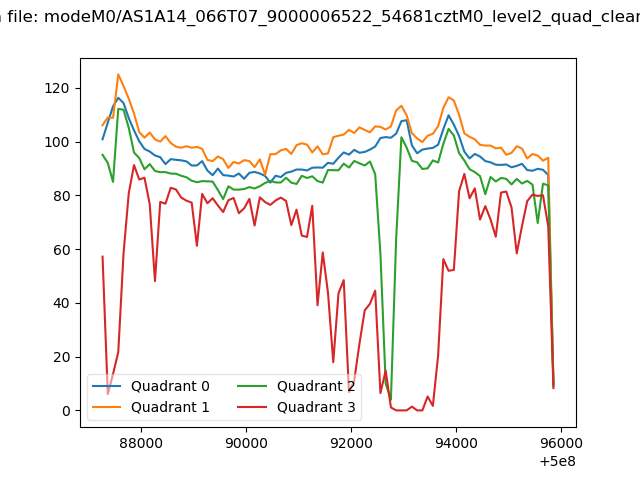 |
|
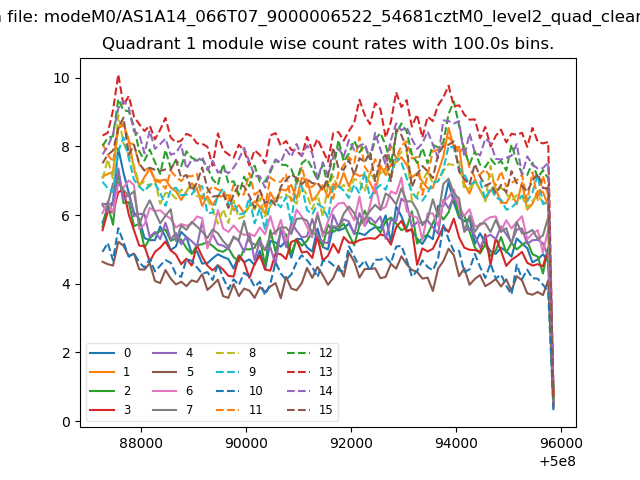
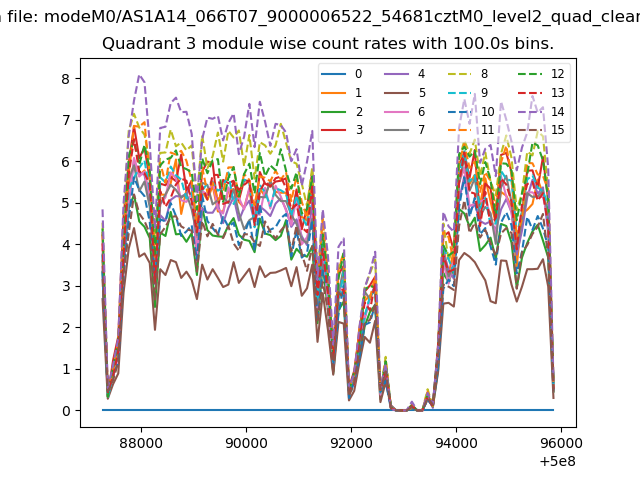
| Module-wise count rates for Quadrant A Data is divided into 100 sec bins |
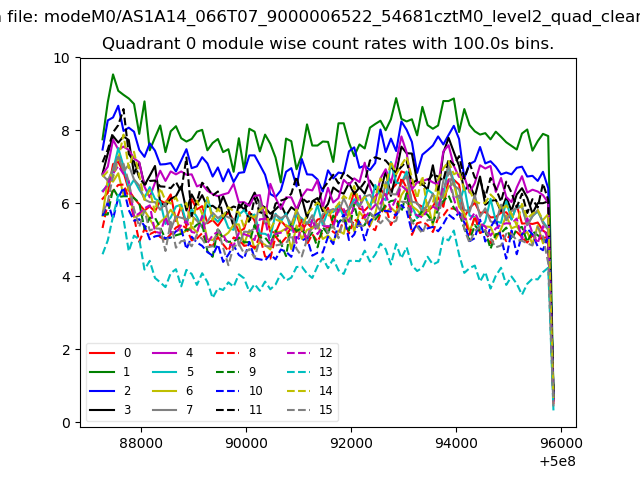 |
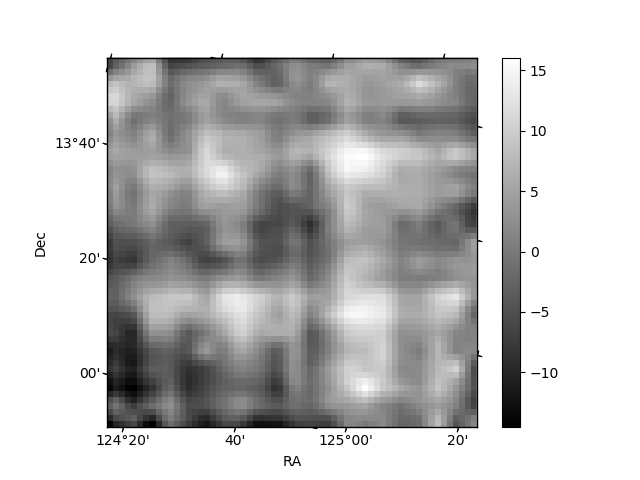 |
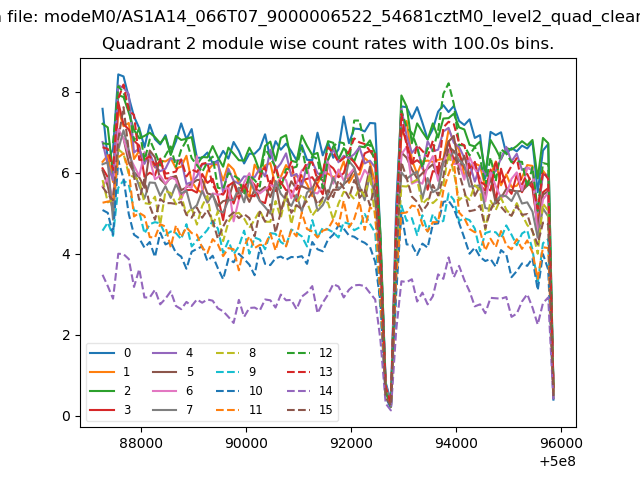
| Module-wise count rates for Quadrant B Data is divided into 100 sec bins |
 |
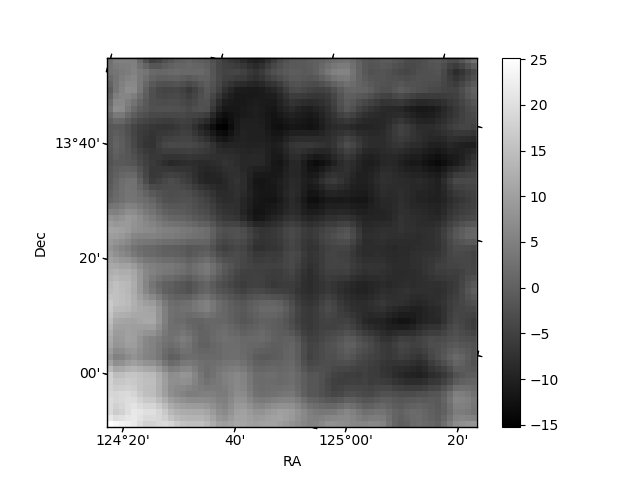 |
| Module-wise count rates for Quadrant C Data is divided into 100 sec bins |
 |
 |
| Module-wise count rates for Quadrant D Data is divided into 100 sec bins |
 |
 |
| Parameter | Plot |
|---|---|
| CZT HV Monitor | 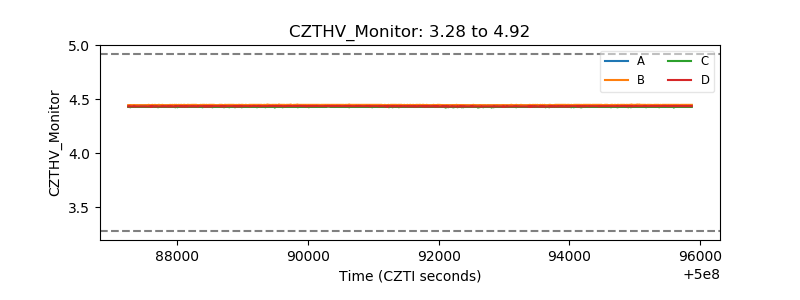 |
| D_VDD | 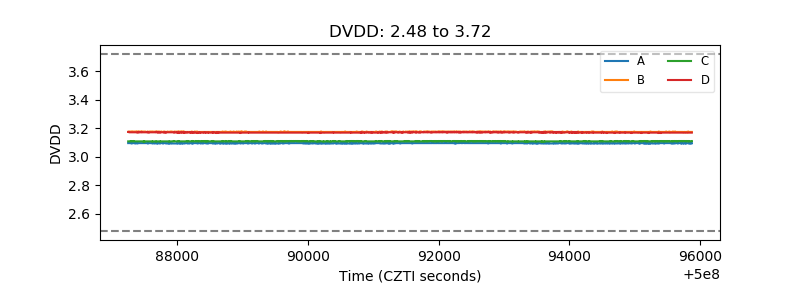 |
| Temperature 1 | 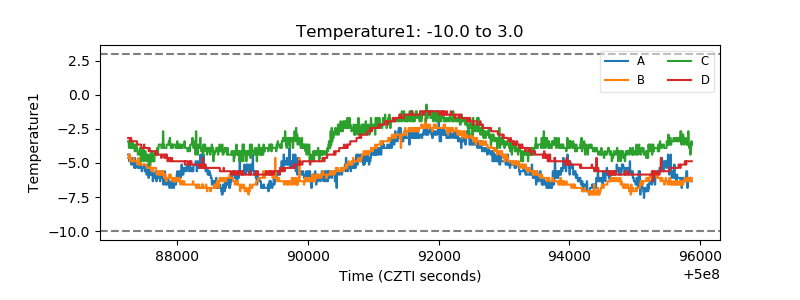 |
| Veto HV Monitor | 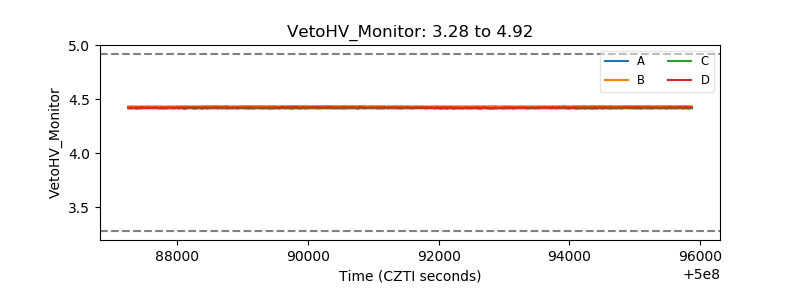 |
| Veto LLD | 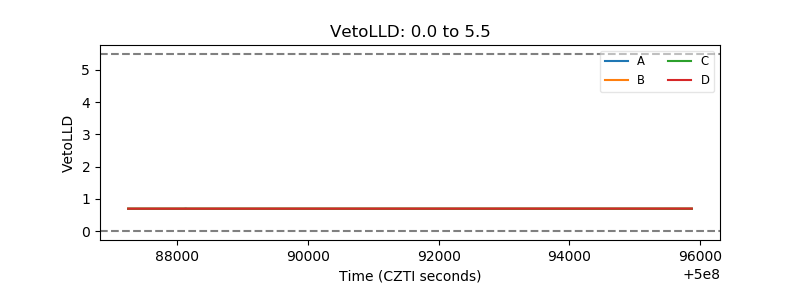 |
| Alpha Counter | 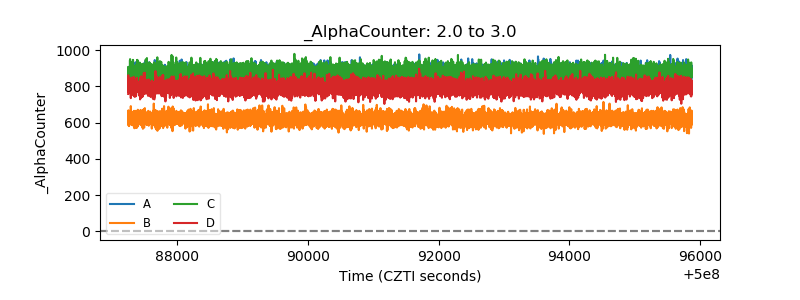 |
| _CPM_Rate | 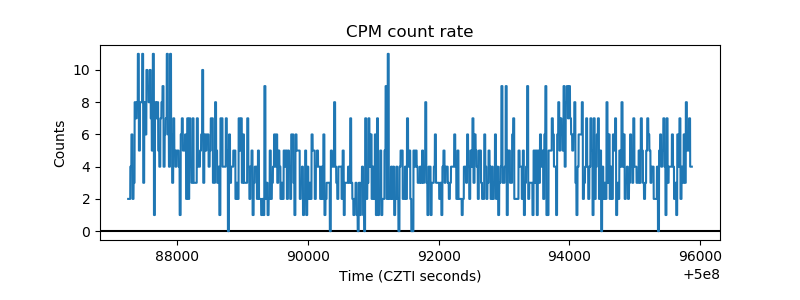 |
| CZT Counter | 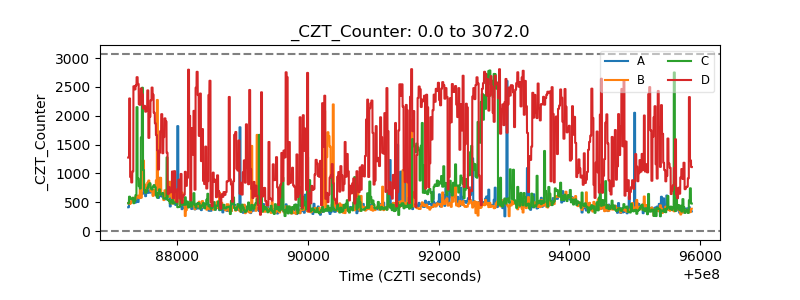 |
| +2.5 Volts monitor | 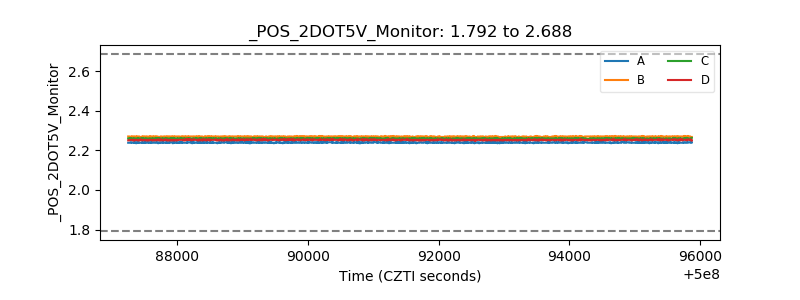 |
| +5 Volts monitor | 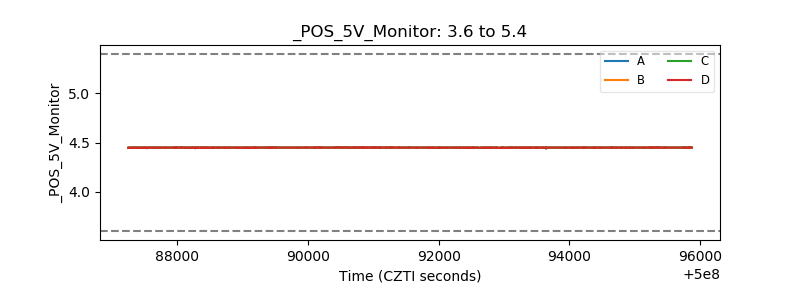 |
| _ROLL_ROT | 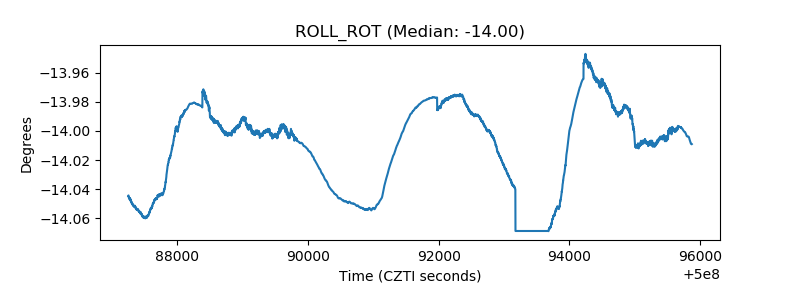 |
| _Roll_DEC | 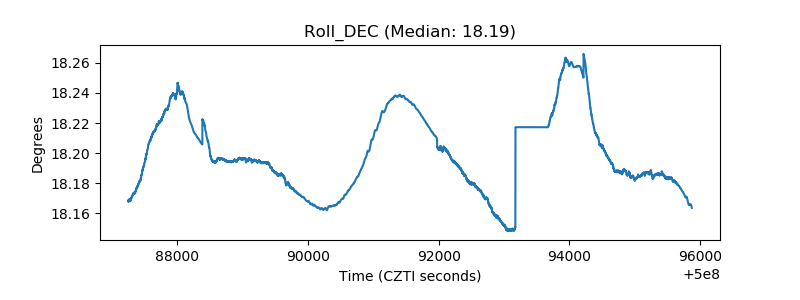 |
| _Roll_RA | 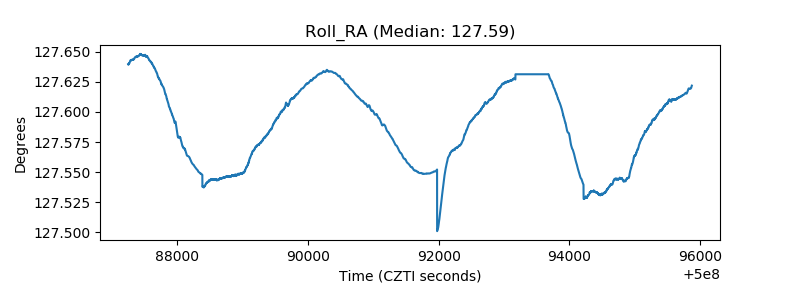 |
| Veto Counter | 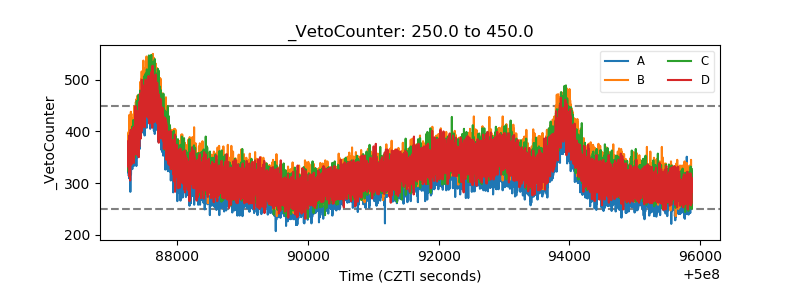 |