| Param | Original file | Final file |
|---|---|---|
| Filename | modeM0/AS1A14_066T07_9000006522_54684cztM0_level2.fits | modeM0/AS1A14_066T07_9000006522_54684cztM0_level2_quad_clean.evt |
| Size (bytes) | 888,543,360 | 142,329,600 |
| Size | 847.4 MB | 135.7 MB |
| Events in quadrant A | 5,029,873 | 969,181 |
| Events in quadrant B | 4,973,210 | 1,041,275 |
| Events in quadrant C | 6,970,507 | 884,330 |
| Events in quadrant D | 15,102,366 | 685,024 |
| Mode M0 | |||
|---|---|---|---|
| Quadrant | BADHDUFLAG | Total packets | Discarded packets |
| A | 0 | 22748 | 0 |
| B | 0 | 22763 | 0 |
| C | 0 | 28414 | 1 |
| D | 0 | 52295 | 0 |
| Mode SS | |||
|---|---|---|---|
| Quadrant | BADHDUFLAG | Total packets | Discarded packets |
| A | 0 | 212 | 0 |
| B | 0 | 212 | 0 |
| C | 0 | 212 | 0 |
| D | 0 | 212 | 0 |
| Quadrant | Total seconds | Saturated seconds | Saturation percentage |
|---|---|---|---|
| A | 10527 | 102 | 0.968937% |
| B | 10527 | 109 | 1.035433% |
| C | 10527 | 580 | 5.509642% |
| D | 10527 | 2639 | 25.068871% |
Noise dominated data is calculated using 1-second bins in cleaned event files. If a bin has >2000 counts, and if more than 50% of those come from <1% of pixels, then it is considered to be noise-dominated and hence unusable.
| Quadrant | # 1 sec bins | Bins with >0 counts | Bins with >2000 counts | High rate bins dominated by noise | Noise dominated (total time) | Noise dominated (detector-on time) | Marked lightcurve |
|---|---|---|---|---|---|---|---|
| A | 10527 | 10527 | 87 | 87 | 0.83% | 0.83% | 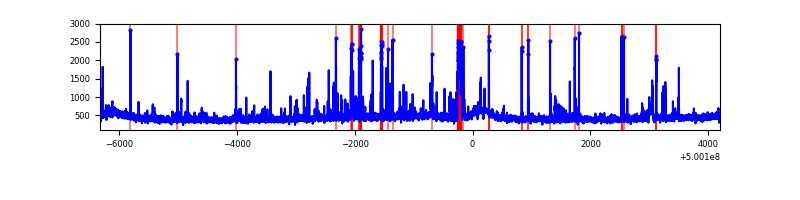 |
| B | 10527 | 10527 | 63 | 63 | 0.60% | 0.60% | 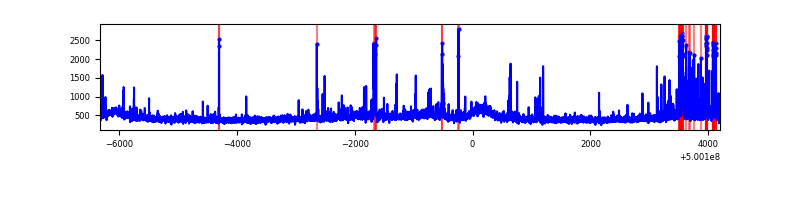 |
| C | 10527 | 10527 | 577 | 577 | 5.48% | 5.48% | 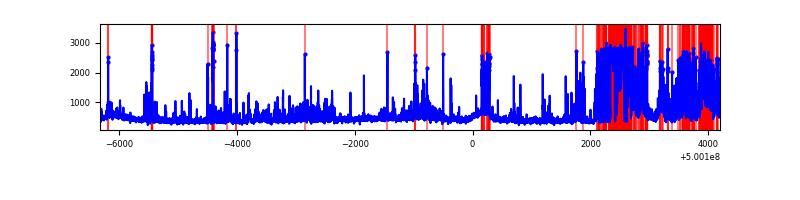 |
| D | 10527 | 10527 | 2619 | 2619 | 24.88% | 24.88% | 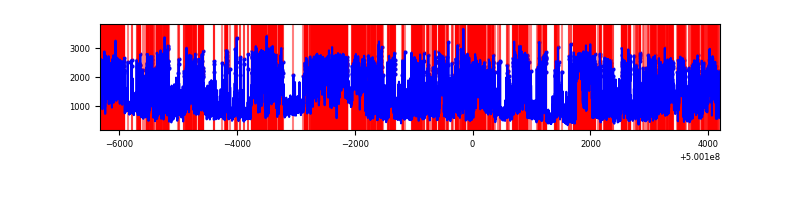 |
Top three noisy pixels from each quadrant. If the there are fewer than three noisy pixels in the level2.evt file, extra rows are filled as -1
| Pixel properties | Quadrant properties | ||||||
|---|---|---|---|---|---|---|---|
| Quadrant | DetID | PixID | Counts | Sigma | Mean | Median | Sigma |
| A | 11 | 3 | 180689 | 659.87 | 1106 | 1078 | 272.2 |
| A | 0 | 8 | 153380 | 559.54 | 1106 | 1078 | 272.2 |
| A | 7 | 14 | 150940 | 550.57 | 1106 | 1078 | 272.2 |
| B | 2 | 249 | 395075 | 1660.0 | 1097 | 1056 | 237.4 |
| B | 10 | 247 | 107155 | 446.99 | 1097 | 1056 | 237.4 |
| B | 0 | 213 | 93826 | 390.84 | 1097 | 1056 | 237.4 |
| C | 15 | 157 | 2262672 | 7837.86 | 1051 | 1041 | 288.6 |
| C | 14 | 254 | 205806 | 709.63 | 1051 | 1041 | 288.6 |
| C | 12 | 252 | 101029 | 346.52 | 1051 | 1041 | 288.6 |
| D | 11 | 129 | 5445597 | 19675.66 | 961 | 919 | 276.7 |
| D | 2 | 172 | 1873235 | 6766.07 | 961 | 919 | 276.7 |
| D | 11 | 176 | 1561019 | 5637.8 | 961 | 919 | 276.7 |
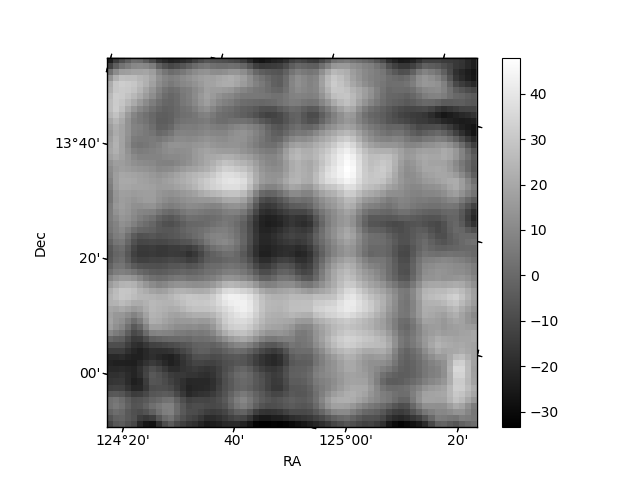
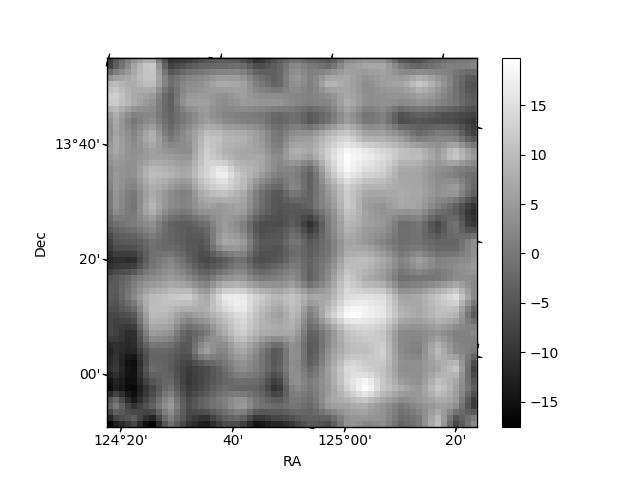
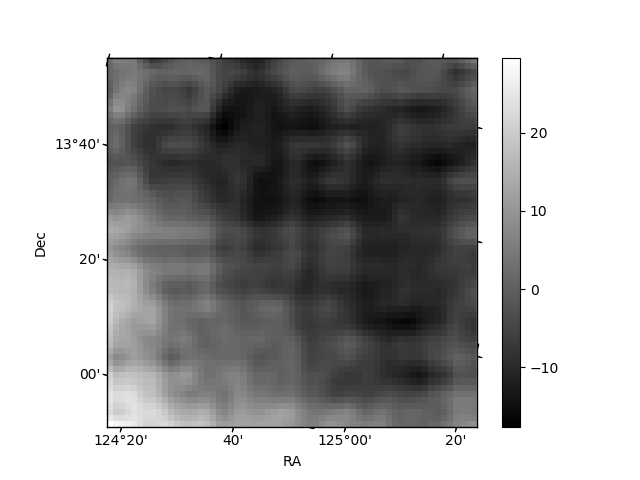
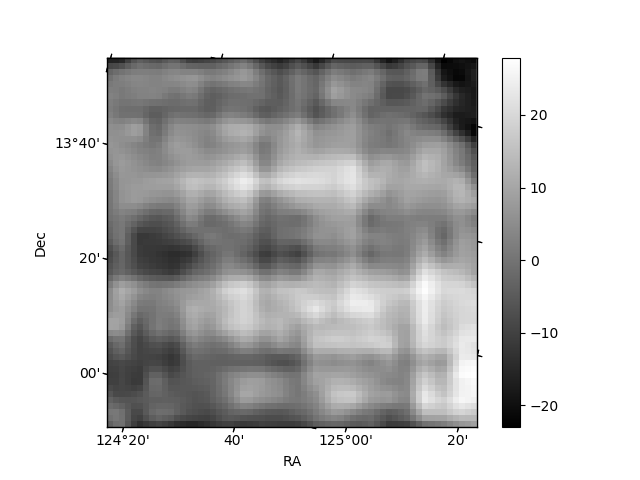
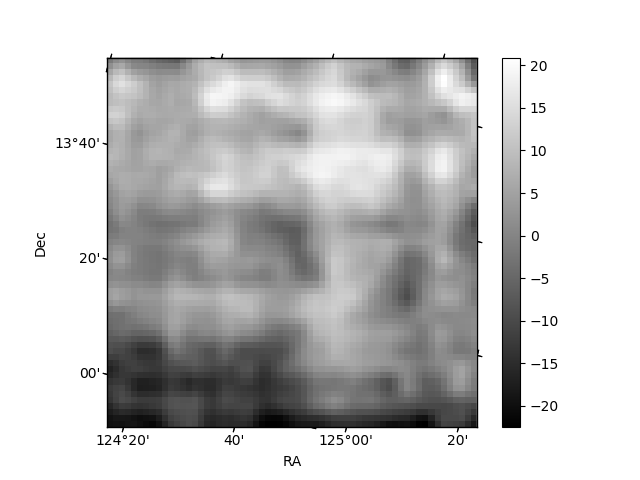
Histogram calculated using DETX and DETY for each event in the final _common_clean file
| Quadrant A | 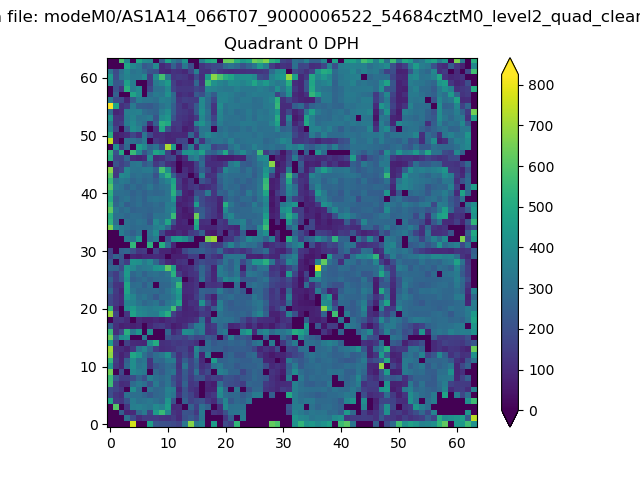 |
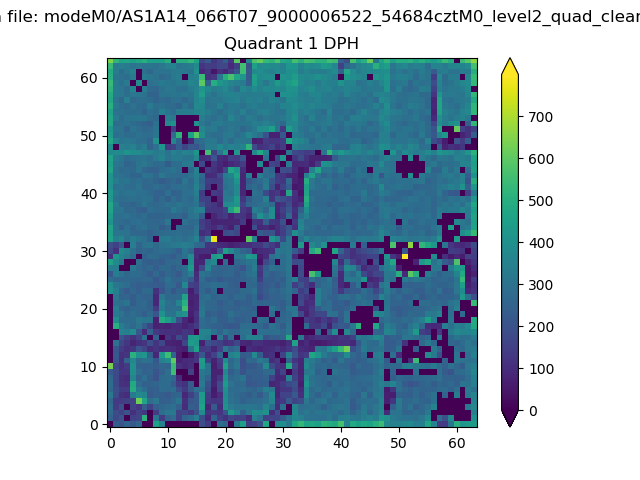 |
Quadrant B |
|---|---|---|---|
| Quadrant D | 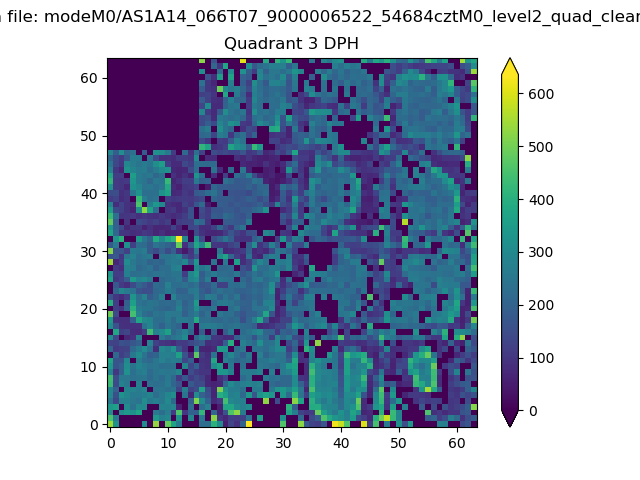 |
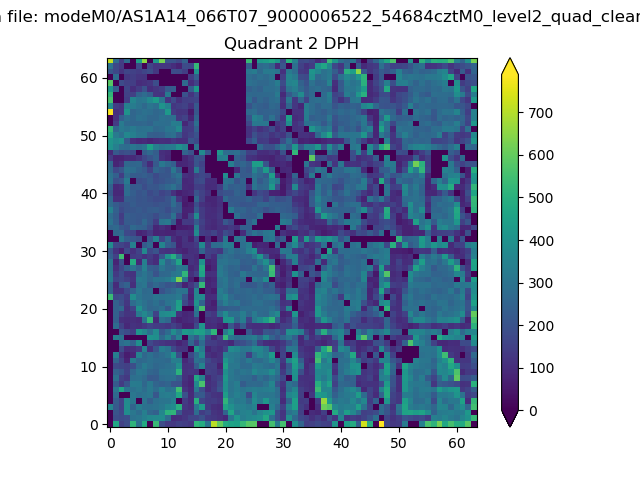 |
Quadrant C |
| Plot type | Count rate plots | Images |
|---|---|---|
| Comparison with Poisson distribution Blue bars denote a histogram of data divided into 1 sec bins. Red curve is a Poisson curve with rate = median count rate of data. |
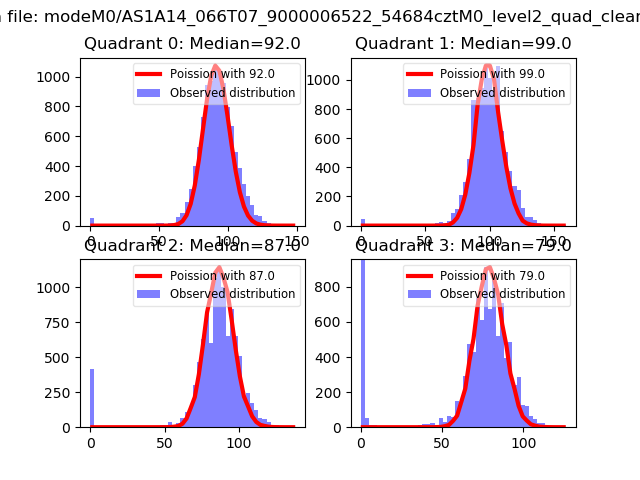 |
 |
| Quadrant-wise count rates Data is divided into 100 sec bins |
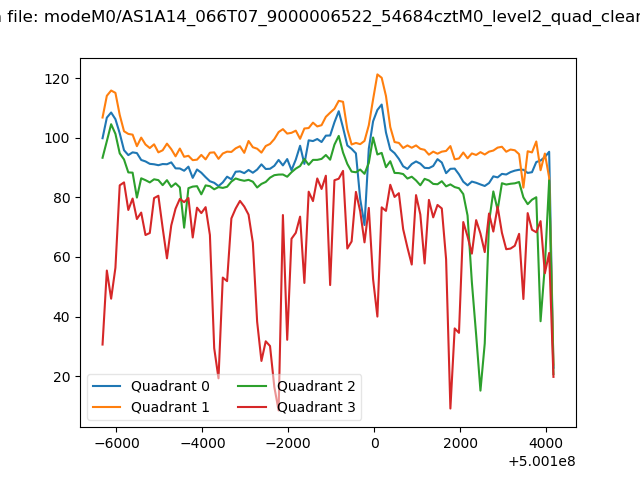 |
|
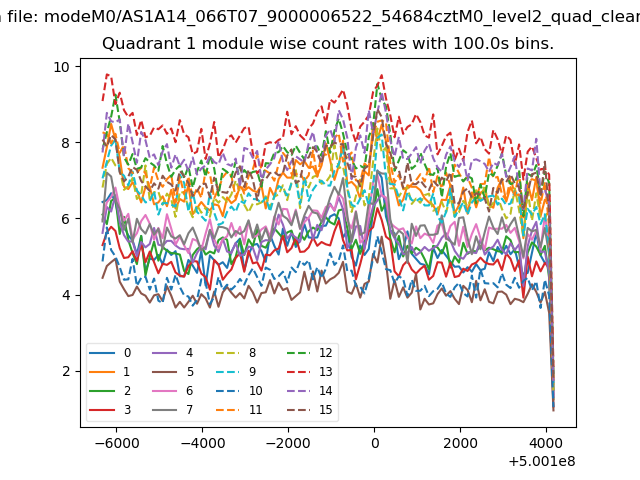
| Module-wise count rates for Quadrant A Data is divided into 100 sec bins |
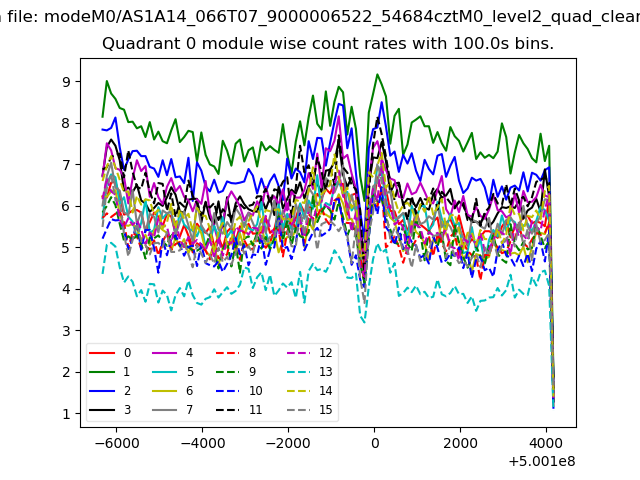 |
 |
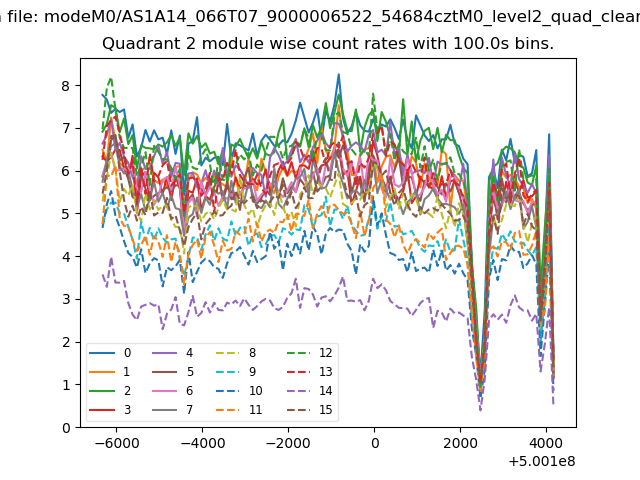
| Module-wise count rates for Quadrant B Data is divided into 100 sec bins |
 |
 |
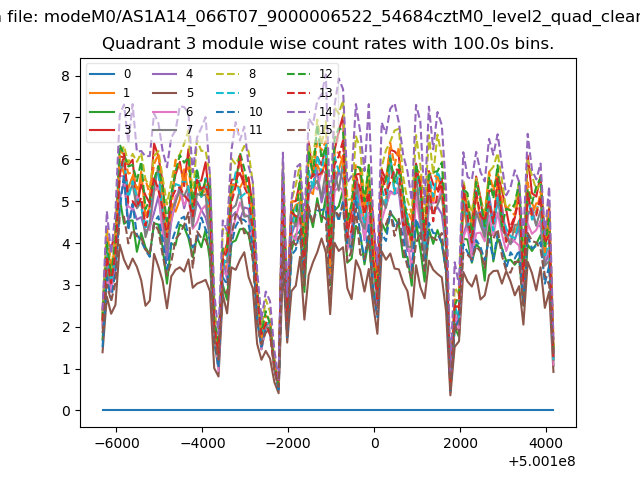
| Module-wise count rates for Quadrant C Data is divided into 100 sec bins |
 |
 |
| Module-wise count rates for Quadrant D Data is divided into 100 sec bins |
 |
 |
| Parameter | Plot |
|---|---|
| CZT HV Monitor |  |
| D_VDD | 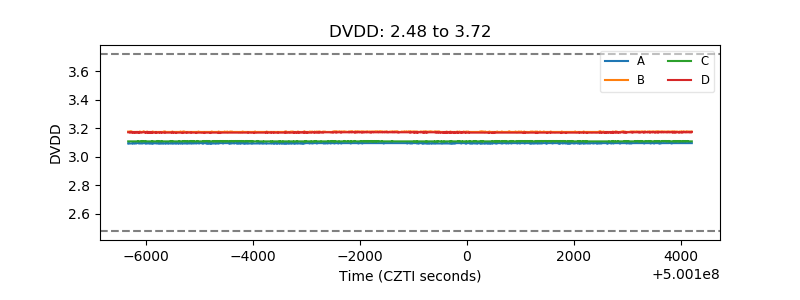 |
| Temperature 1 | 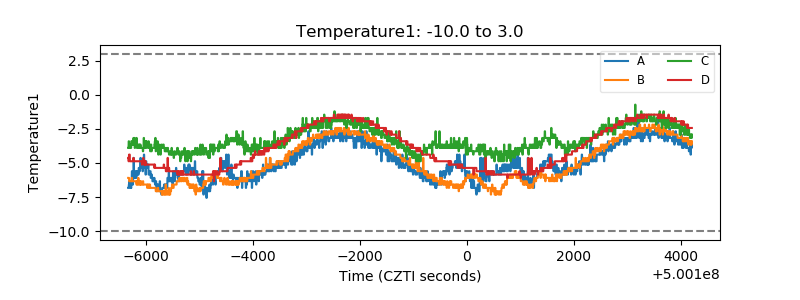 |
| Veto HV Monitor | 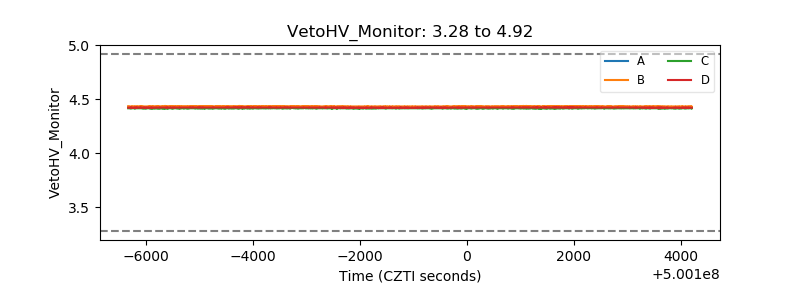 |
| Veto LLD | 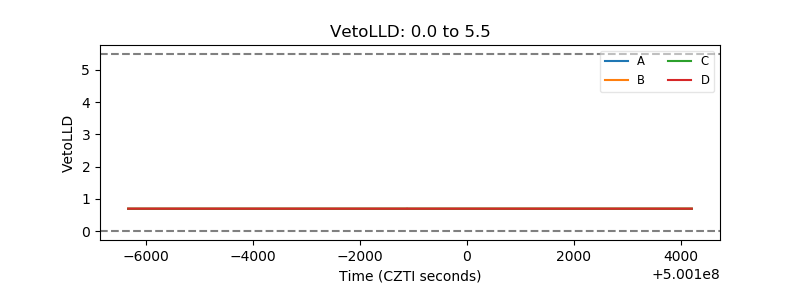 |
| Alpha Counter | 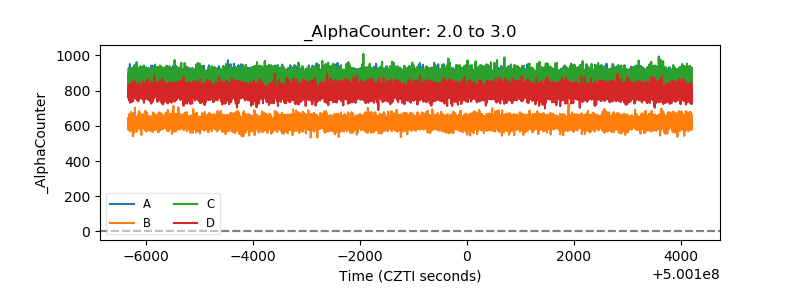 |
| _CPM_Rate | 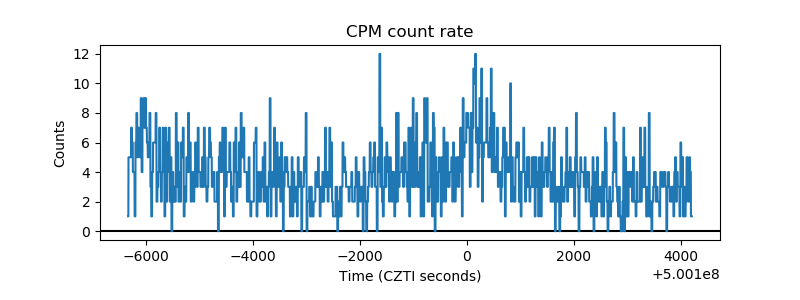 |
| CZT Counter | 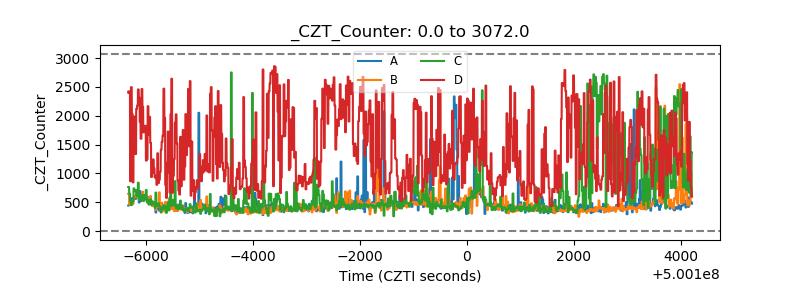 |
| +2.5 Volts monitor | 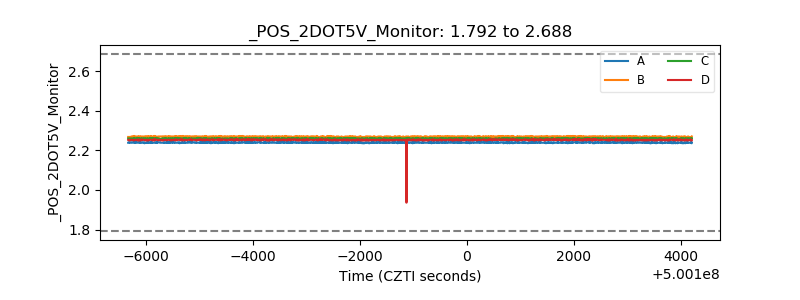 |
| +5 Volts monitor | 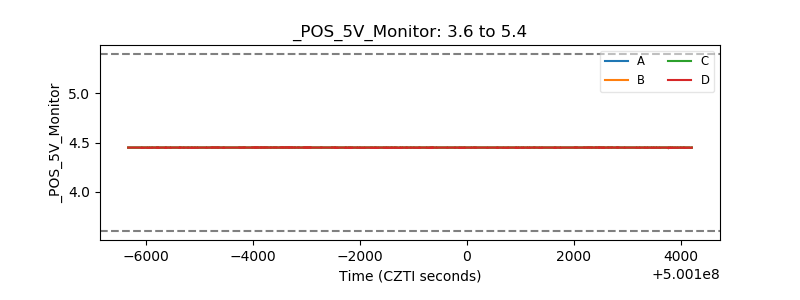 |
| _ROLL_ROT | 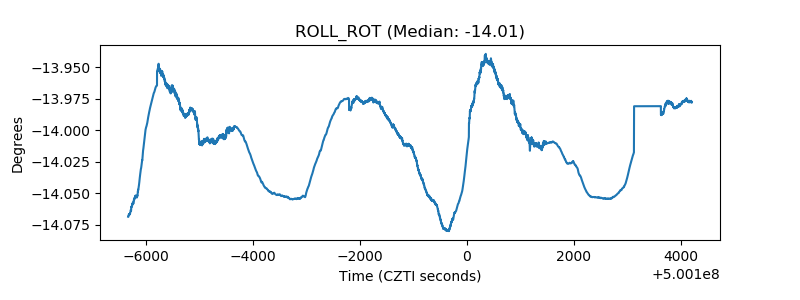 |
| _Roll_DEC | 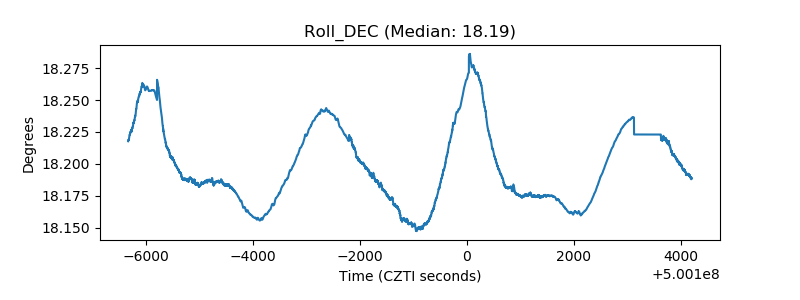 |
| _Roll_RA | 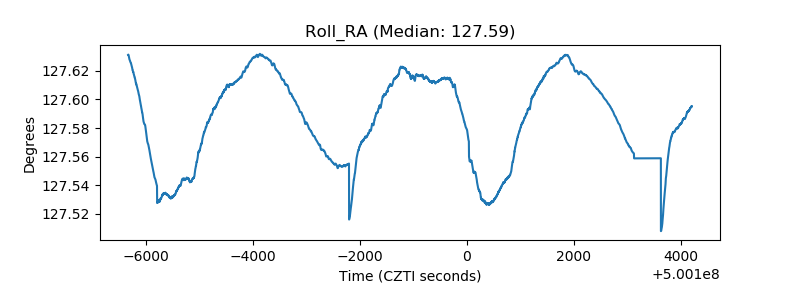 |
| Veto Counter | 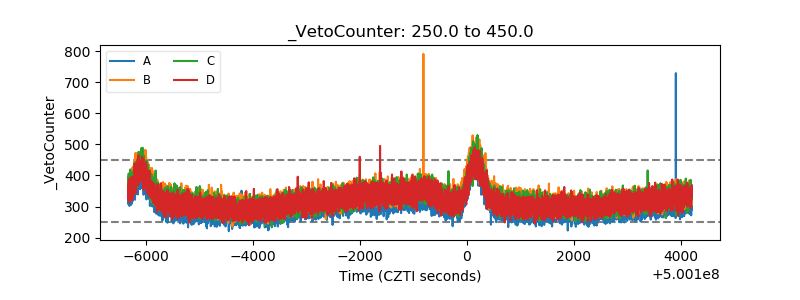 |