| Param | Original file | Final file |
|---|---|---|
| Filename | modeM0/AS1A14_066T07_9000006522_54685cztM0_level2.fits | modeM0/AS1A14_066T07_9000006522_54685cztM0_level2_quad_clean.evt |
| Size (bytes) | 1,507,982,400 | 204,480,000 |
| Size | 1.4 GB | 195.0 MB |
| Events in quadrant A | 8,526,273 | 1,435,996 |
| Events in quadrant B | 8,472,650 | 1,543,800 |
| Events in quadrant C | 11,263,266 | 1,318,146 |
| Events in quadrant D | 26,336,670 | 802,294 |
| Mode M9 | |||
|---|---|---|---|
| Quadrant | BADHDUFLAG | Total packets | Discarded packets |
| A | 0 | 12 | 0 |
| B | 0 | 12 | 0 |
| C | 0 | 12 | 0 |
| D | 0 | 12 | 0 |
| Mode M0 | |||
|---|---|---|---|
| Quadrant | BADHDUFLAG | Total packets | Discarded packets |
| A | 0 | 36631 | 4 |
| B | 0 | 36603 | 4 |
| C | 0 | 44985 | 4 |
| D | 0 | 89221 | 4 |
| Mode SS | |||
|---|---|---|---|
| Quadrant | BADHDUFLAG | Total packets | Discarded packets |
| A | 0 | 320 | 0 |
| B | 0 | 320 | 0 |
| C | 0 | 320 | 0 |
| D | 0 | 320 | 0 |
| Quadrant | Total seconds | Saturated seconds | Saturation percentage |
|---|---|---|---|
| A | 15799 | 620 | 3.924299% |
| B | 15800 | 621 | 3.930380% |
| C | 15800 | 1222 | 7.734177% |
| D | 15800 | 6638 | 42.012658% |
Noise dominated data is calculated using 1-second bins in cleaned event files. If a bin has >2000 counts, and if more than 50% of those come from <1% of pixels, then it is considered to be noise-dominated and hence unusable.
| Quadrant | # 1 sec bins | Bins with >0 counts | Bins with >2000 counts | High rate bins dominated by noise | Noise dominated (total time) | Noise dominated (detector-on time) | Marked lightcurve |
|---|---|---|---|---|---|---|---|
| A | 16984 | 15800 | 313 | 313 | 1.84% | 1.98% | 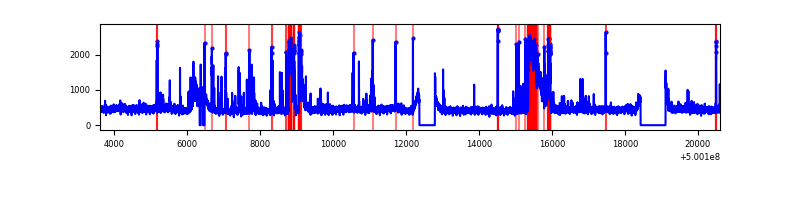 |
| B | 16985 | 15801 | 193 | 193 | 1.14% | 1.22% | 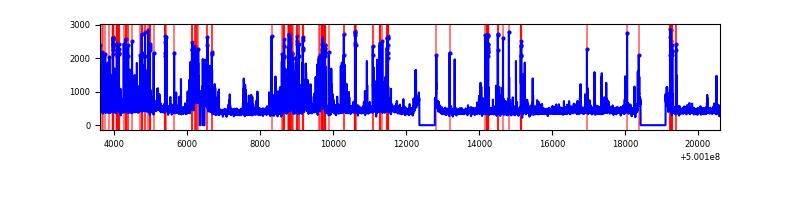 |
| C | 16985 | 15802 | 958 | 958 | 5.64% | 6.06% | 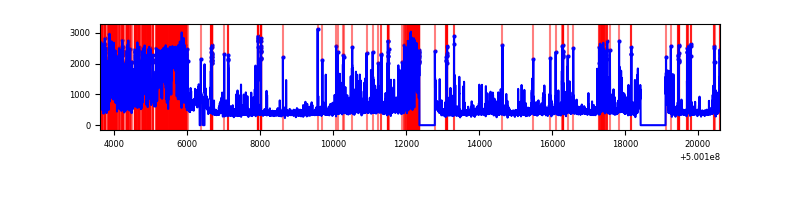 |
| D | 16985 | 15801 | 6334 | 6334 | 37.29% | 40.09% | 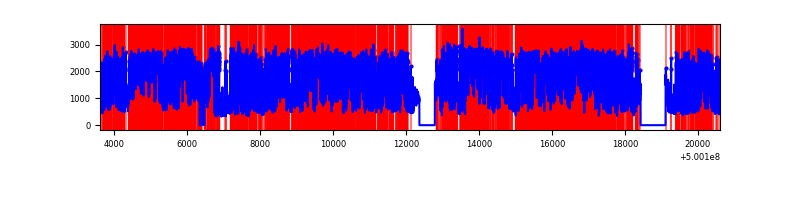 |
Top three noisy pixels from each quadrant. If the there are fewer than three noisy pixels in the level2.evt file, extra rows are filled as -1
| Pixel properties | Quadrant properties | ||||||
|---|---|---|---|---|---|---|---|
| Quadrant | DetID | PixID | Counts | Sigma | Mean | Median | Sigma |
| A | 7 | 14 | 1252297 | 2971.46 | 1723 | 1679 | 420.9 |
| A | 3 | 14 | 177142 | 416.9 | 1723 | 1679 | 420.9 |
| A | 11 | 3 | 150857 | 354.45 | 1723 | 1679 | 420.9 |
| B | 2 | 249 | 1259408 | 3458.95 | 1692 | 1628 | 363.6 |
| B | 10 | 247 | 179576 | 489.36 | 1692 | 1628 | 363.6 |
| B | 0 | 213 | 111827 | 303.05 | 1692 | 1628 | 363.6 |
| C | 15 | 157 | 3347612 | 7468.3 | 1635 | 1619 | 448.0 |
| C | 6 | 223 | 541797 | 1205.68 | 1635 | 1619 | 448.0 |
| C | 12 | 252 | 231953 | 514.11 | 1635 | 1619 | 448.0 |
| D | 11 | 129 | 12099455 | 30586.77 | 1382 | 1318 | 395.5 |
| D | 11 | 176 | 3535683 | 8935.66 | 1382 | 1318 | 395.5 |
| D | 2 | 62 | 1959710 | 4951.25 | 1382 | 1318 | 395.5 |
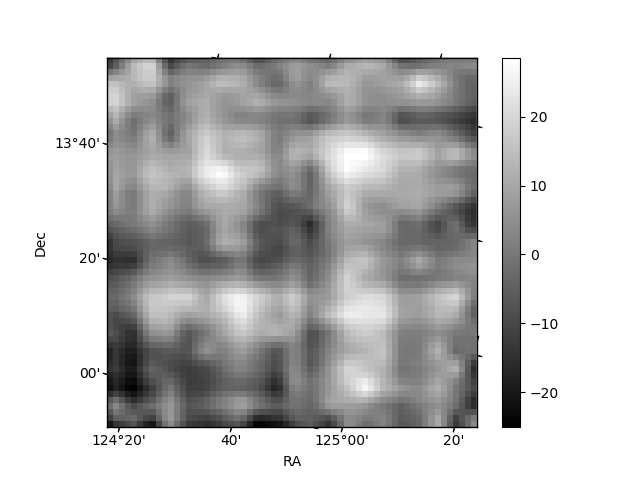
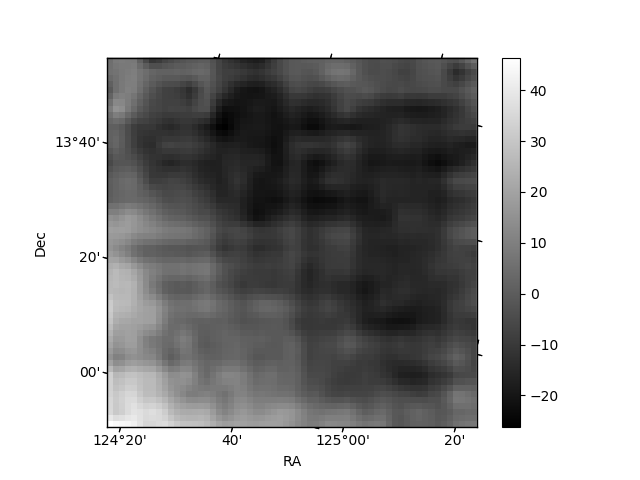
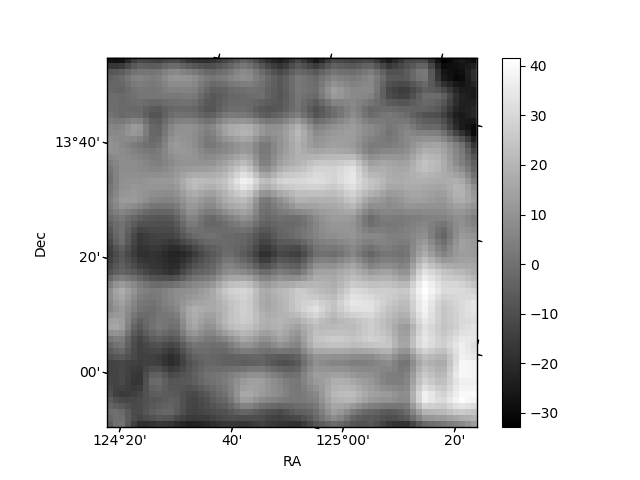
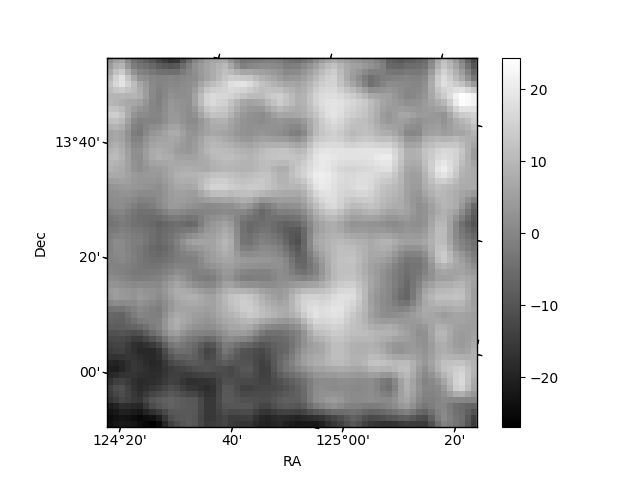
Histogram calculated using DETX and DETY for each event in the final _common_clean file
| Quadrant A | 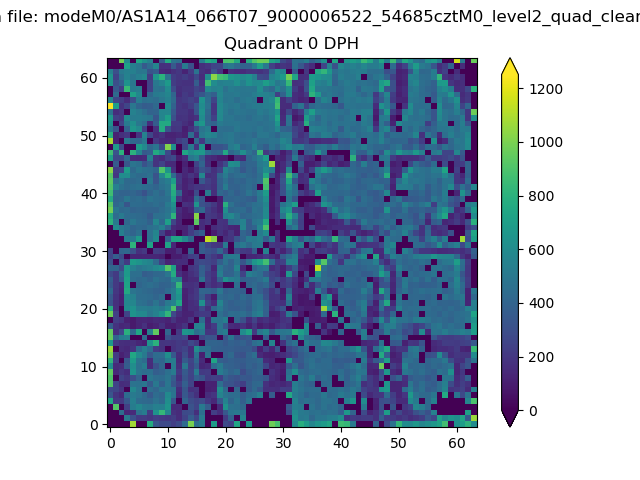 |
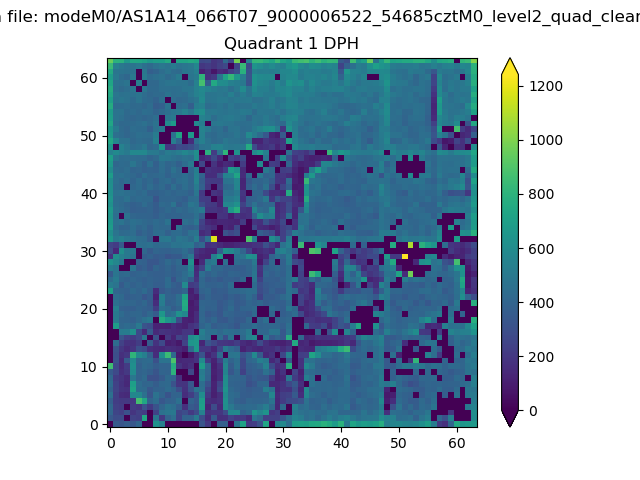 |
Quadrant B |
|---|---|---|---|
| Quadrant D | 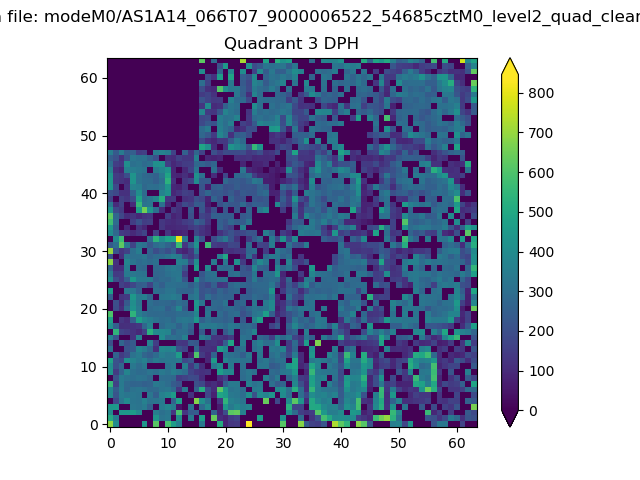 |
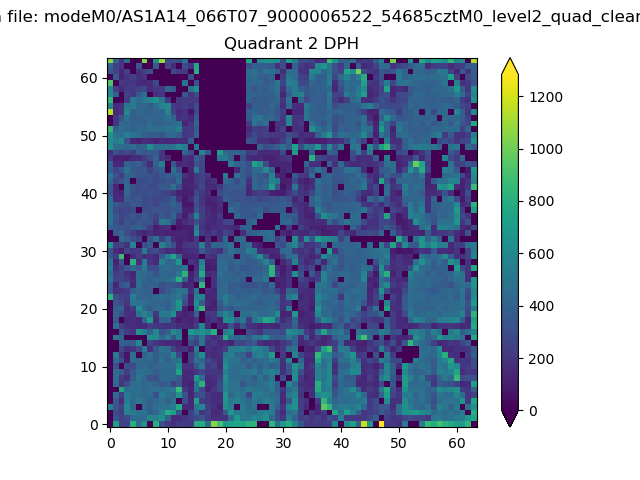 |
Quadrant C |
| Plot type | Count rate plots | Images |
|---|---|---|
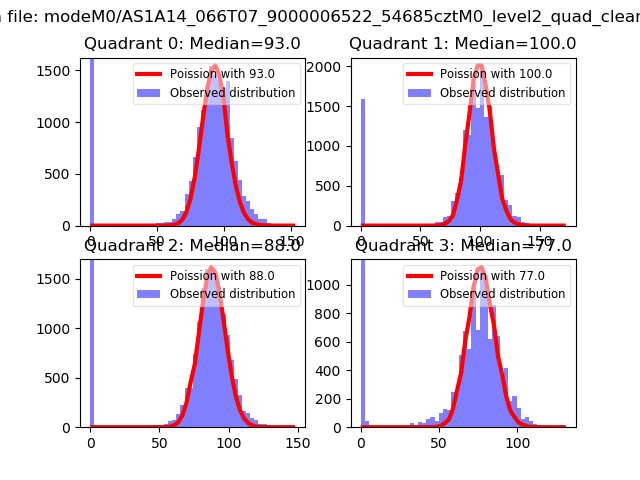
| Comparison with Poisson distribution Blue bars denote a histogram of data divided into 1 sec bins. Red curve is a Poisson curve with rate = median count rate of data. |
 |
 |
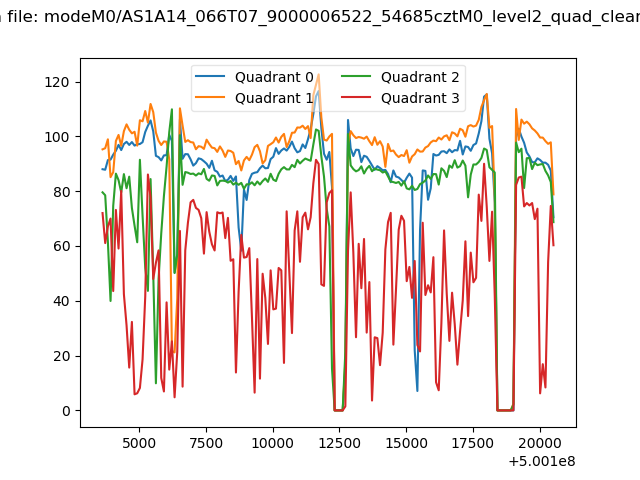
| Quadrant-wise count rates Data is divided into 100 sec bins |
 |
|
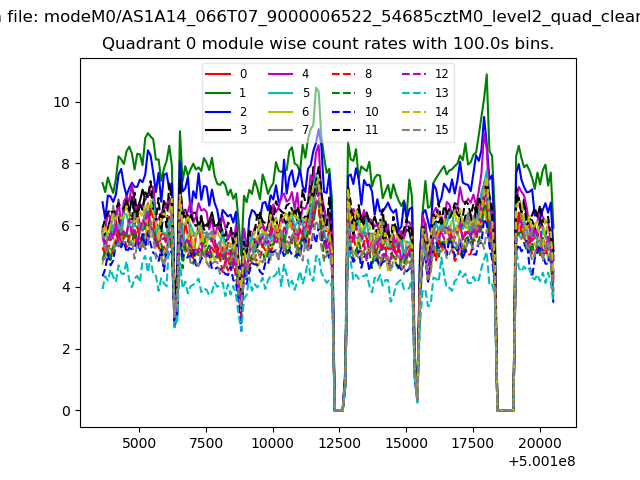
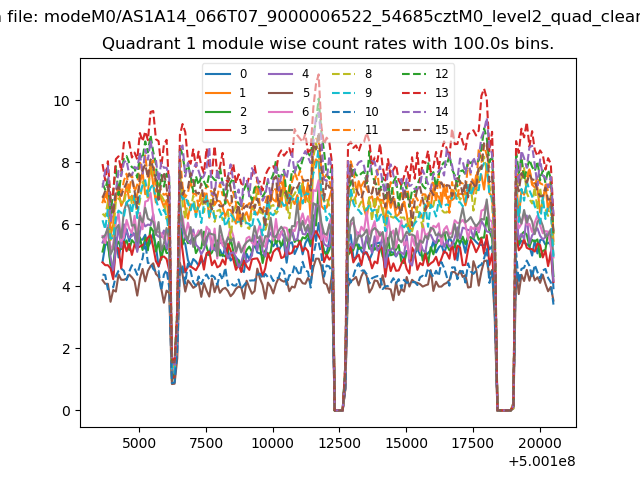
| Module-wise count rates for Quadrant A Data is divided into 100 sec bins |
 |
 |
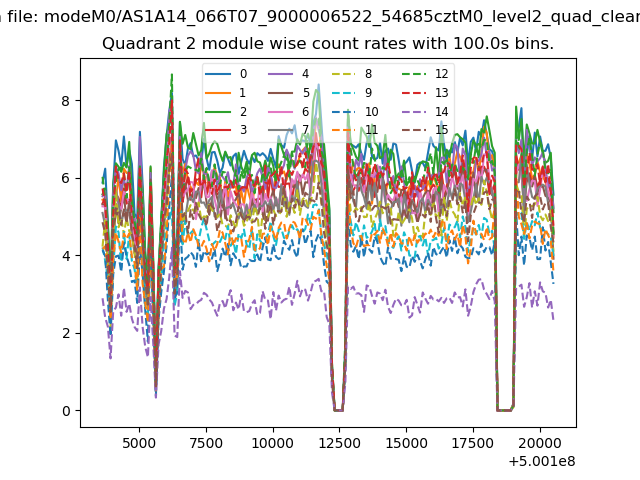
| Module-wise count rates for Quadrant B Data is divided into 100 sec bins |
 |
 |
| Module-wise count rates for Quadrant C Data is divided into 100 sec bins |
 |
 |
| Module-wise count rates for Quadrant D Data is divided into 100 sec bins |
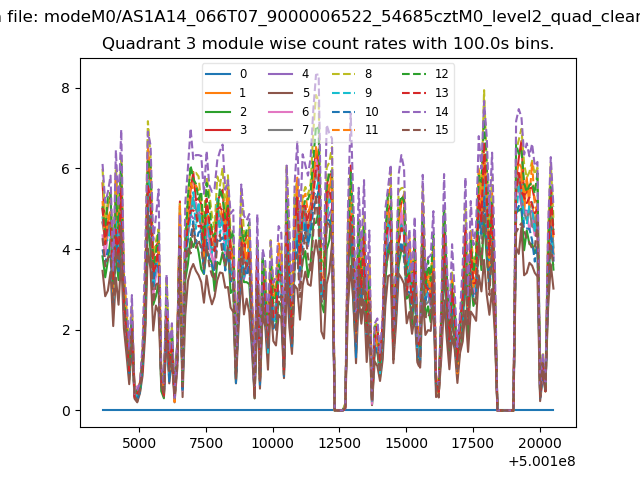 |
 |
| Parameter | Plot |
|---|---|
| CZT HV Monitor | 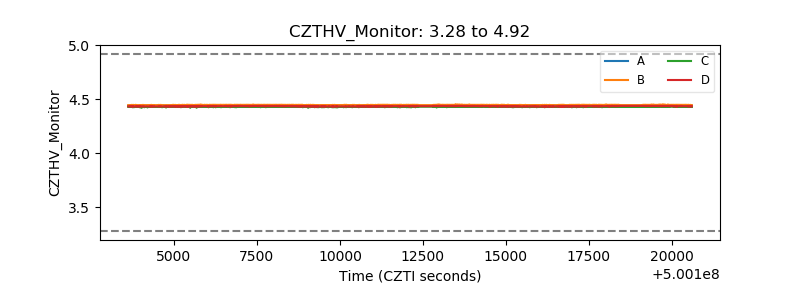 |
| D_VDD | 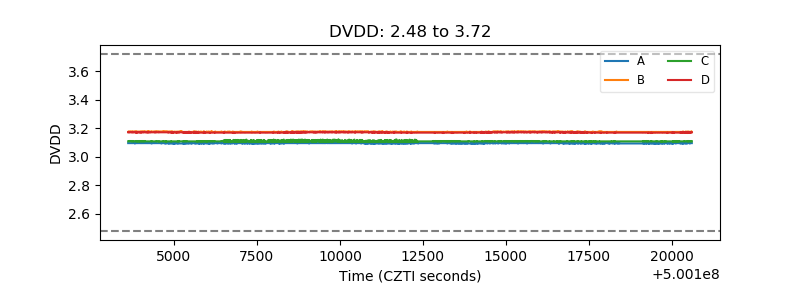 |
| Temperature 1 | 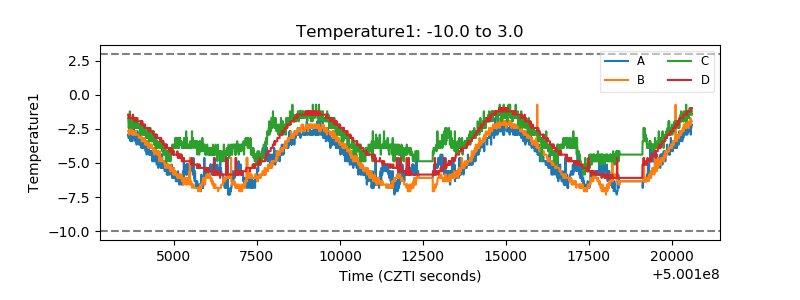 |
| Veto HV Monitor |  |
| Veto LLD | 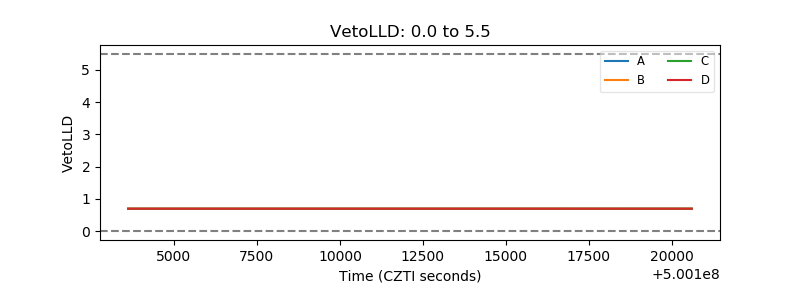 |
| Alpha Counter |  |
| _CPM_Rate | 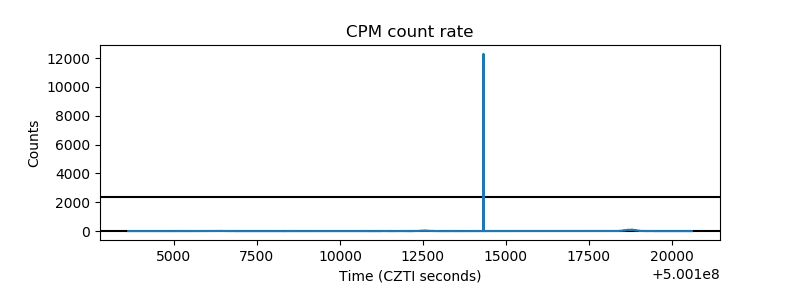 |
| CZT Counter | 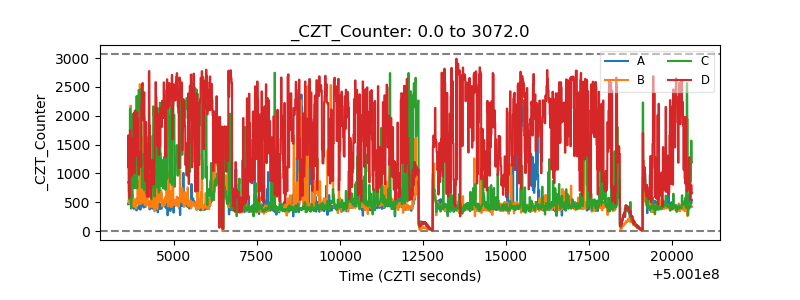 |
| +2.5 Volts monitor |  |
| +5 Volts monitor | 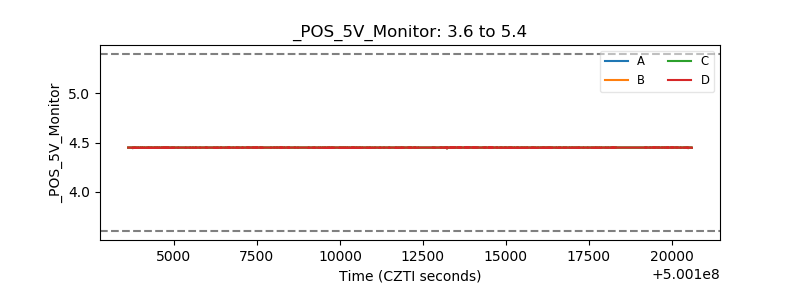 |
| _ROLL_ROT | 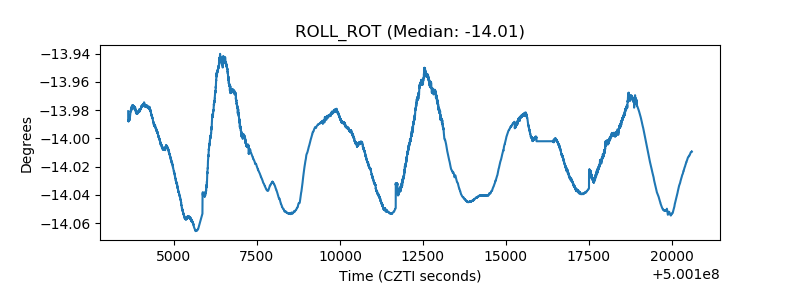 |
| _Roll_DEC | 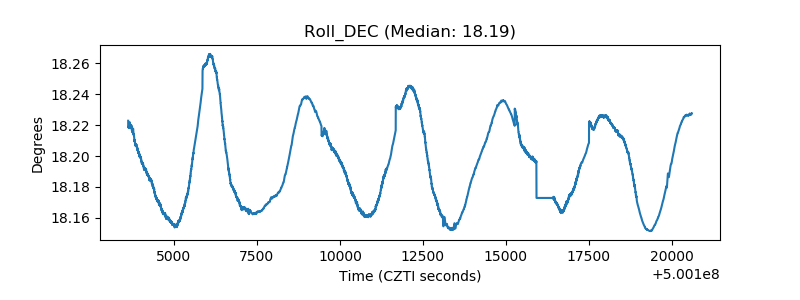 |
| _Roll_RA | 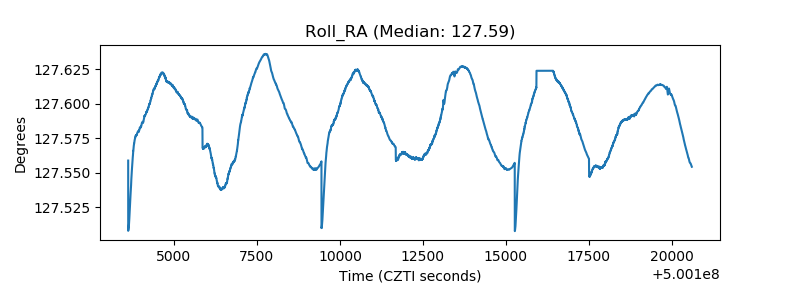 |
| Veto Counter | 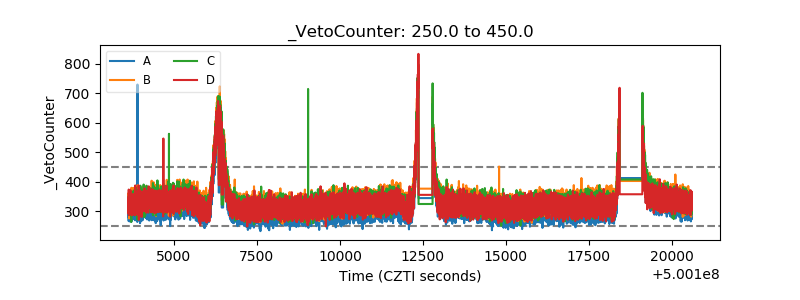 |