| Param | Original file | Final file |
|---|---|---|
| Filename | modeM0/AS1A14_066T07_9000006522_54686cztM0_level2.fits | modeM0/AS1A14_066T07_9000006522_54686cztM0_level2_quad_clean.evt |
| Size (bytes) | 651,179,520 | 82,486,080 |
| Size | 621.0 MB | 78.7 MB |
| Events in quadrant A | 3,546,794 | 596,074 |
| Events in quadrant B | 3,652,769 | 631,772 |
| Events in quadrant C | 4,750,016 | 549,675 |
| Events in quadrant D | 11,655,115 | 271,405 |
| Mode M9 | |||
|---|---|---|---|
| Quadrant | BADHDUFLAG | Total packets | Discarded packets |
| A | 0 | 9 | 0 |
| B | 0 | 9 | 0 |
| C | 0 | 9 | 0 |
| D | 0 | 9 | 0 |
| Mode M0 | |||
|---|---|---|---|
| Quadrant | BADHDUFLAG | Total packets | Discarded packets |
| A | 0 | 15141 | 1 |
| B | 0 | 15387 | 1 |
| C | 0 | 18719 | 1 |
| D | 0 | 39083 | 1 |
| Mode SS | |||
|---|---|---|---|
| Quadrant | BADHDUFLAG | Total packets | Discarded packets |
| A | 0 | 128 | 0 |
| B | 0 | 128 | 0 |
| C | 0 | 128 | 0 |
| D | 0 | 128 | 0 |
| Quadrant | Total seconds | Saturated seconds | Saturation percentage |
|---|---|---|---|
| A | 6433 | 245 | 3.808487% |
| B | 6434 | 300 | 4.662729% |
| C | 6434 | 404 | 6.279142% |
| D | 6434 | 3511 | 54.569475% |
Noise dominated data is calculated using 1-second bins in cleaned event files. If a bin has >2000 counts, and if more than 50% of those come from <1% of pixels, then it is considered to be noise-dominated and hence unusable.
| Quadrant | # 1 sec bins | Bins with >0 counts | Bins with >2000 counts | High rate bins dominated by noise | Noise dominated (total time) | Noise dominated (detector-on time) | Marked lightcurve |
|---|---|---|---|---|---|---|---|
| A | 7288 | 6433 | 161 | 161 | 2.21% | 2.50% | 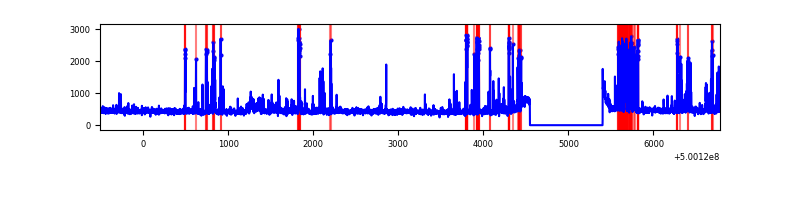 |
| B | 7289 | 6434 | 204 | 204 | 2.80% | 3.17% | 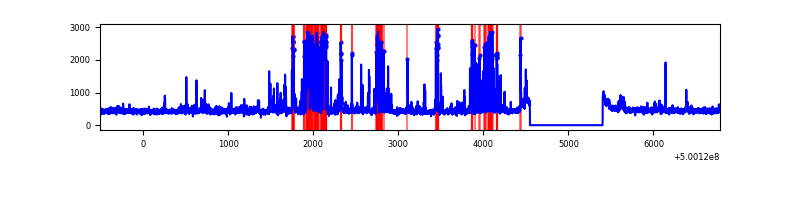 |
| C | 7289 | 6434 | 297 | 297 | 4.07% | 4.62% | 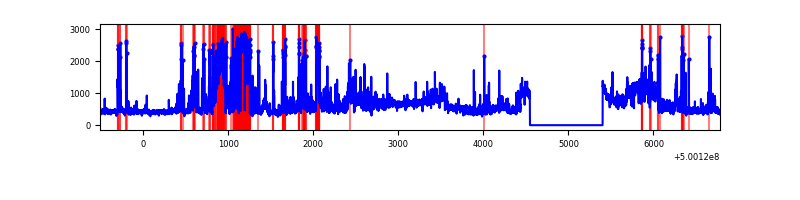 |
| D | 7289 | 6434 | 3261 | 3261 | 44.74% | 50.68% | 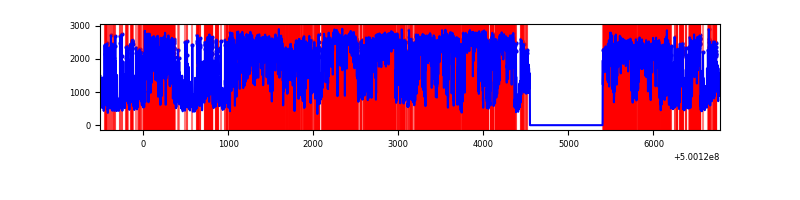 |
Top three noisy pixels from each quadrant. If the there are fewer than three noisy pixels in the level2.evt file, extra rows are filled as -1
| Pixel properties | Quadrant properties | ||||||
|---|---|---|---|---|---|---|---|
| Quadrant | DetID | PixID | Counts | Sigma | Mean | Median | Sigma |
| A | 0 | 8 | 550944 | 3219.86 | 695 | 678 | 170.9 |
| A | 5 | 240 | 75973 | 440.59 | 695 | 678 | 170.9 |
| A | 11 | 3 | 63430 | 367.19 | 695 | 678 | 170.9 |
| B | 1 | 207 | 514013 | 3487.39 | 679 | 655 | 147.2 |
| B | 2 | 249 | 270210 | 1831.17 | 679 | 655 | 147.2 |
| B | 0 | 213 | 107914 | 728.64 | 679 | 655 | 147.2 |
| C | 4 | 5 | 1451572 | 7974.65 | 660 | 653 | 181.9 |
| C | 13 | 3 | 502879 | 2760.37 | 660 | 653 | 181.9 |
| C | 14 | 254 | 60685 | 329.95 | 660 | 653 | 181.9 |
| D | 11 | 129 | 7053287 | 50535.03 | 481 | 458 | 139.6 |
| D | 11 | 176 | 1596504 | 11436.01 | 481 | 458 | 139.6 |
| D | 2 | 62 | 490906 | 3514.17 | 481 | 458 | 139.6 |
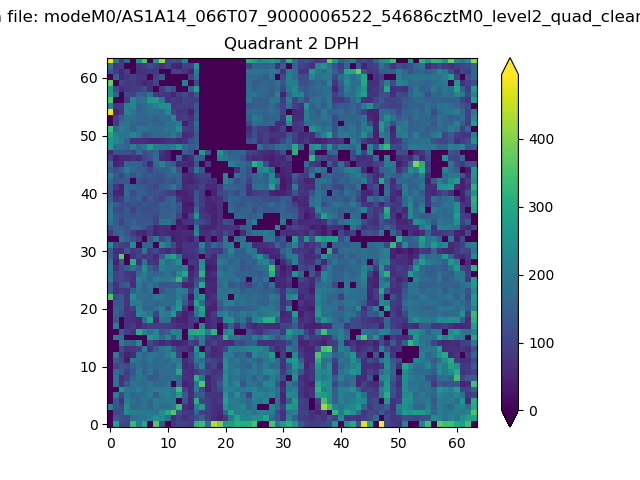
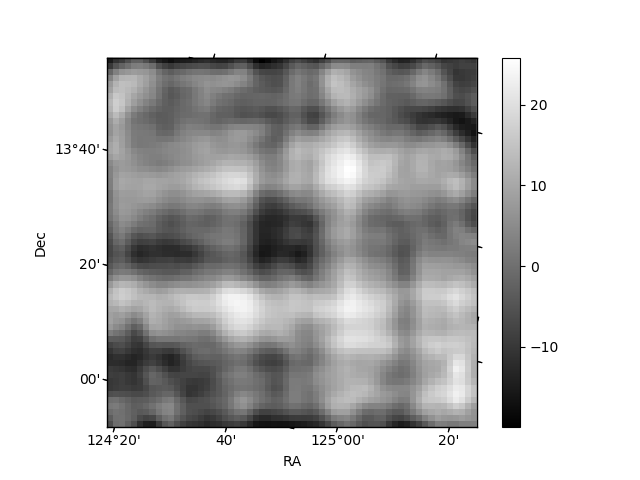
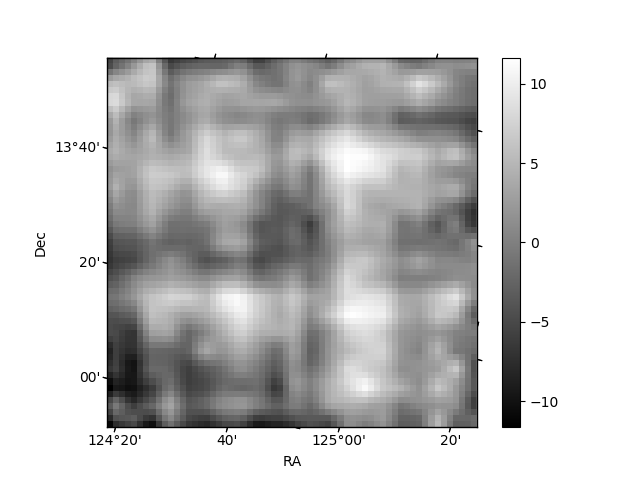
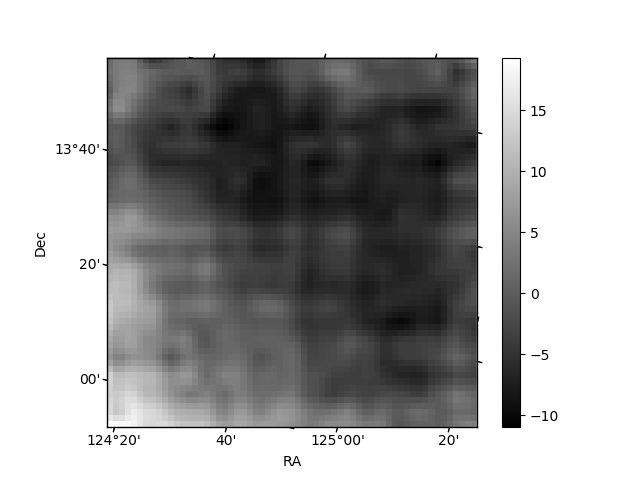
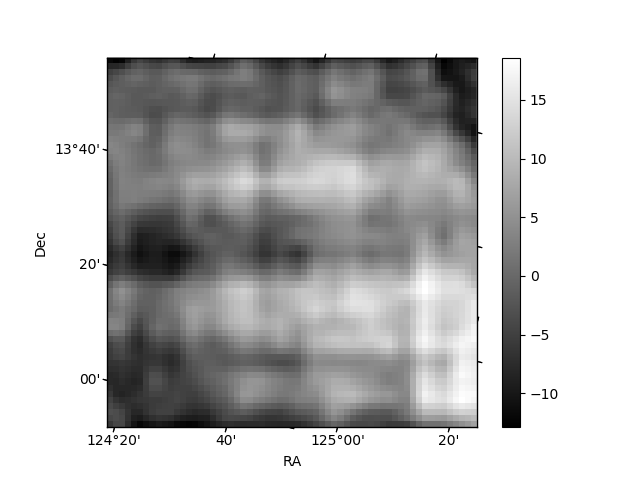
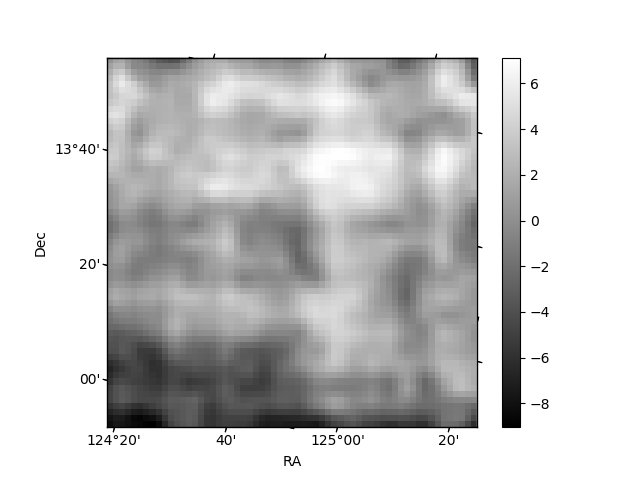
Histogram calculated using DETX and DETY for each event in the final _common_clean file
| Quadrant A | 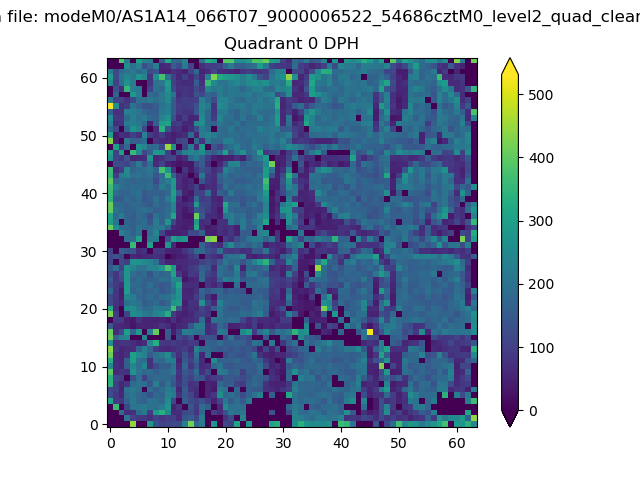 |
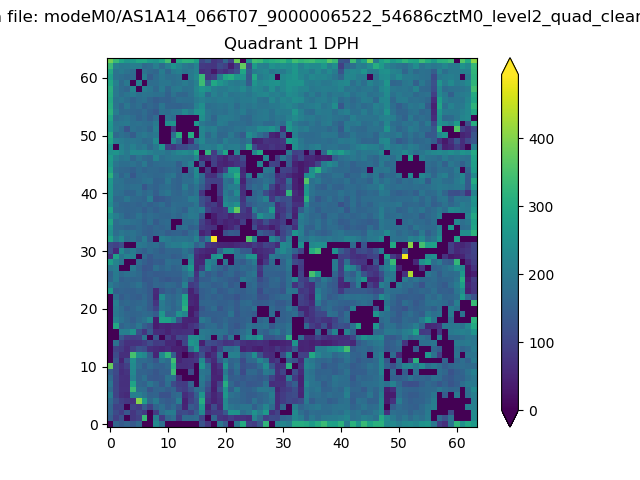 |
Quadrant B |
|---|---|---|---|
| Quadrant D | 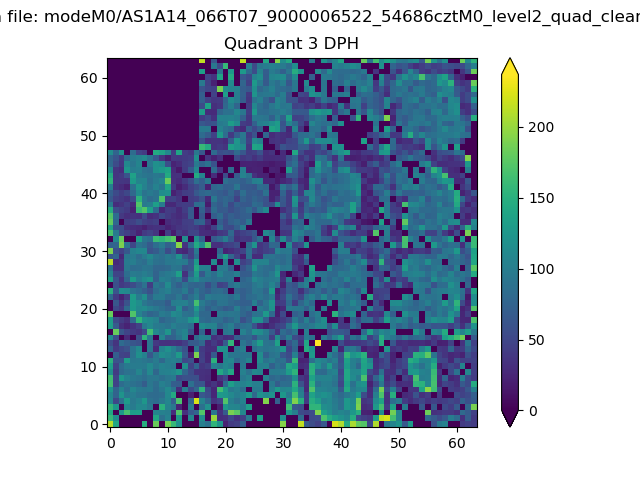 |
 |
Quadrant C |
| Plot type | Count rate plots | Images |
|---|---|---|
| Comparison with Poisson distribution Blue bars denote a histogram of data divided into 1 sec bins. Red curve is a Poisson curve with rate = median count rate of data. |
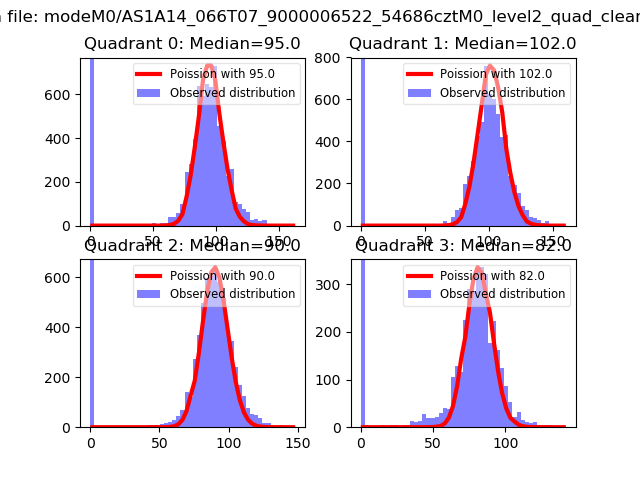 |
 |
| Quadrant-wise count rates Data is divided into 100 sec bins |
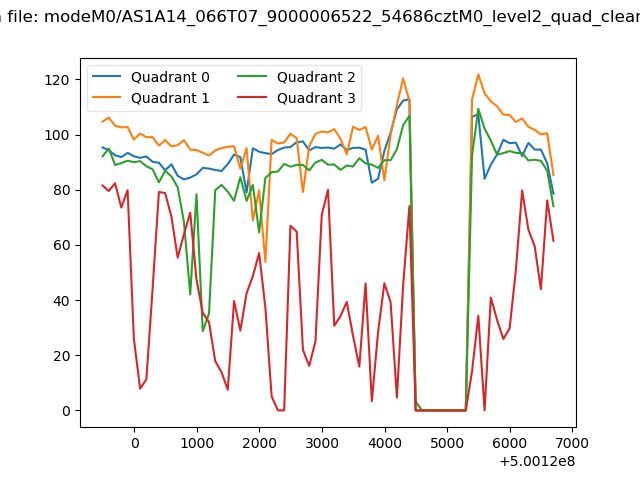 |
|
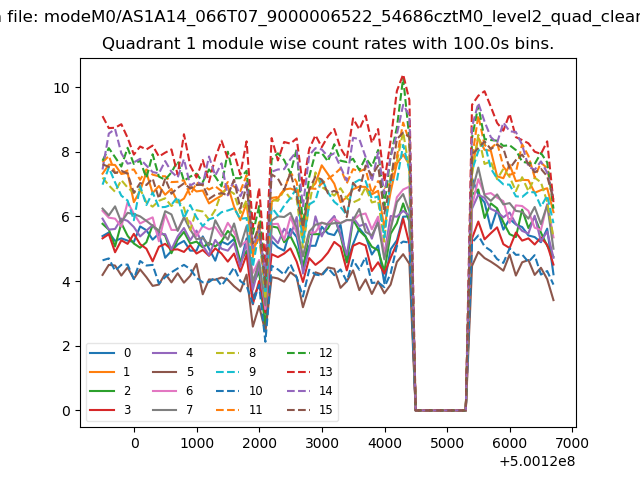
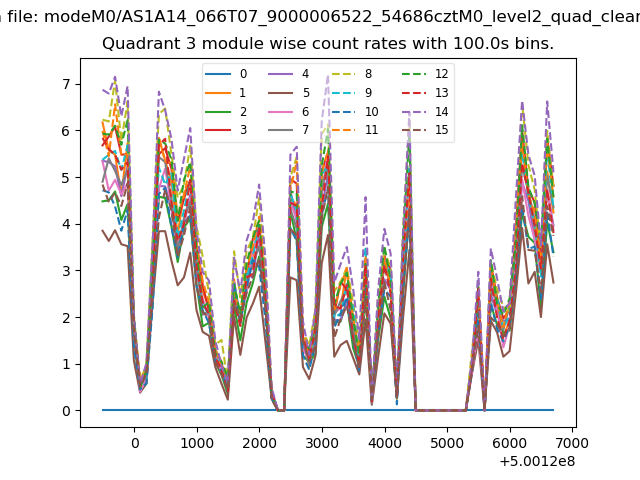
| Module-wise count rates for Quadrant A Data is divided into 100 sec bins |
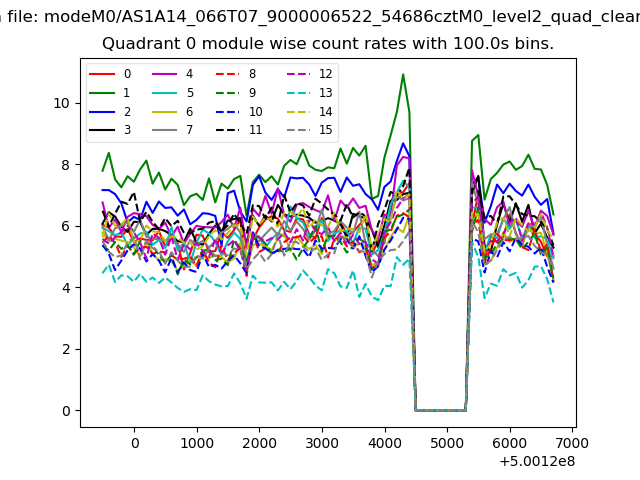 |
 |
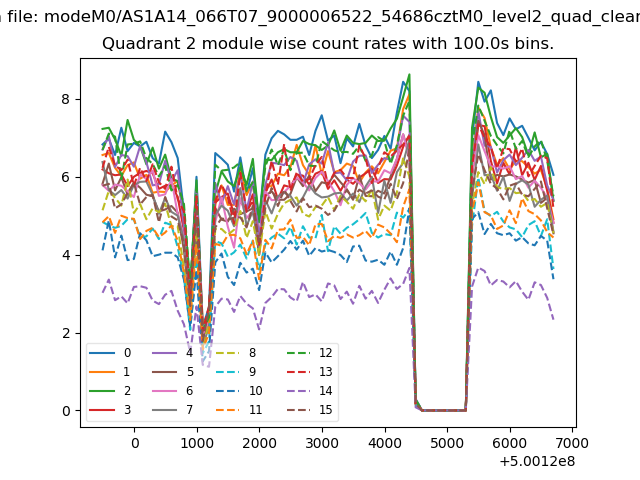
| Module-wise count rates for Quadrant B Data is divided into 100 sec bins |
 |
 |
| Module-wise count rates for Quadrant C Data is divided into 100 sec bins |
 |
 |
| Module-wise count rates for Quadrant D Data is divided into 100 sec bins |
 |
 |
| Parameter | Plot |
|---|---|
| CZT HV Monitor | 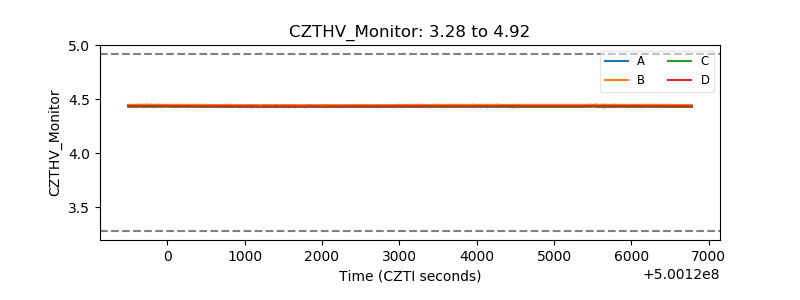 |
| D_VDD | 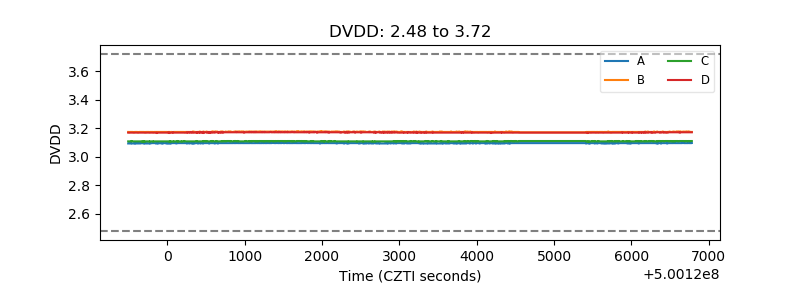 |
| Temperature 1 | 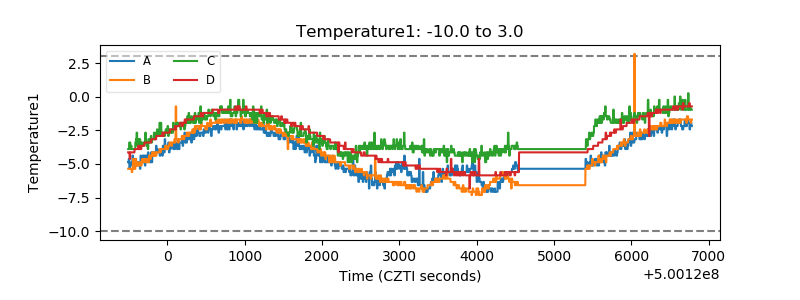 |
| Veto HV Monitor | 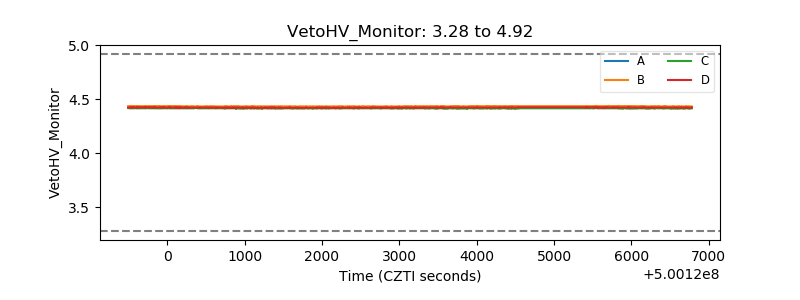 |
| Veto LLD | 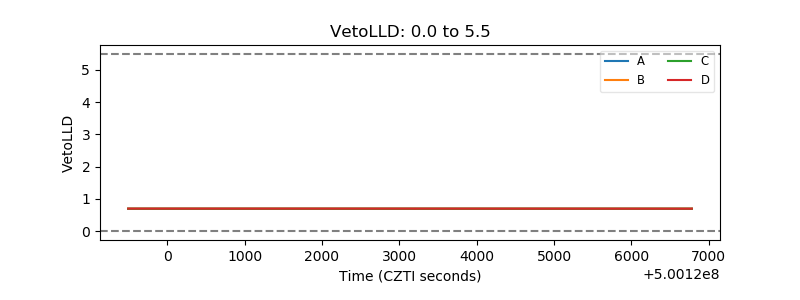 |
| Alpha Counter | 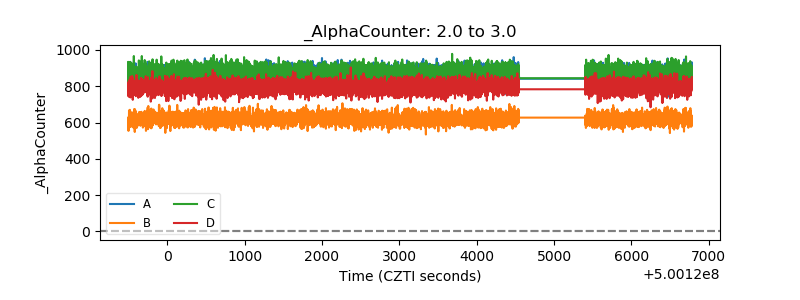 |
| _CPM_Rate | 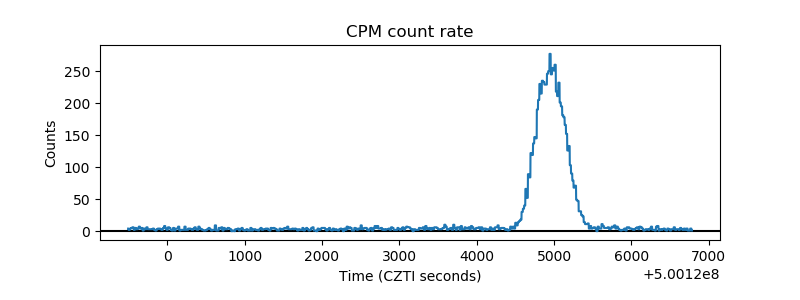 |
| CZT Counter | 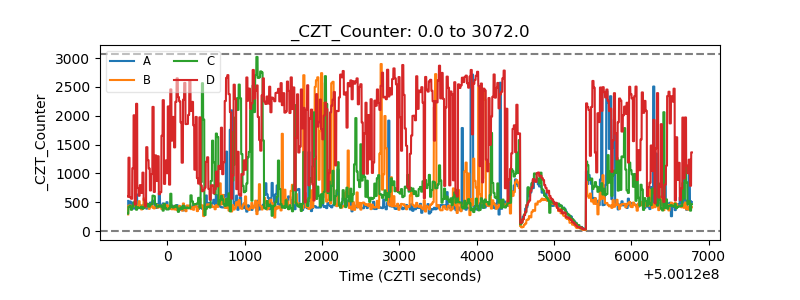 |
| +2.5 Volts monitor | 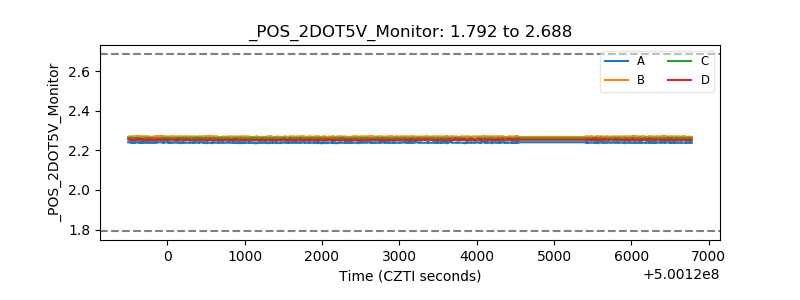 |
| +5 Volts monitor | 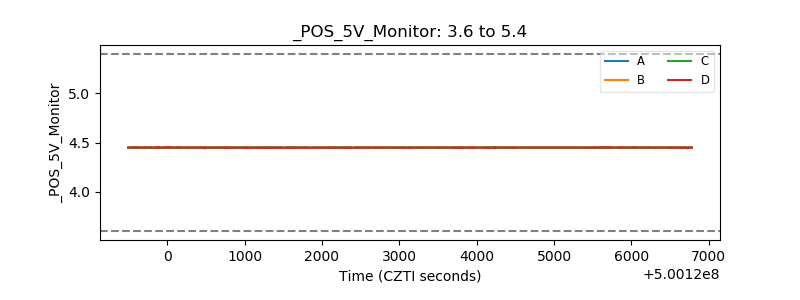 |
| _ROLL_ROT | 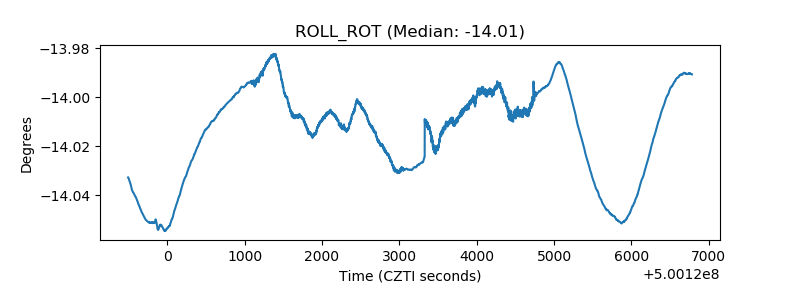 |
| _Roll_DEC | 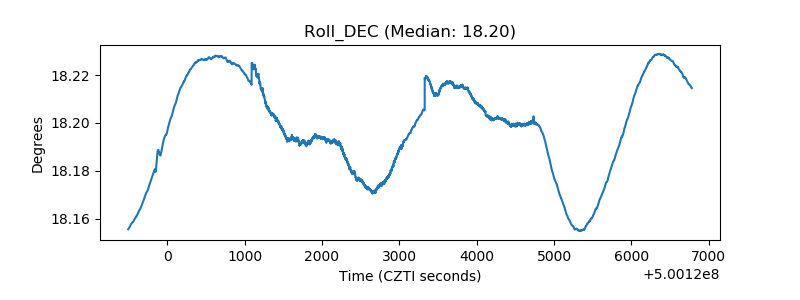 |
| _Roll_RA | 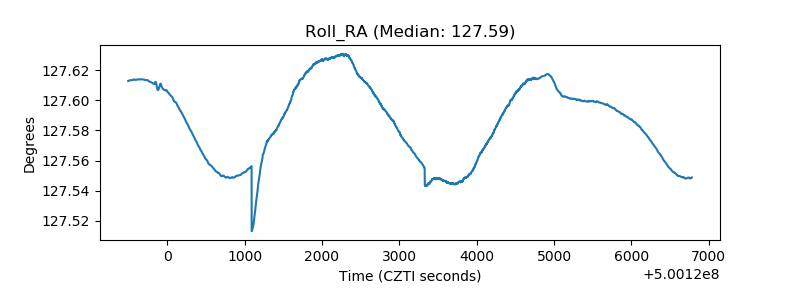 |
| Veto Counter | 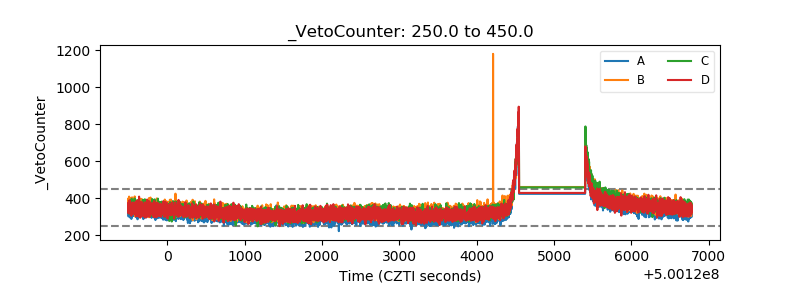 |