| Param | Original file | Final file |
|---|---|---|
| Filename | modeM0/AS1A14_066T07_9000006522_54689cztM0_level2.fits | modeM0/AS1A14_066T07_9000006522_54689cztM0_level2_quad_clean.evt |
| Size (bytes) | 591,874,560 | 95,065,920 |
| Size | 564.5 MB | 90.7 MB |
| Events in quadrant A | 3,241,367 | 677,576 |
| Events in quadrant B | 3,944,813 | 715,837 |
| Events in quadrant C | 3,470,465 | 637,270 |
| Events in quadrant D | 10,731,748 | 380,004 |
| Mode M9 | |||
|---|---|---|---|
| Quadrant | BADHDUFLAG | Total packets | Discarded packets |
| A | 0 | 10 | 0 |
| B | 0 | 11 | 0 |
| C | 0 | 11 | 0 |
| D | 0 | 11 | 0 |
| Mode M0 | |||
|---|---|---|---|
| Quadrant | BADHDUFLAG | Total packets | Discarded packets |
| A | 0 | 14254 | 2 |
| B | 0 | 16173 | 2 |
| C | 0 | 14899 | 2 |
| D | 0 | 36597 | 4 |
| Mode SS | |||
|---|---|---|---|
| Quadrant | BADHDUFLAG | Total packets | Discarded packets |
| A | 0 | 138 | 0 |
| B | 0 | 138 | 0 |
| C | 0 | 138 | 0 |
| D | 0 | 138 | 0 |
| Quadrant | Total seconds | Saturated seconds | Saturation percentage |
|---|---|---|---|
| A | 6704 | 87 | 1.297733% |
| B | 6704 | 178 | 2.655131% |
| C | 6704 | 131 | 1.954057% |
| D | 6703 | 2765 | 41.250186% |
Noise dominated data is calculated using 1-second bins in cleaned event files. If a bin has >2000 counts, and if more than 50% of those come from <1% of pixels, then it is considered to be noise-dominated and hence unusable.
| Quadrant | # 1 sec bins | Bins with >0 counts | Bins with >2000 counts | High rate bins dominated by noise | Noise dominated (total time) | Noise dominated (detector-on time) | Marked lightcurve |
|---|---|---|---|---|---|---|---|
| A | 7799 | 6704 | 6 | 6 | 0.08% | 0.09% | 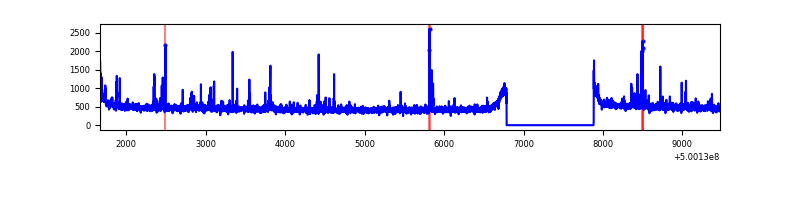 |
| B | 7799 | 6704 | 52 | 52 | 0.67% | 0.78% | 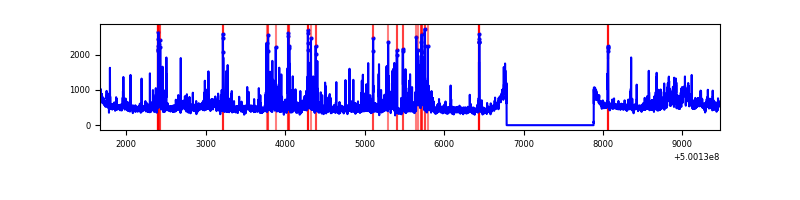 |
| C | 7799 | 6704 | 58 | 58 | 0.74% | 0.87% | 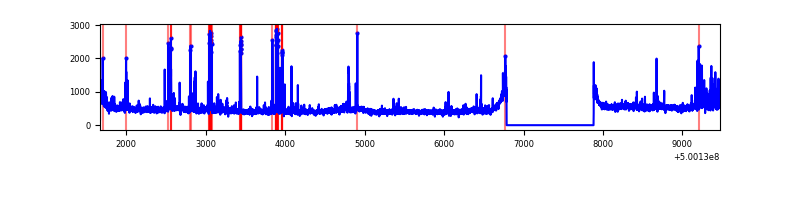 |
| D | 7798 | 6703 | 2615 | 2615 | 33.53% | 39.01% | 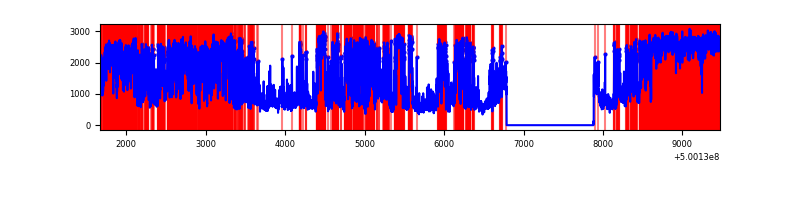 |
Top three noisy pixels from each quadrant. If the there are fewer than three noisy pixels in the level2.evt file, extra rows are filled as -1
| Pixel properties | Quadrant properties | ||||||
|---|---|---|---|---|---|---|---|
| Quadrant | DetID | PixID | Counts | Sigma | Mean | Median | Sigma |
| A | 5 | 240 | 43212 | 226.5 | 768 | 751 | 187.5 |
| A | 3 | 14 | 35846 | 187.21 | 768 | 751 | 187.5 |
| A | 4 | 3 | 28218 | 146.52 | 768 | 751 | 187.5 |
| B | 2 | 249 | 654061 | 4095.78 | 750 | 726 | 159.5 |
| B | 7 | 0 | 118398 | 737.69 | 750 | 726 | 159.5 |
| B | 1 | 207 | 63878 | 395.9 | 750 | 726 | 159.5 |
| C | 3 | 242 | 167925 | 817.08 | 745 | 739 | 204.6 |
| C | 6 | 223 | 148789 | 723.56 | 745 | 739 | 204.6 |
| C | 12 | 250 | 102533 | 497.49 | 745 | 739 | 204.6 |
| D | 11 | 129 | 5199770 | 30377.27 | 596 | 570 | 171.2 |
| D | 11 | 176 | 1580468 | 9230.84 | 596 | 570 | 171.2 |
| D | 2 | 62 | 741869 | 4331.17 | 596 | 570 | 171.2 |
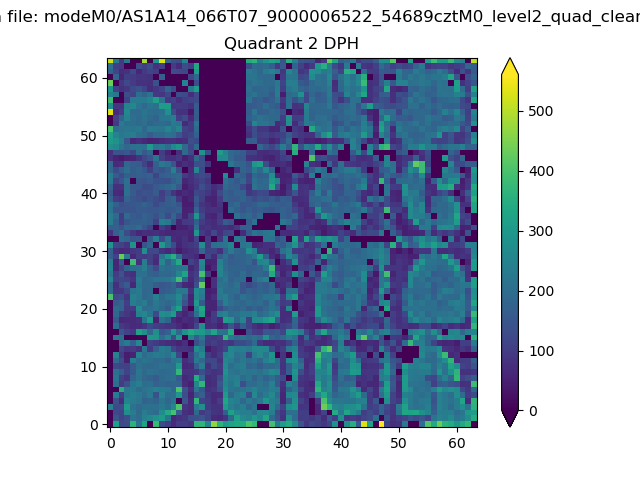
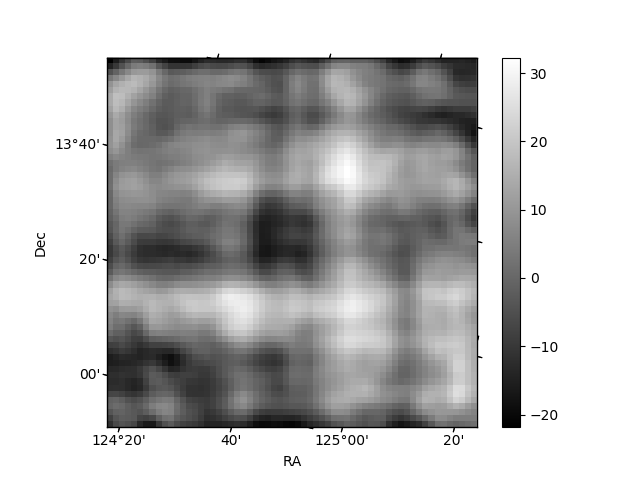
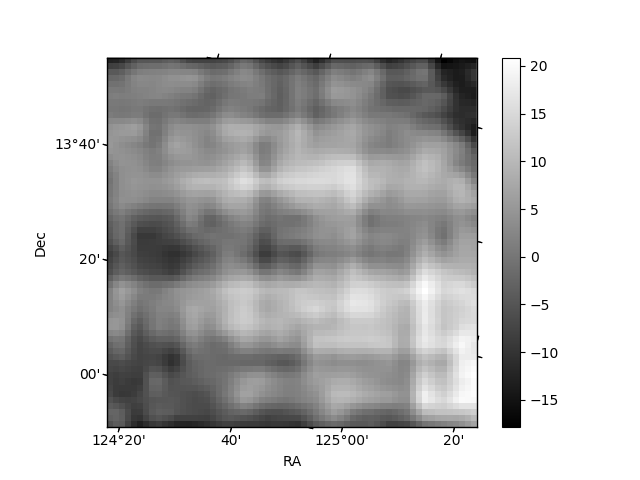
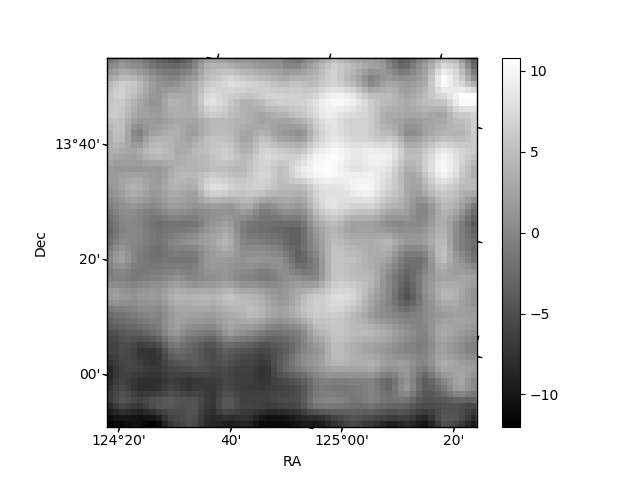
Histogram calculated using DETX and DETY for each event in the final _common_clean file
| Quadrant A | 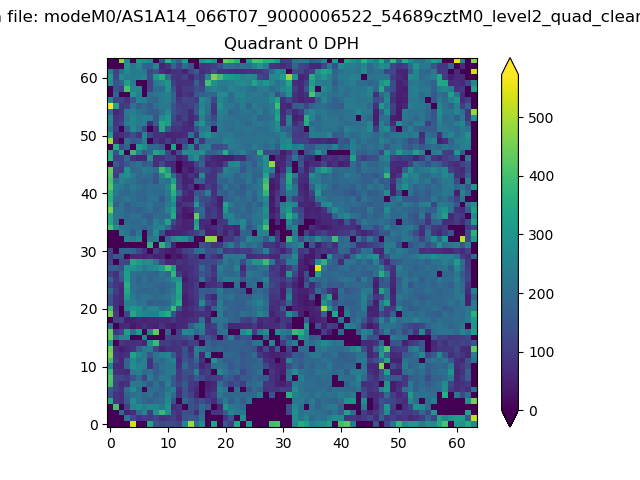 |
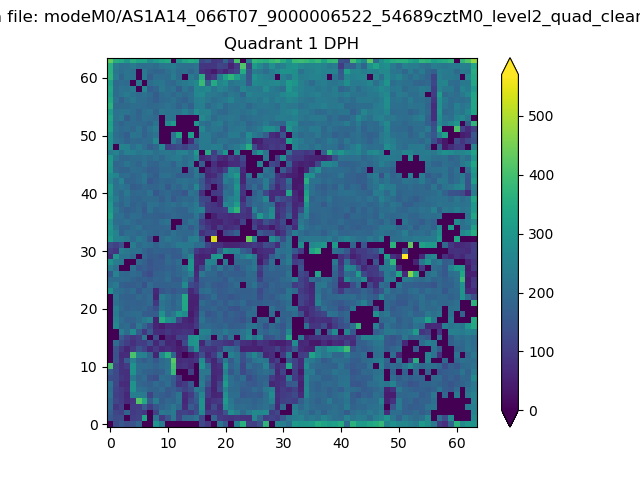 |
Quadrant B |
|---|---|---|---|
| Quadrant D | 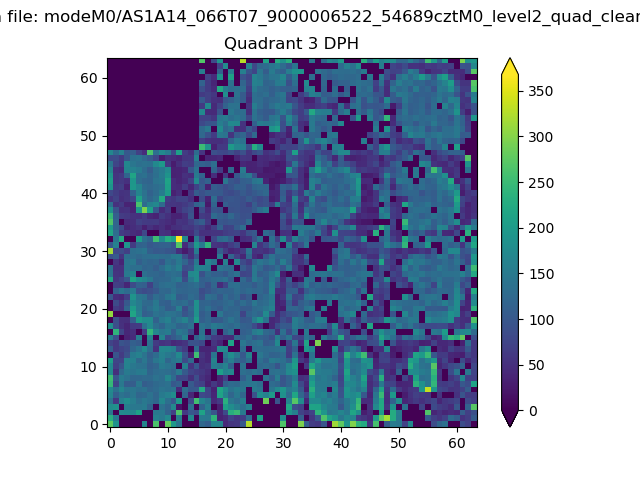 |
 |
Quadrant C |
| Plot type | Count rate plots | Images |
|---|---|---|
| Comparison with Poisson distribution Blue bars denote a histogram of data divided into 1 sec bins. Red curve is a Poisson curve with rate = median count rate of data. |
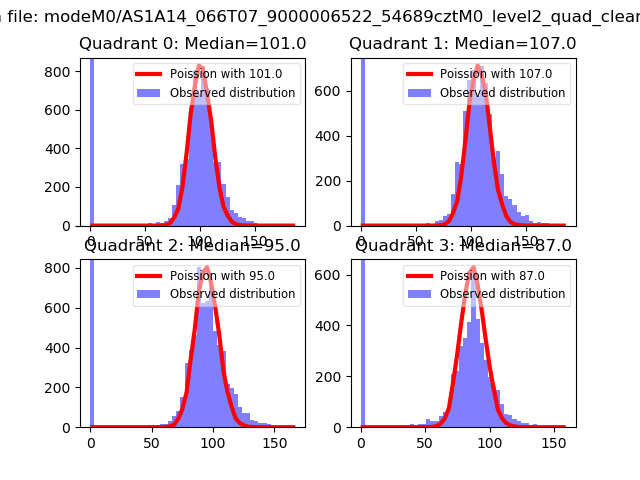 |
 |
| Quadrant-wise count rates Data is divided into 100 sec bins |
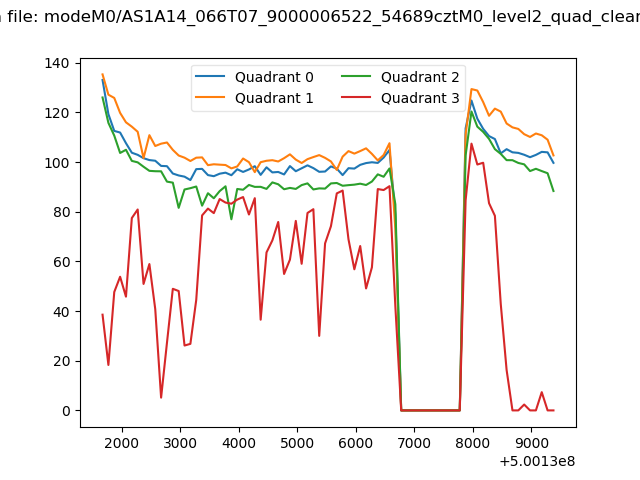 |
|
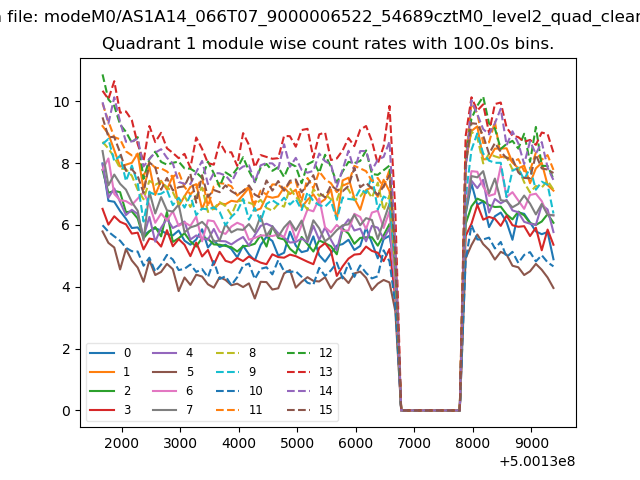
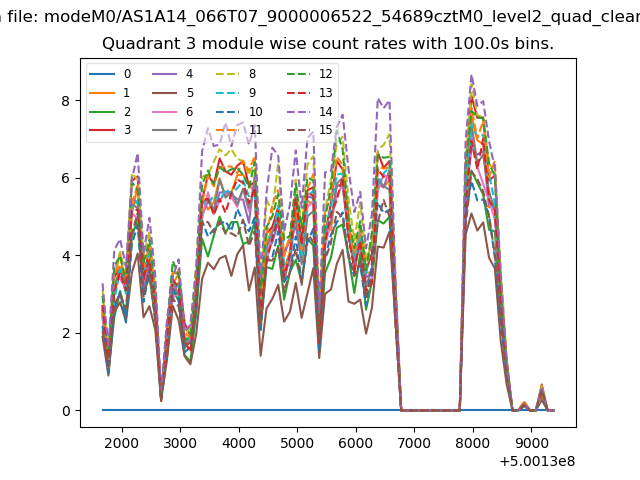
| Module-wise count rates for Quadrant A Data is divided into 100 sec bins |
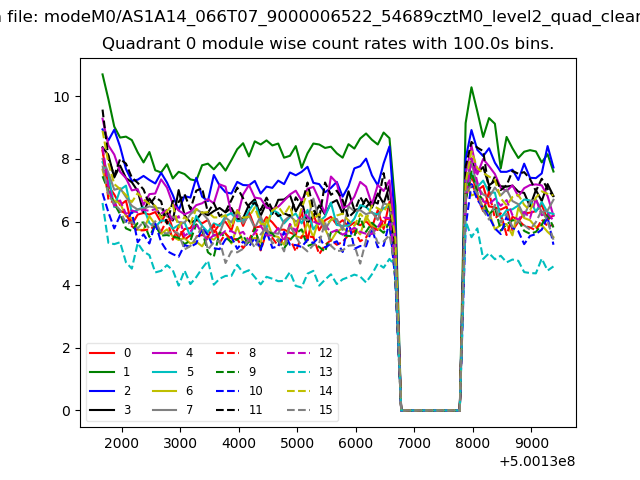 |
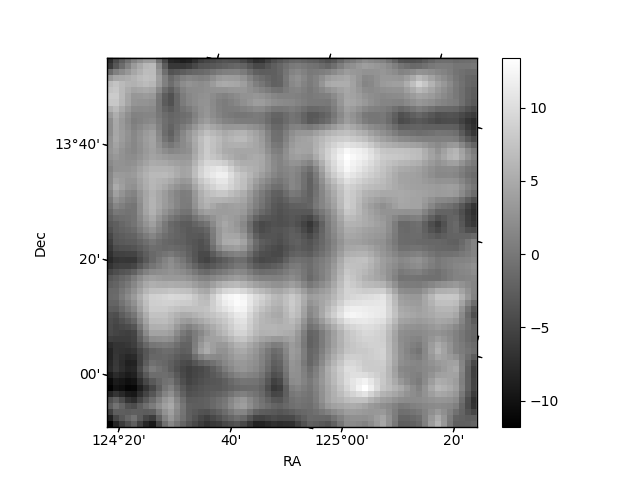 |
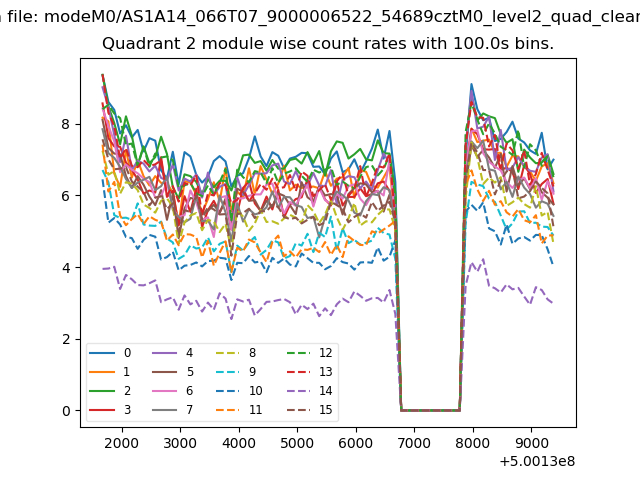
| Module-wise count rates for Quadrant B Data is divided into 100 sec bins |
 |
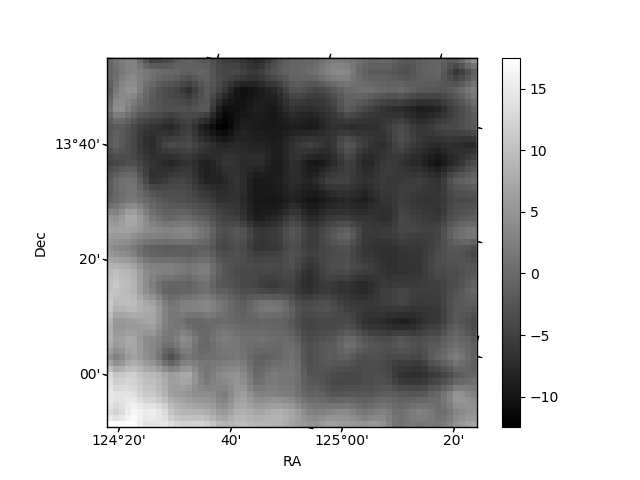 |
| Module-wise count rates for Quadrant C Data is divided into 100 sec bins |
 |
 |
| Module-wise count rates for Quadrant D Data is divided into 100 sec bins |
 |
 |
| Parameter | Plot |
|---|---|
| CZT HV Monitor | 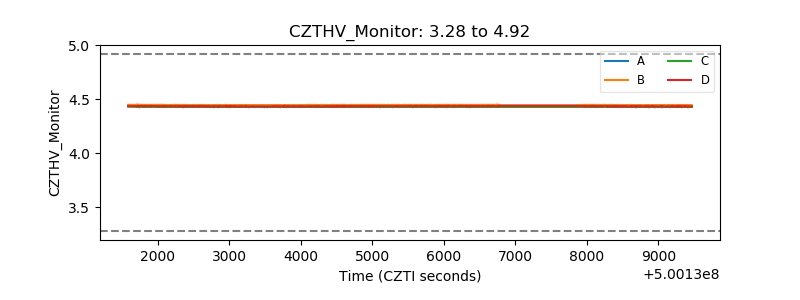 |
| D_VDD | 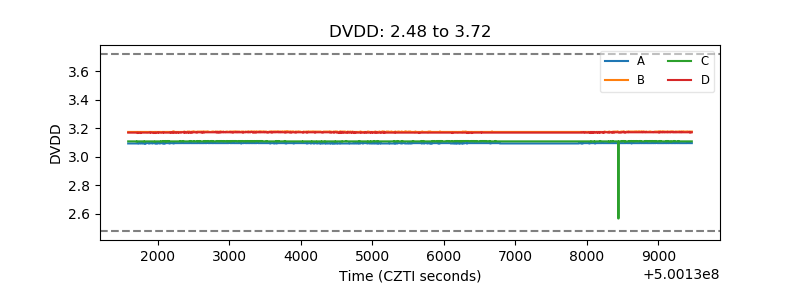 |
| Temperature 1 | 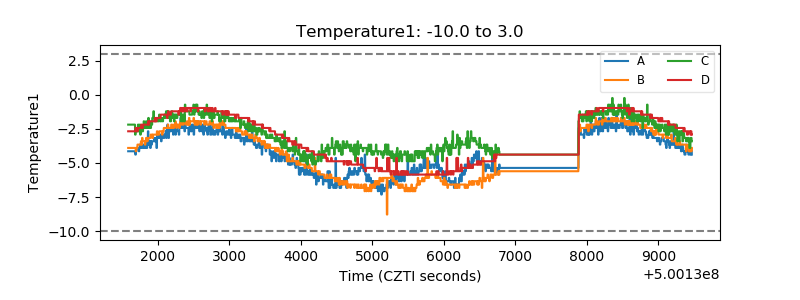 |
| Veto HV Monitor | 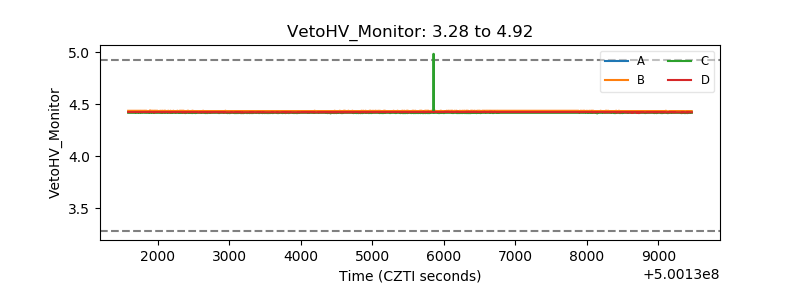 |
| Veto LLD | 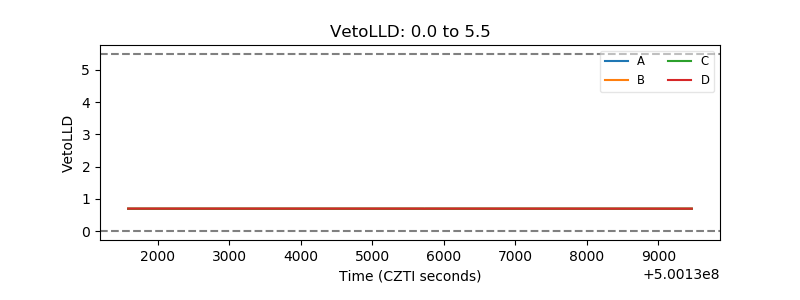 |
| Alpha Counter | 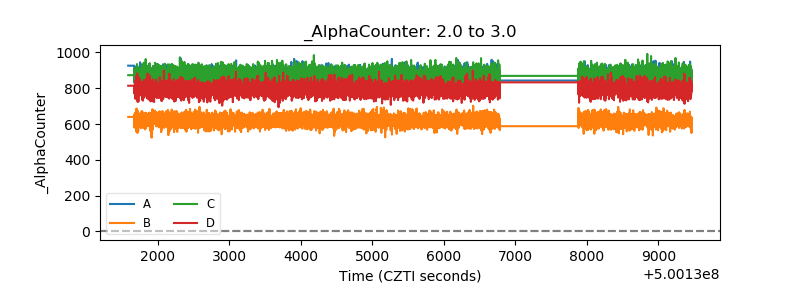 |
| _CPM_Rate | 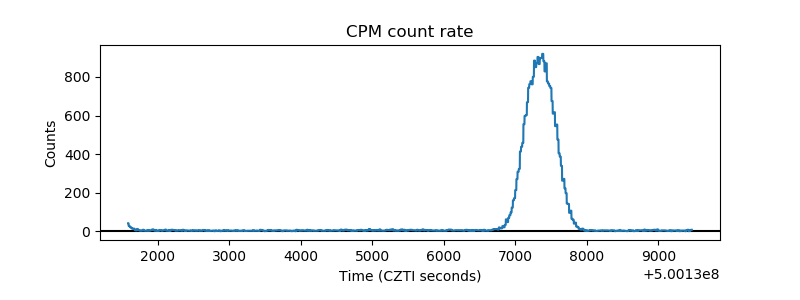 |
| CZT Counter | 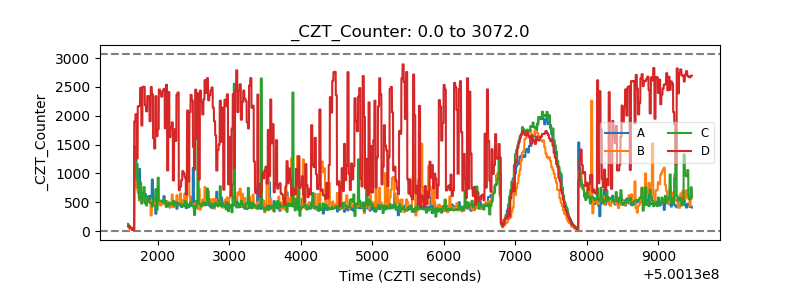 |
| +2.5 Volts monitor |  |
| +5 Volts monitor | 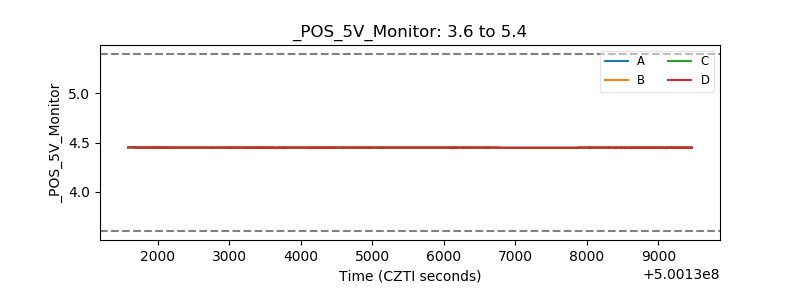 |
| _ROLL_ROT | 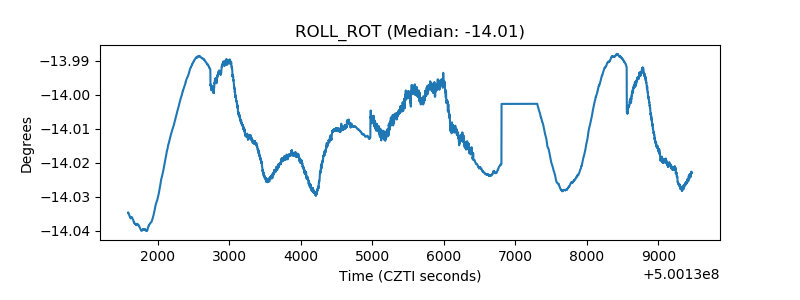 |
| _Roll_DEC | 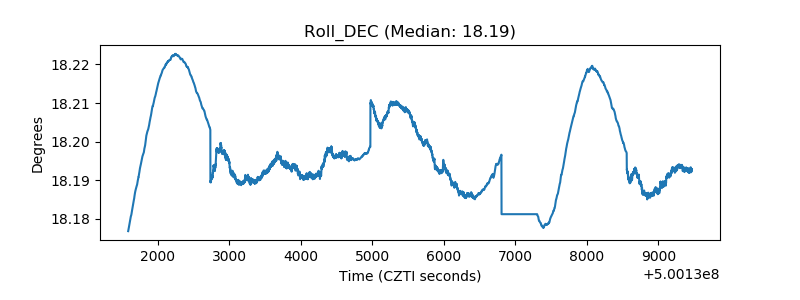 |
| _Roll_RA | 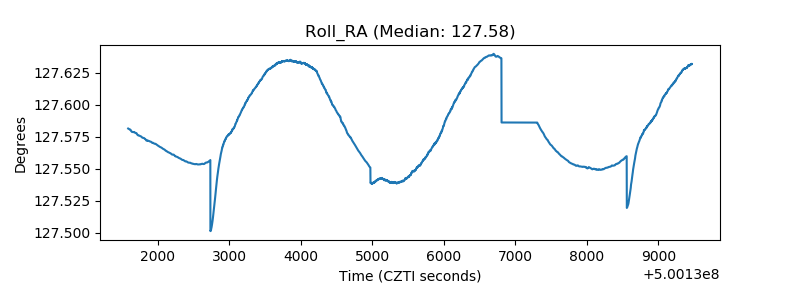 |
| Veto Counter | 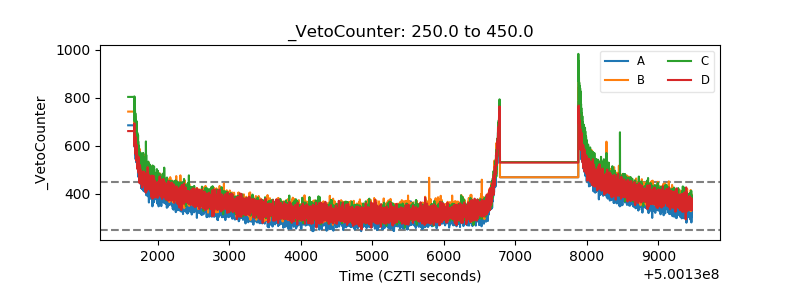 |