| Param | Original file | Final file |
|---|---|---|
| Filename | modeM0/AS1A14_066T07_9000006522_54690cztM0_level2.fits | modeM0/AS1A14_066T07_9000006522_54690cztM0_level2_quad_clean.evt |
| Size (bytes) | 668,661,120 | 89,161,920 |
| Size | 637.7 MB | 85.0 MB |
| Events in quadrant A | 3,598,836 | 660,897 |
| Events in quadrant B | 3,644,442 | 703,468 |
| Events in quadrant C | 4,016,027 | 621,910 |
| Events in quadrant D | 12,988,387 | 260,526 |
| Mode M9 | |||
|---|---|---|---|
| Quadrant | BADHDUFLAG | Total packets | Discarded packets |
| A | 0 | 15 | 0 |
| B | 0 | 16 | 0 |
| C | 0 | 16 | 0 |
| D | 0 | 16 | 0 |
| Mode M0 | |||
|---|---|---|---|
| Quadrant | BADHDUFLAG | Total packets | Discarded packets |
| A | 0 | 15058 | 2 |
| B | 0 | 15113 | 2 |
| C | 0 | 16112 | 2 |
| D | 0 | 43141 | 2 |
| Mode SS | |||
|---|---|---|---|
| Quadrant | BADHDUFLAG | Total packets | Discarded packets |
| A | 0 | 134 | 0 |
| B | 0 | 134 | 0 |
| C | 0 | 134 | 0 |
| D | 0 | 134 | 0 |
| Quadrant | Total seconds | Saturated seconds | Saturation percentage |
|---|---|---|---|
| A | 6486 | 177 | 2.728955% |
| B | 6486 | 203 | 3.129818% |
| C | 6486 | 250 | 3.854456% |
| D | 6486 | 4056 | 62.534690% |
Noise dominated data is calculated using 1-second bins in cleaned event files. If a bin has >2000 counts, and if more than 50% of those come from <1% of pixels, then it is considered to be noise-dominated and hence unusable.
| Quadrant | # 1 sec bins | Bins with >0 counts | Bins with >2000 counts | High rate bins dominated by noise | Noise dominated (total time) | Noise dominated (detector-on time) | Marked lightcurve |
|---|---|---|---|---|---|---|---|
| A | 7626 | 6487 | 28 | 28 | 0.37% | 0.43% | 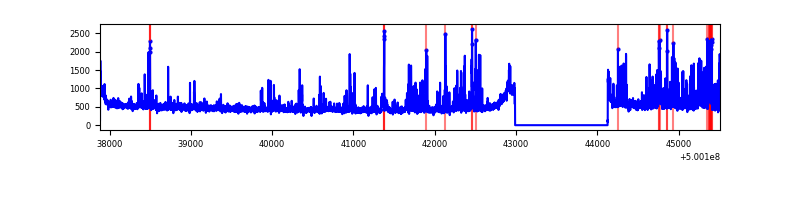 |
| B | 7626 | 6487 | 45 | 45 | 0.59% | 0.69% | 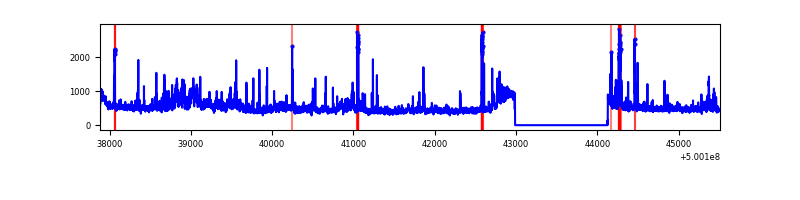 |
| C | 7626 | 6487 | 103 | 103 | 1.35% | 1.59% | 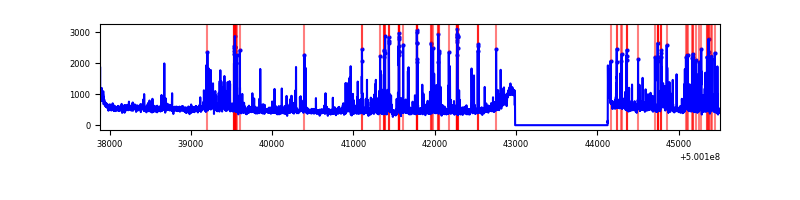 |
| D | 7626 | 6487 | 3934 | 3934 | 51.59% | 60.64% | 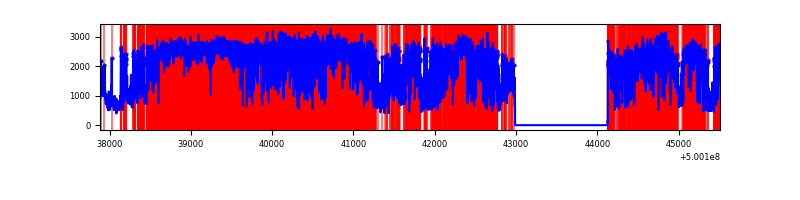 |
Top three noisy pixels from each quadrant. If the there are fewer than three noisy pixels in the level2.evt file, extra rows are filled as -1
| Pixel properties | Quadrant properties | ||||||
|---|---|---|---|---|---|---|---|
| Quadrant | DetID | PixID | Counts | Sigma | Mean | Median | Sigma |
| A | 3 | 14 | 278125 | 1507.07 | 752 | 734 | 184.1 |
| A | 11 | 3 | 214194 | 1159.74 | 752 | 734 | 184.1 |
| A | 7 | 190 | 44404 | 237.26 | 752 | 734 | 184.1 |
| B | 2 | 249 | 459255 | 2898.24 | 740 | 715 | 158.2 |
| B | 7 | 0 | 134466 | 845.38 | 740 | 715 | 158.2 |
| B | 0 | 213 | 54368 | 339.12 | 740 | 715 | 158.2 |
| C | 6 | 223 | 434975 | 2166.29 | 732 | 727 | 200.5 |
| C | 14 | 254 | 263202 | 1309.38 | 732 | 727 | 200.5 |
| C | 3 | 242 | 170832 | 848.59 | 732 | 727 | 200.5 |
| D | 11 | 129 | 7271172 | 49327.0 | 506 | 482 | 147.4 |
| D | 2 | 96 | 1375376 | 9327.78 | 506 | 482 | 147.4 |
| D | 11 | 176 | 771827 | 5233.08 | 506 | 482 | 147.4 |
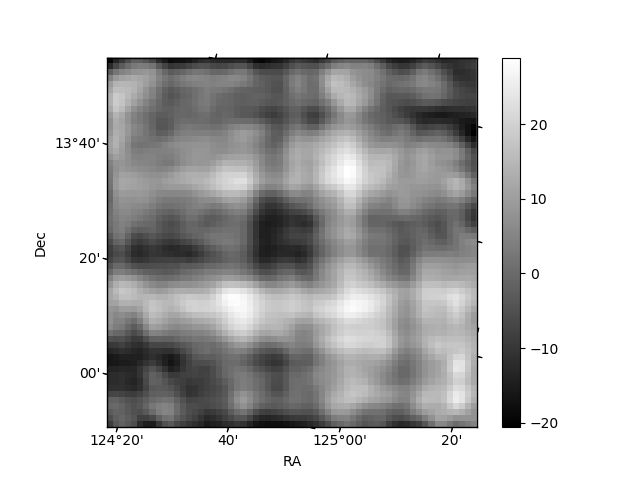
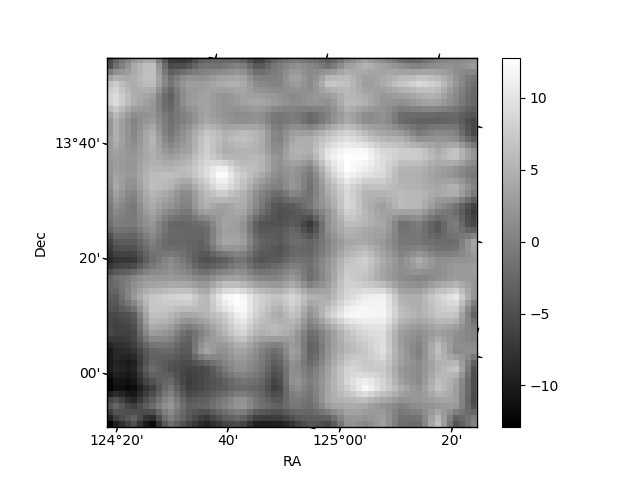
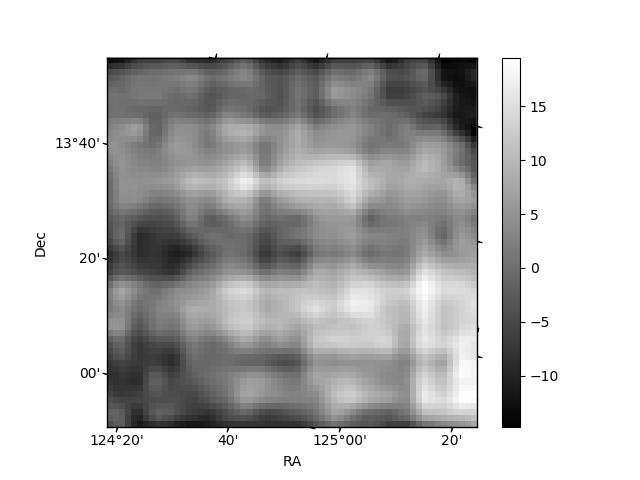
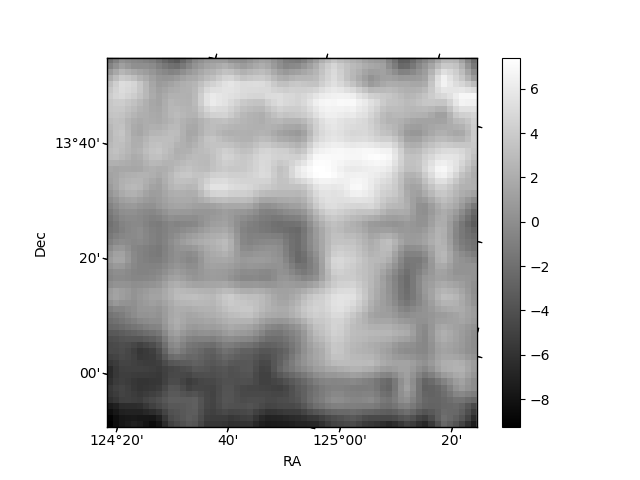
Histogram calculated using DETX and DETY for each event in the final _common_clean file
| Quadrant A | 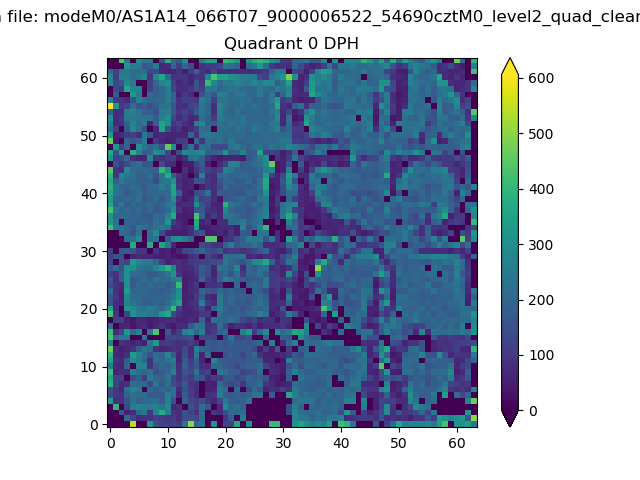 |
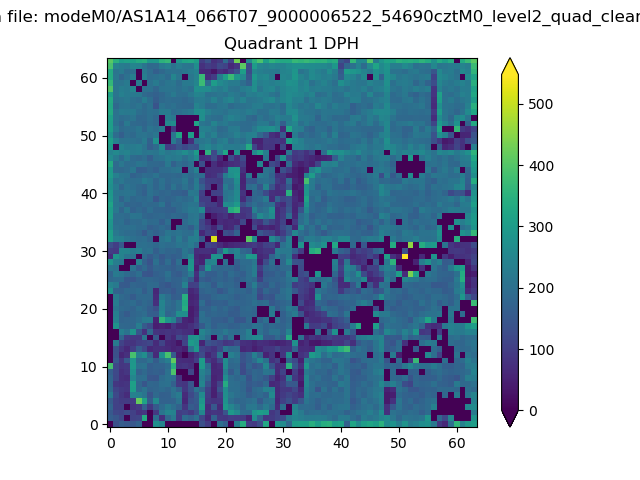 |
Quadrant B |
|---|---|---|---|
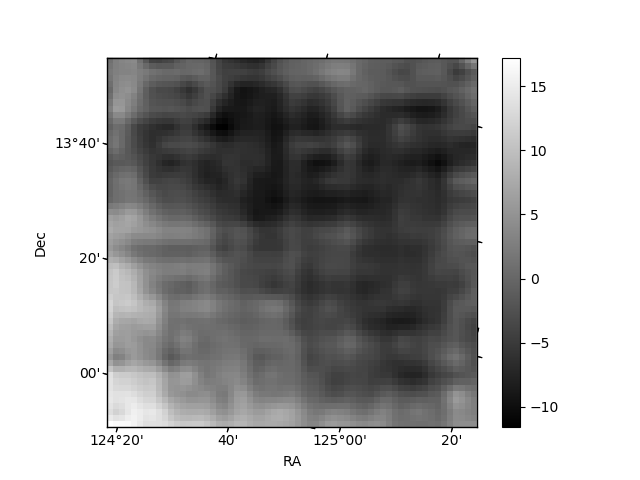
| Quadrant D | 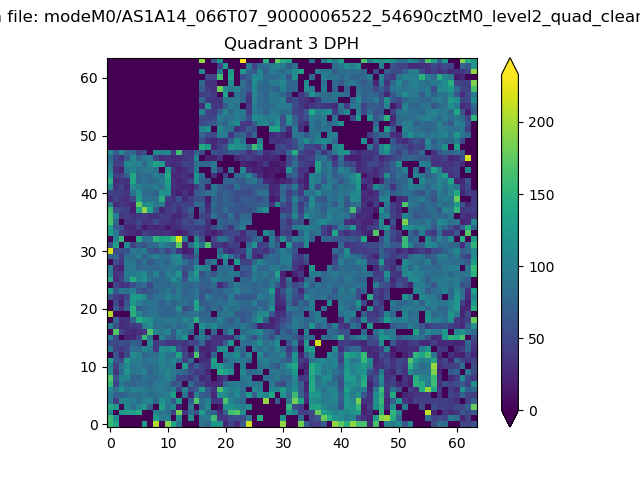 |
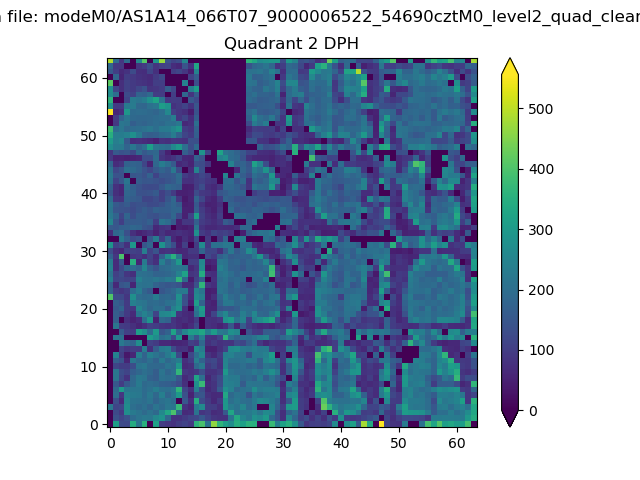 |
Quadrant C |
| Plot type | Count rate plots | Images |
|---|---|---|
| Comparison with Poisson distribution Blue bars denote a histogram of data divided into 1 sec bins. Red curve is a Poisson curve with rate = median count rate of data. |
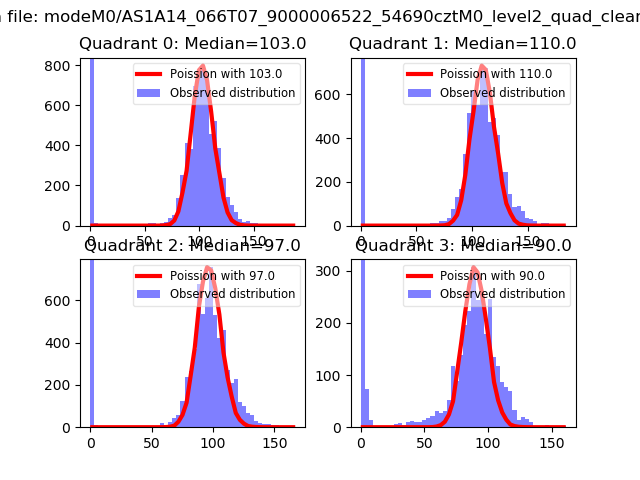 |
 |
| Quadrant-wise count rates Data is divided into 100 sec bins |
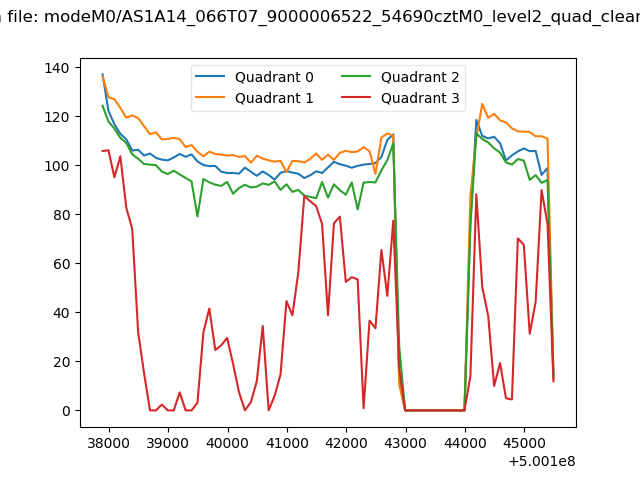 |
|
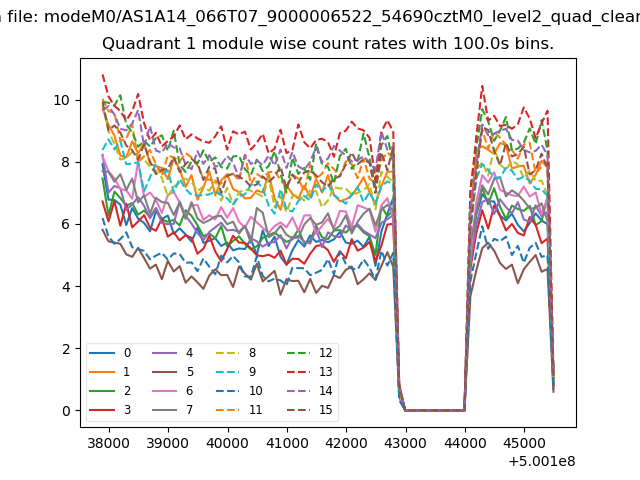
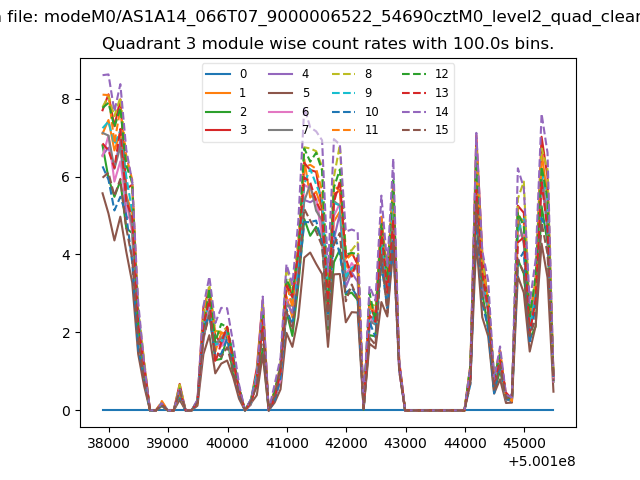
| Module-wise count rates for Quadrant A Data is divided into 100 sec bins |
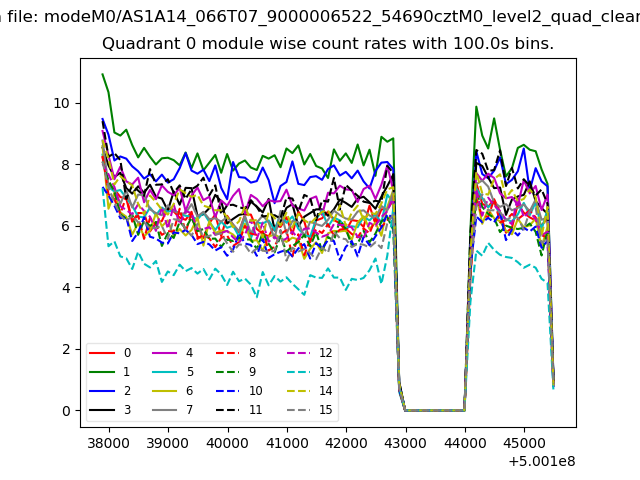 |
 |
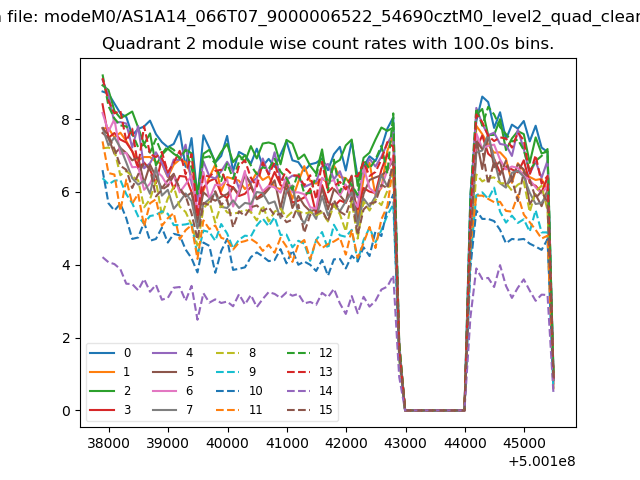
| Module-wise count rates for Quadrant B Data is divided into 100 sec bins |
 |
 |
| Module-wise count rates for Quadrant C Data is divided into 100 sec bins |
 |
 |
| Module-wise count rates for Quadrant D Data is divided into 100 sec bins |
 |
 |
| Parameter | Plot |
|---|---|
| CZT HV Monitor | 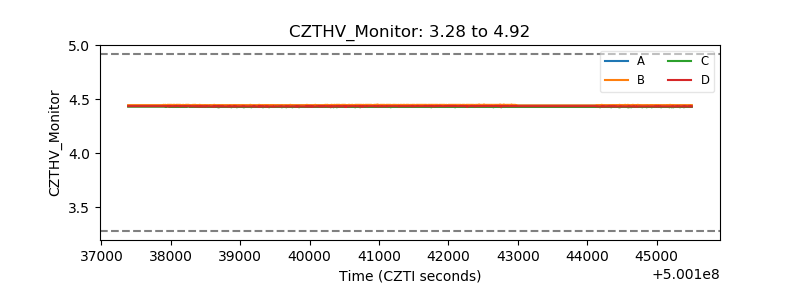 |
| D_VDD | 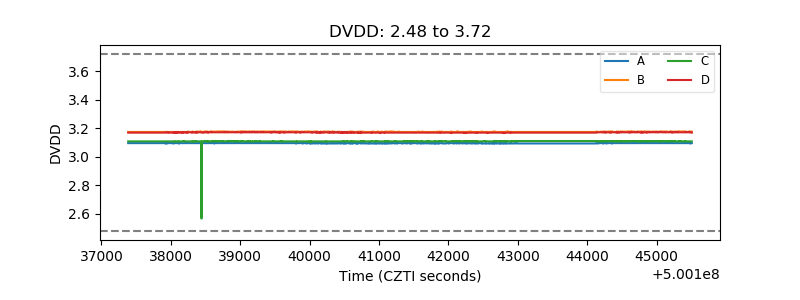 |
| Temperature 1 | 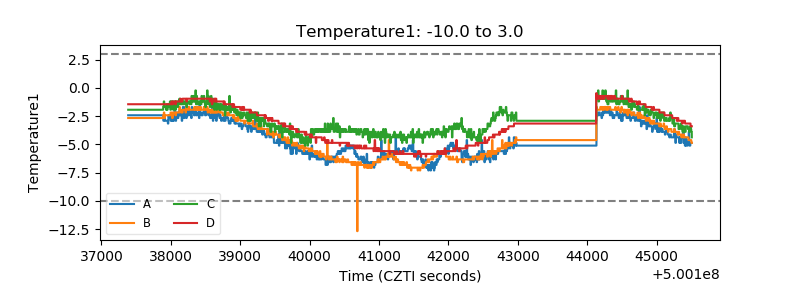 |
| Veto HV Monitor | 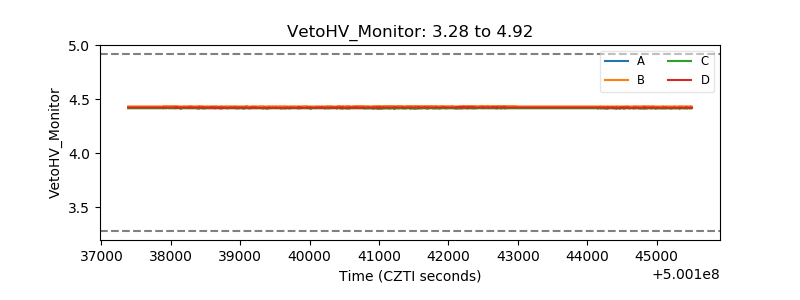 |
| Veto LLD | 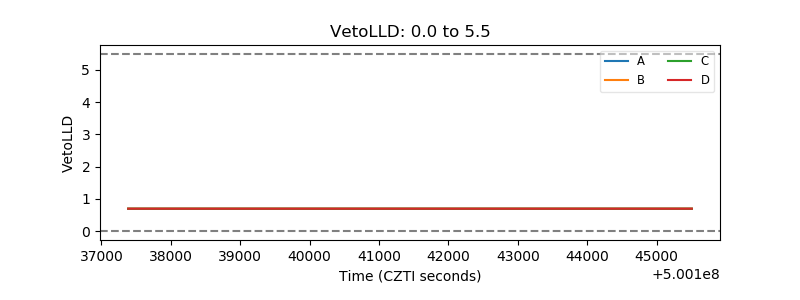 |
| Alpha Counter |  |
| _CPM_Rate | 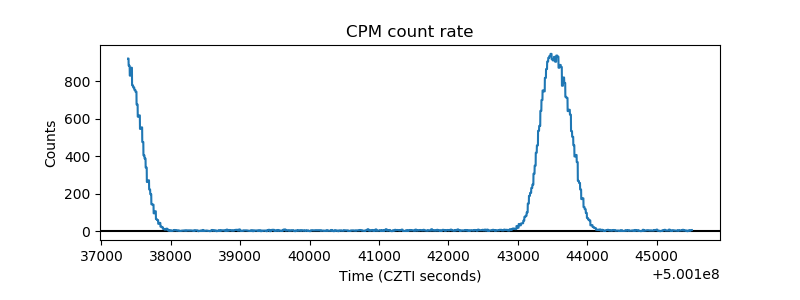 |
| CZT Counter | 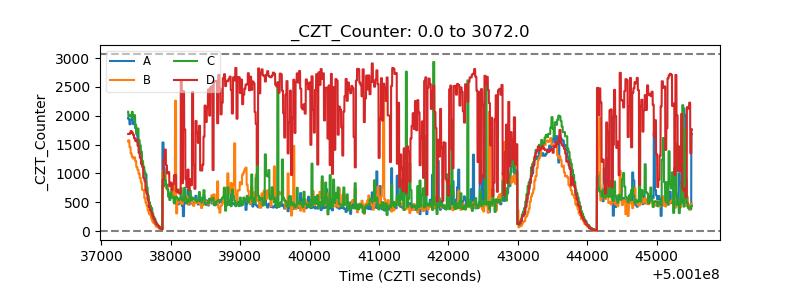 |
| +2.5 Volts monitor |  |
| +5 Volts monitor | 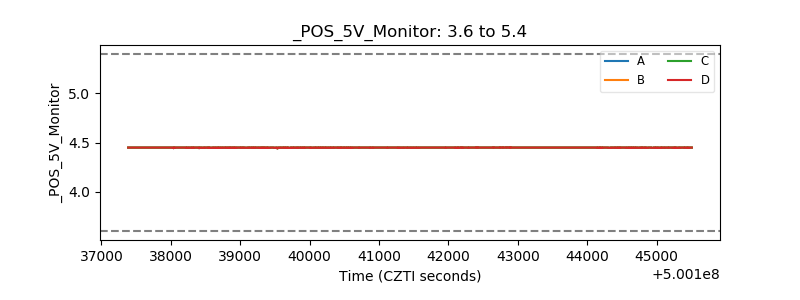 |
| _ROLL_ROT | 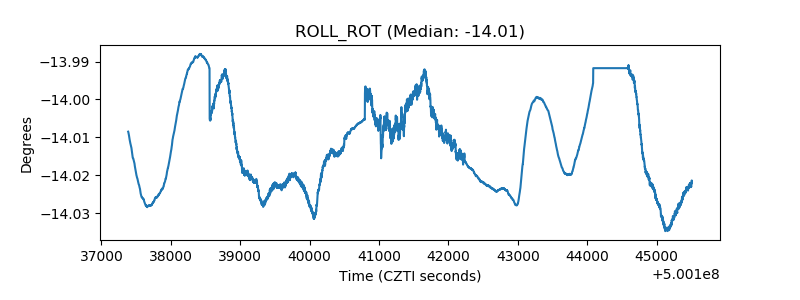 |
| _Roll_DEC | 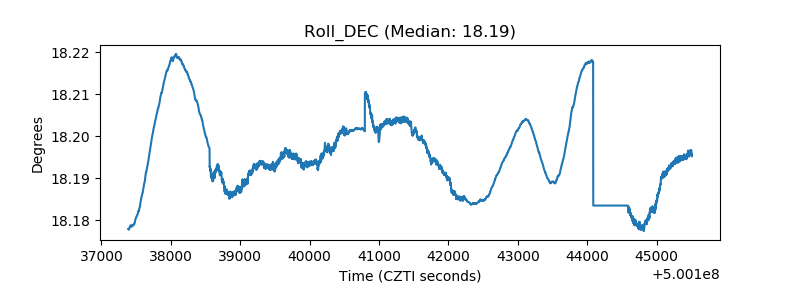 |
| _Roll_RA | 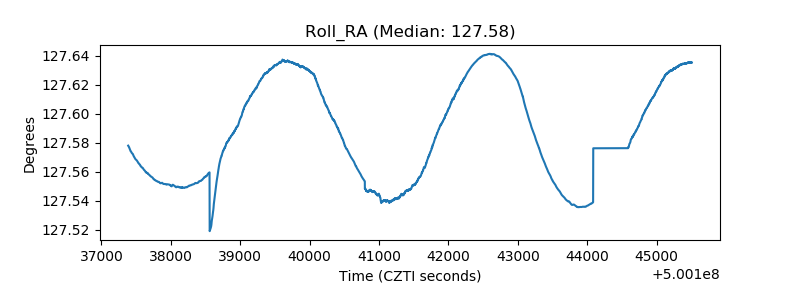 |
| Veto Counter | 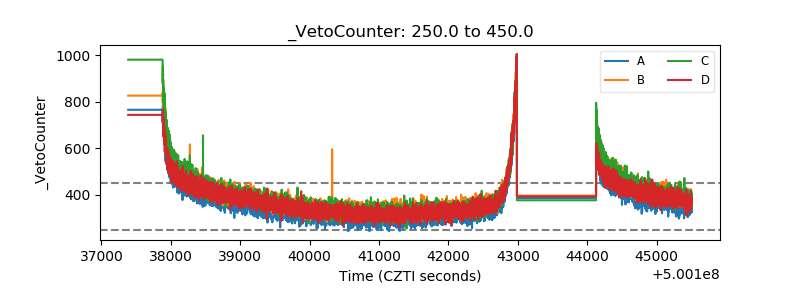 |